

1 / zobaa_a_f_cantel_m_m_i_and_bansal_r_ed_power_quality_monitor
.pdfApplication of Signal Processing in Power Quality Monitoring |
97 |
Baggini A. (2008), Handbook of Power Quality, John Wiley & Sons Ltd, The Atrium, Southern Gate, Chichester,West Sussex PO19 8SQ, England, 2008.
Behera, H.S. Dash, P.K.; Biswal, B. Power quality time series data mining using S-transform and fuzzy expert system, (2010) Applied Soft Computing, Vol. 10, (2010), pp. 945–955.
Bollen, M.H.J.; GU, Y.H. (2006) Signal Processing of Power Quality Disturbances, Institute of Electrical and Electronics Engineers, Published by John Wiley & Sons, Inc.
Cortes, C, Vapnik, V. Support vector networks. Machine Learning, Vol. 20, pp. 273-297, 1995. Dowdy, S.; Wearden, S.; Statistics for Research, Wiley, 1983. ISBN 0471086029, pp. 230. Eristi, H.; Y. Demir, A new algorithm for automatic classification of power quality events
based on wavelet transform and SVM, Expert Systems with Applications, Vol. 37, (2010), pp. 4094–4102.
Flandrin, P.; Rilling, G.; Gonçalvés P. (2004). Empirical mode decomposition as a filter bank, IEEE Signal Processing Letters, Vol.11, No.2, (February 2004), pp. 112-114.
Fletcher , T. Relevance Vector Machines Explained, 2010, www .cs .ucl. ac. uk/ sta_ /T
.Fletcher/.
Gaing Z.L (2004). Wavelet-based neural network for power disturbance recognition and classification. IEEE Transaction on Power Delivery, Vol.19, No.4, (2004), pp. 1560– 1568.
Gargoom, M.; Wen, N.E.; Soong, L. (2008). Automatic Classification and charachterization of power quality events. IEEE Transaction on Power Delivery, Vol. 23, No. 4, (2008), pp. .
Gu, Y.H.; M.H.J., Bollen (2000). Time-frequency and time-scale domain analysis of voltage disturbances, IEEE Transaction on Power Delivery, Vol. 15, No. 4, (October 2000), .
Gunal, S.; Gerek, O.N.; Ece, D.G.; Edizkan, R (2009). The search for optimal feature set in power quality event classification. Expert Systems with Application, Vol. 36, (2009), pp. 10266–10273.
Heydt, G.T.; Fjeld P.S.; Liu, C.C.; Pierce, D.; Tu, L.; Hensley, G. (1999) Applications of the windowed FFT to electric power quality assessment. IEEE Transaction Power Delivery, Vol. 14, No. 4, (1999), pp. 1411–1416.
Hooshmand, R.; Enshaee, A.; (2010) Detection and classification of single and combined power quality disturbances using fuzzy systems oriented by particle swarm optimization algorithm, Electric Power Systems Research, Vol. 80, (2010), pp. 1552– 1561.
Hsieh, C.T.; Lin, J.M.; Huang, S.J. (2010). Slant transform applied to electric power quality detection with field programmable gate array design enhanced, Electrical Power and Energy Systems, Vol. 32, (2010) pp. 428–432.
Huang, N.E.; Shen, Z.; Long, S.R.; Wu, M.C.; Shih, H.H.; Yen, Q.Z.N. ; Tung, C.C.; Liu, H.H.; The empirical mode decomposition and the Hilbert spectrum for nonlinear and non-stationary time series analysis, Proc. R. Soc. Lond. A, Printed in Great Britain (1998), 454, pp. 903-995.
Huang, N.; Xu, D.; Liu, X. (2010), Power Quality Disturbances Recognition Based on HStransform, First International Conference on Pervasive Computing Signal Processing and Applications (PCSPA), Issue Date: 17-19 Sept. 2010.
IEEE 1159: 1995, Recommended practice for monitoring electric power quality, 1995. Jayasree, T.; Devaraj, D.; Sukanesh, R (2010). Power quality disturbance classification using
Hilbert transform and RBF networks, Neurocomputing, Vol. 73, (2010), pp. 1451– 1456.
98 |
Power Quality – Monitoring, Analysis and Enhancement |
Kaewarsa, S.; Attakitmongcol, K.; Kulworawanichpong, T. (2008), Recognition of power quality events by using multi wavelet-based neural networks. International journal of Electric Power Energy and System, Vol. 30, (2008), pp. 254–260.
Kittler, J. Feature set search algorithms. In C. H. Chert (Ed.), Pattern recognition and signal processing, 1978, pp. 41–60. Mphen aan den Rijn, Netherlands:Sijthoff and Noordhoff.
Kohavi, R.; Quinlan, R.; Decision Tree Discovery, Data Mining, University of New South Wales, Sydney 2052 Australia, 1999.
Kschischang, F.R.; The Hilbert Transform, Department of Electrical and Computer Engineering University of Toronto, October 22, 2006.
Landwehr, N., Hall, M., and Frank, E., Logistic Model Tree, Machine Learning, Springer Science, Vol. 59, (2005) pp.161-205.
Liao, Y.; Lee, J.B.; A fuzzy-expert system for classifying power quality disturbances,
Electrical Power and Energy Systems, (2004), Vol. 26, pp. 199–205.
Lu, Z.; Smith, J.S.; Wu, Q.H.; Fitch, J. (2005) Empirical mode decomposition for power quality monitoring, 2005 IEEE/PES Transmission and Distribution Conference & Exhibition: Asia and Pacific Dalian, China.
Mao, K.Z.; Tan, K.C.; Ser, W. Probabilistic neural-network structure determination for pattern classification, IEEE Transaction on Neural Networks, Vol. 11, (2000), pp. 10091016.
Marill, T.; Green, D.M.; (1963), On the effectiveness of receptors in recognition systems. IEEE Transaction on Information Theory, Vol. 9, (1963), pp. 11–17.
MATLAB 7.4 Version Wavelet Toolbox, Math Works Company, Natick, MA. (MATLAB) Meher, S.K. (2008), A Novel Power Quality Event Classification Using Slantlet Transform
and Fuzzy Logic, (2008) International Conference on Power System Technology India, 2008.
Mehera, S.K.; Pradhan, A.K.; Panda, G. (2004). An integrated data compression scheme for power quality events using spline wavelet and neural network. Electric Power Systems Research, Vol. 69, (2004), pp. 213–220.
Mishra, S.; Bhende, C.N.; Panigrahi, B.K. (2008) Detection and classification of power quality disturbances using S-transform and probabilistic neural network, IEEE Transaction on Power Delivery, Vol. 23, No. 1, (January 2008), pp. 280–287.
Moravej, Z.; Vishvakarma, D.N.; Singh, S.P.; (2002) Protection and condition monitoring of power transformer using ANN. Electric Power Components and systems, Vol.30, No.3, (March 2002), pp. 217-231.
Moravej, Z.; Vishwakarma, D.N.; Singh, S.P. (2003) Application of radial basis function neural network for differential relaying of a power transformer, Computers & Electrical Engineering, Vol.29, No.3, (May 2003) pp. 421-434.
Moravej, Z. ; Banihashemi, S.A.; Velayati, M.H. (2009), Power quality events classification and recognition using a novel support vector algorithm. Energy Conversion and Management, Vol. 50, (2009), pp. 3071-3077.
Moravej Z.; Abdoos A.A.; Pazoki M. (2010). Detection and classification of power quality disturbances using wavelet transform and support vector machines. Electric Power Components and Systems, Vol.38, (2010), pp. 182–196.
Application of Signal Processing in Power Quality Monitoring |
99 |
Moravej Z. Pazoki M,; Abdoos A.A (2011). Wavelet transform and multi-class relevance vector machines based recognition and classification of power quality disturbances,
European Transaction on Electrical Power, Vol.21, No.1, (January 2011), pp. .
Moravej, Z.; Abdoos, A.A.; Pazoki, M.; (2011), New Combined S-transform and Logistic Model Tree Technique for Recognition and Classification of Power Quality Disturbances, Electric Power Components and Systems, Vol.39, No.1, (2011), pp. 80-98.
Oleskovicz, M.; Coury, D.V.; Felho, O.D.; Usida, W.F.; Carneiro, A.F.M.; Pires, R.S.; Power quality analysis applying a hybrid methodology with wavelet transforms and neural networks. Electrical Power and Energy Systems, Vol. 31, (2009), pp. 206–212.
Panda, G.; Dash, P.K.; Pradhan, A.K.; & Meher S.K. (2002). Data Compression of Power Quality Events Using the Slantlet Transform, IEEE Transaction on Power Delivery, Vol.17, No.2, (April 2002), pp. 662-662.
Peng, H.; Long, F.; Ding C.; (2005). Feature Selection Based on Mutual Information: Criteria of Max-Dependency, Max-Relevance, and Min-Redundancy. IEEE Transaction on Pattern Analysis and Machine Intelligence, Vol.27, No.8, (August 2005), pp. 1226-1238.
Pinnega, C.R.; Mansinha L.; The S -transform with windows of arbitrary and varying shape. Geophysics, Vol. 68, (2003), pp. 381–385.
Proceedings of the Workshop on Feature Selection for Data Mining: Interfacing Machine Learning and Statistics in conjunction with the 2005 SIAM International Conference on Data Mining April 23, 2005 Newport Beach, CA.
PSCAD/EMTDC Power systems simulation Manual, Winnipeg, MB, Canada, 1997.
Pudil, P.; Novovicova, J.; Kittler, J. (1994), Floating search methods in feature selection. Pattern Recognition Letters, Vol. 15, (1994), pp. 1119–1125.
Rathina Prabha, N.; Marimuthu, N.S.; Babulal, C.K. (2009). Adaptive neuro-fuzzy inference system based total demand distortion factor for power quality evaluation, Neurocomputing, Vol. 73, (2009), pp. 315–323.
Rilling, G.; Flandrin, P.; Gonçalvés, P. (2003).ON Empirical mode decomposition and its algorithm. (2003) IEEE-EURA SIP Workshop on Nonlinear Signal and Image Processing
NSIP-03, Grado (I), 2003.
Rioul, O.; Vetterli, M. (1991). Wavelet and Signal Processing. IEEE Signal Processing Magazine, Vol. 8, No. 4, (October 1991), pp. 14 – 38.
Rodgers, J.L.; Nicewander, W.A. (1988). Thirteen ways to look at the correlation coefficient. The American Statistician, Vol. 42, (1988), pp. 59–66.
Sahu, S.S.; Panda G.; George, N.V. (2009). An improved S-transform for time-frequency analysis. IEEE International Advance Computing Conference (IACC 2009) Patiala, India, 6-7 March 2009, pp. 315-319.
Selesnick, I.W. (1999), The Slantlet Transform, IEEE Transaction On Signal Processing, Vol.47, No.5, (May 1999), pp. 1304-1313.
Shukla, S.; Mishra, S.; Singh, B. (2009). Empirical-mode decomposition with Hilbert transform for power-quality assessment, IEEE Transaction on Power Delivery, Vol. 24, No. 4, (October 2009), pp. 2159-2165.
Son, Y.S.; Baek, J.; A modified correlation coefficient based similarity measure for clustering time-course gene expression data, Pattern Recognition Letters, Vol. 29, (2008) pp. 232242.
Specht, D.F.; Probabilistic neural network. Neural networks, Vol. 1, pp.109-118, 1990.

100 Power Quality – Monitoring, Analysis and Enhancement
Stearn, S.D.; On selecting features for pattern classifiers. In Proceedings of the third international conference on pattern recognition, 1976, pp. 71–75, Coronado,CA.
Steinwart, A. Christmann. Support Vector Machines; New York: Springer, 2008.
Stockwell, R.G (1991). Why use the S-transform?. Northwest Research Associates, Colorado Research Associates Division, 3380 Mitchell Lane, Boulder Colorado USA 80301. American Mathematical Society 1991.
Stockwell, R.G.; Mansinha, L.; Lowe, R.P. (1996). Localization of the complex spectrum: the S-transform. IEEE Transactions on Signal Processing, (1996), Vol. 4, pp. 998–1001.
Tipping, M.E. (2000), the relevance vector machine. Solla SA, Leen TK, Muller KR. Advances in Neural Information Processing Systems 2000; 12: MIT Press, Cambridge, MA.
Tipping ME. The Relevance Vector Machine. Microsoft Research, U.K, 2000.
Tzikas, G.D.; Wei, L.; Likas, A.; Yang, Y.; Galatsanos, N.P. (2006). A tutorial on relevance vector machines for regression and classification with applications, University of Ioannina, Ioanni, GREECE, Illinois Institute of Technology, Chicago, USA, 2006.
Uyar, M.; Yildirim, S.; Gencoglu, M.T.; (2009). An expert system based on S-transform and neural network for automatic classification of power quality disturbances, Expert Systems with Applications, Vol. 36, (2009), pp. 5962–5975.
Uyara, M.; Yildirima, S. & Gencoglub MT (2008). An effective wavelet-based feature extraction method for classification of power quality disturbance signals. Electric Power System Research, Vol. 78, (2008), pp. 1747–1755.
Vapnik, V.N. Statical Learning Theory; Wiely: New York, 1998.
Whitney, A.W. (1971) A direct method of nonparametric measurement selection. IEEE Transaction on Computers, Vol.20, (1971), pp. 1100-1103.
Yang, J.; Honavar, V. (1998), Feature subset selection using a genetic algorithm. IEEE Intelligent Systems and their Applications, Vol. 2, (1998), pp. 44–49.
Zhang, M.; Li, K.; Hu, Y.; (1998) A real-time classification method of power quality disturbances, Electric Power Systems Research, Vol. 81, (1998), pp. 660–666, 2011.
6
Methodes of Power Quality Analysis
Gabriel Găşpăresc
“Politehnica” University of Timişoara
Romania
1. Introduction
In the last decades electronics and telecommunications have known an unprecedented development, the number of non-linear loads (power electronics) has increased. New more energy efficient devices and equipments, controlled by microprocessors, have appeared. They are also more sensitive to electromagnetic disturbances, produced by neighborhood devices or as a result of the shared infrastructure, which can affect the power quality for many industries or even for the domestic consumers. A poor power quality can cause the malfunction of electrical and electronic devices and equipments, instability, short lifetime. In case of computers the disturbances may lead to: corrupted files, losing files and to the destruction of the hardware components. Additional costs can occur for both, suppliers and consumers (for instance, after a power interruption on a production line a certain time is needed to restart, which leads to a reduction in production) (Bollen et al., 2006), (Dungan et al., 2004), (Ignea, 1998).
Simultaneously, the expansion of the suppliers, the competition on the market, the increase of the studies in this field, the better informed customers have led nowadays to higher requirements for power quality. Both categories, the suppliers and the consumers are more concerned about the power quality. In order to satisfy consumers’ requirements, suppliers have invested in more energy efficient equipments. Frequently, just these are affected by power problems, and they become in turn disturbances sources.
A power quality monitoring system provides huge volume of raw data from different locations, acquired during long periods of time and the amount of data is increasing daily (Barrera Nunez et al., 2008). The visual inspection method is laborious, time consuming and is not a solution. Features extraction of power quality disturbances using methods of power quality analysis, in order to achive automatic disturbance recognition, is important for understanding the cause-effect relation and to improve the power quality.
Features extraction of power quality disturbances using methodes of power quality analysis, in order to achive automatic disturbance recognition, is important for understanding the cause-effect relation and to improve the power quality.
The classical method of power quality analysis used in power quality monitoring sytems has been the discrete Fourier transform (DFT). Nowadays new methods has been proposed in literature: short time Fourier transform (STFT) (Bollen et al., 2006), discrete wavelet transform (DWT) (Driesen et al., 2003) and discrete Stockwell transform (DST) (Gargoom, 2008). Sometimes those methodes are integrated in company with fuzzy logic (FL) (Chilukuri et al., 2004), artificial neural networks (ANN) (Dash, 2007), (Gang, 2004) or super vector machines (SVM) (Yong, 2005). A comparative study is presented as follows.
102 |
Power Quality – Monitoring, Analysis and Enhancement |
2. Discrete Fourier transform
In Fourier analysis a signal is decomposed into a sum of sinusoidal signals (harmonics). The Fourier transform is a mathematical transformation from the time domain to the frequency domain.
The Discrete Fourier Transform (DFT) provides frequency domain analysis of discrete periodic signals. For such a signal x[n] with finite length N the Fourier transform is defined according to next relation
X ( k) = |
N − 1 |
|
2π |
|
|
|
x n e− j |
|
kn |
(1) |
|
N |
|||||
|
|
|
|
|
n= 0
where k=0,1,…,N-1.
For the input signal x[n] if the number of samples N is power of 2 it can be applied FFT (Fast Fourier Transform) algorithm. The aim of the algorithm is to reduce the number of operations and implicit the calculation time.
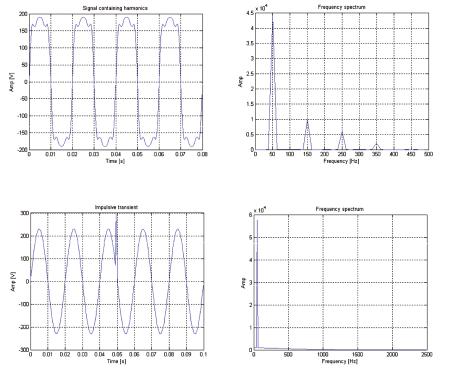
The use of Fourier transform for signals affected by electromagnetic disturbances reveals changes of spectral components of initial signals caused by the disturbances presence. Fig. 1 shows a sinusoidal signal disturbed with harmonic distortions. From the frequency spectrum, obtained appling FFT on this signal, are calculated the odd harmonic orders: the 3rd, 5th and 7th.
Fig. 1. Harmonic distortions
Fig. 2. Impulsive transient
Methodes of Power Quality Analysis |
103 |
In most cases the power quality disturbances are nonstationary and nonperiodic. For power quality analysis is useful to achive time localization of the disturbances (determining the start and end times of the event) which can not be done by Fourier transform. The limitation is obvious especially for transient phenomenas (quick variations), difficult to observe visually. In Fig. 2 is considered a sinusoidal signal disturbed with an impulsive transient. Like in Fig. 1 below, the frequency spectrum provides informations about frequency spectral components but no information about time localization.
3. Short time Fourier transform
The Short-Time Fourier Transform (STFT) provides informations in time domain (start time, stop time, rise time, duration) and frequency domain about disturbances. Usually signals parameters (amplitude, frequency, phase) are not constants in time and the signals are nonstationary. For a discrete signal x[n] the discrete transform is defined
X n,λ |
|
= |
∞ |
x n + m |
|
w m |
|
e− jλ m |
(2) |
|
|
|
|
|
|||||||
|
|
|
|
|
|
|||||
|
|
|
|
|
|
|
|
|
m= −∞
where w[m] is a window function with size L.
Usually the number of samples N of the signal x[n] is finite and the window w[m] has the next expression
w l ≠ 0, for 0 ≤ l ≤ L − 1 w[l] = 0, for l < 0 and l ≥ L
where L is window size.
The window size L can be smaller or equal to N, the number of samples of signal x[n]
N ≥ L
Relation (2) becomes
(3)
(4)
|
|
|
L− 1 |
|
|
|
|
|
jlλ |
|
X n,λ |
|
= |
|
x n + l |
|
w l |
|
e− |
|
(5) |
N |
||||||||||
|
|
|
|
|
|
|
||||
|
|
|
|
|
|
|
|
|
|
l= 0
The square modulus of short time Fourier transform is called spectrogram and is a time-frequency representation.
Power quality disturbances cover a broad frequency spectrum, starting from a few Hz (flicker) to a few MHz (transient phenomenas). The frequency spectrum of a signal affected by a transient voltage contains high frequency components and also low frequency components. It is difficult to analyze such a signal using the STFT because the window size and implicit time-frequency resolution are fixed.
3.1 Window functions
The window functions are useful for time domain smoothing of acquired signals, reduction of spectral distortions and better resolution.
Main parameters of window function are:
-main lobe width;
104 |
Power Quality – Monitoring, Analysis and Enhancement |
-side lobe attenuation;
-minimum stopband attenuation.
The main lobe width has influence on frequency resolution. The possibility to distinguish two signals with close frequencies increases when the lobe width decreases, but for a narrow lobe the energy of side lobes increase against main lobe energy. The results are the increase of side lobe amplitudes and attenuation. Consequently, it is necessary a compromise between time and frequency resolution. A narrow window provides a good time resolution while a large one is useful for good frequency resolution.
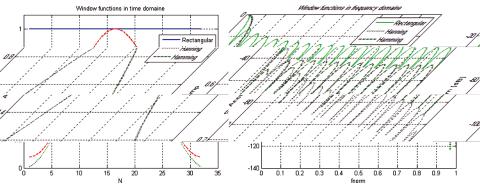
Figure 3 shows the time domain and frequency domain representations of the rectangular, Hanning and Hamming window.
Fig. 3. Window functions
The rectangular window is defined in the next relation
w(n) = 1 |
(6) |
where n=0,1, 2, N-1 and N is window size.
This function (fig. 3) provides just time truncation of signals, it does not affect the amplitudes of signals and the spectral distortions are the biggest from window functions. It is useful in analysis of transient disturbances with duration smaller like window size and close amplitudes.
The Hanning window is defined as
w(n) = 0,5 |
+ 0,5cos |
|
2nπ |
(7) |
||
|
|
|
||||
N |
||||||
|
|
|
|
|
||
where n=0,1, 2, N-1.
The window has lower side lobes like previous function (fig. 3). It is used for transient disturbances with duration bigger like window size, usually when the signals components are not knowed
The Hamming window is described in next relation
w(n) = 0,54 |
+ 0,46cos |
|
2nπ |
(8) |
||
|
|
|
||||
N |
||||||
|
|
|
|
|
||

Methodes of Power Quality Analysis |
105 |
where n=0,1, 2, N-1.
In time domain the window has a shape similar to the Hanning window (fig. 3), the differences are: the ends of window are not so close to zero, in frequency domain the side lobes are lower and main lobe width is larger. It is used specially for sinusoidal signals with close frequencies.
The table 1 shows the side lobe level of smoothing windows: the rectangular window has the lowest attenuation level and the Hamming window has the highest value.
Window function |
Side lobe level [dB] |
Rectangular |
-13 |
Hanning |
-31 |
Hamming |
-42 |
Table 1. Side lobe level of smoothing windows
3.2 Using the STFT-transform for transient signal analysis
A sinusoidal signal with frequency of 50 Hz is disturbed by an oscillatory transient with the frequency of 1000 Hz. The obtained spectograms for rectangular, Hanning and Hamming windows, with size 16, are presented in figure 4.
Fig. 4. STFT of an oscillatory transient

106 |
Power Quality – Monitoring, Analysis and Enhancement |
From previous figure it can be seen that for rectangular window the spectral distorsions are the biggest, it fallows Hanning window with smaller distortsions and Haming window with the smallest distortsions (according to Table 1). Suplementary, for the disturbance it can be observed the start time, stop time, duration and frequency domain.
The influence of window size is shown in figure 5. The increase of window size it has increased also the resolution in frequency domain, but has decreased the resolution in time domain. In figure 5, for the window with the largest width, it can be seen that the maximum spectral component is 1000 Hz and this value is the frequency of oscillatory transient overlapped on the sinusoidal signal. In the time domain appears a sliding to zero in comparison with the rest of spectrograms.
Fig. 5. Influence of window size on time and frequency resolution
A solution to obtain high resolution in the time domain and also in the frequency domain is to use two window functions with different size: a narrow window for good time resolution and a large window for good frequency resolution. Than the STFT is applied two times using both windows. But this method has a disadvantage, it increases the number of operations.
Figure 6 shows the spectograms obtained for a sinusoidal signal with frequency of 50 Hz disturbed by an oscillatory transient with the frequency of 1500 Hz (the sampling rate is