

Gas Market Report 2019 |
4. Prices and market reforms |
Egypt
Egypt became a net natural gas importer in 2015 after a decade of LNG exports, pushed by decreasing domestic production and growing consumption. In parallel with this shift in supply structure, the Egyptian government embarked on a process of liberalising its energy market, starting with the electricity sector with the enactment of the “New Electricity Law” (Law No. 87 of 2015). The law allows for private-sector participation in the generation and distribution of electricity, introduces the concept of competitive electricity markets and restructures the roles and competencies of incumbent utility and transmission companies to ensure fair competition. The electricity liberalisation process will be completed by 2022 (see Chapter 1).
Reform of the domestic natural gas market was introduced in August 2017 with the “Law for Gas Market Activities Regulation” (Law No. 196 of 2017), implemented in early 2018 by Prime Ministerial Decree No. 239 of 2018. The new framework encompasses the opening of the gas market to new shippers and suppliers, third-party access to infrastructure, the unbundling of vertically integrated companies, and the creation of the Gas Regulation Authority (GasReg) in charge of regulating and monitoring gas market activities – which does not include exploration and production (GasReg, 2017).
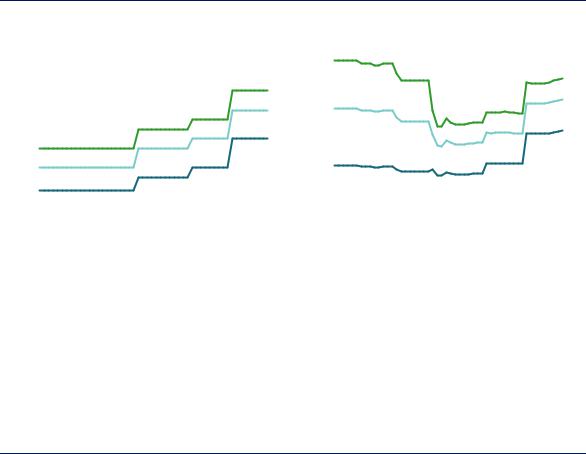
Figure 4.12. Evolution of natural gas consumer prices in Egypt, 2015–19
|
|
|
|
|
|
|
|
|
|
|
|
|
EGP/m3 |
|
|
|
|
|
|
|
|
|
|
|
|
|
|
|
|
|
|
|
|
|
|
|
|
|
|
|
USD/MBtu |
||||||||||||||||||||||
4 |
|
|
|
|
|
|
|
|
|
|
|
|
|
|
|
|
|
|
|
|
|
|
|
|
|
|
|
|
|
|
|
5 |
|
|
|
|
|
|
|
|
|
|
|
|
|
|
|
|
|
|
|
|
|
|
|
|
|
|
|
|
|
|
|
|
|
|
|
|
|
|
|
|
|
|
|
|
|
|
|
|
|
|
|
|
|
|
|
|
|
|
|
|
|
|
|
|
|
|
|
|
|
|
|
|
|
|
|
|
|
|
|
|
|
|
|
|
|
|
|
|
|
|
|||||
3 |
|
|
|
|
|
|
|
|
|
|
|
|
|
|
|
|
|
|
|
|
|
|
|
|
|
|
|
|
|
|
|
4 |
|
|
|
|
|
|
|
|
|
|
|
|
|
|
|
|
|
|
|
|
|
|
|
|
|
|
|
|
|
|
|
|
|
|
|
|
|
|
|
|
|
|
|
|
|
|
|
|
|
|
|
|
|
|
|
|
|
|
|
|
|
|
|
|
|
|
|
|
|
|
|
|
|
|
|
|
|
|
|
|
|
|
|
|
|
|
|
|
|
|
|
||||
|
|
|
|
|
|
|
|
|
|
|
|
|
|
|
|
|
|
|
|
|
|
|
|
|
|
|
|
|
|
|
3 |
|
|
|
|
|
|
|
|
|
|
|
|
|
|
|
|
|
|
|
|
|
|
|
|
|
|
|
|
|
|
||
2 |
|
|
|
|
|
|
|
|
|
|
|
|
|
|
|
|
|
|
|
|
|
|
|
|
|
|
|
|
|
|
|
|
|
|
|
|
|
|
|
|
|
|
|
|
|
|
|
|
|
|
|
|
|
|
|
|
|
|
|
|
|
||
|
|
|
|
|
|
|
|
|
|
|
|
|
|
|
|
|
|
|
|
|
|
|
|
|
|
|
|
|
|
|
|
|
|
|
|
|
|
|
|
|
|
|
|
|
|
|
|
|
|
|
|
|
|
|
|
|
|
|
|
||||
|
|
|
|
|
|
|
|
|
|
|
|
|
|
|
|
|
|
|
|
|
|
|
|
|
|
|
|
|
|
|
2 |
|
|
|
|
|
|
|
|
|
|
|
|
|
|
|
|
|
|
|
|
|
|
|
|
|
|
|
|
|
|
||
|
|
|
|
|
|
|
|
|
|
|
|
|
|
|
|
|
|
|
|
|
|
|
|
|
|
|
|
|
|
|
|
|
|
|
|
|
|
|
|
|
|
|
|
|
|
|
|
|
|
|
|
|
|
|
|
|
|
|
|
||||
1 |
|
|
|
|
|
|
|
|
|
|
|
|
|
|
|
|
|
|
|
|
|
|
|
|
|
|
|
|
|
|
|
|
|
|
|
|
|
|
|
|
|
|
|
|
|
|
|
|
|
|
|
|
|
|
|
|
|
|
|
|
|
||
|
|
|
|
|
|
|
|
|
|
|
|
|
|
|
|
|
|
|
|
|
|
|
|
|
|
|
|
|
|
|
|
|
|
|
|
|
|
|
|
|
|
|
|
|
|
|
|
|
|
|
|
|
|
|
|
|
|
|
|
||||
|
|
|
|
|
|
|
|
|
|
|
|
|
|
|
|
|
|
|
|
|
|
|
|
|
|
|
|
|
|
|
1 |
|
|
|
|
|
|
|
|
|
|
|
|
|
|
|
|
|
|
|
|
|
|
|
|
|
|
|
|
|
|
||
|
|
|
|
|
|
|
|
|
|
|
|
|
|
|
|
|
|
|
|
|
|
|
|
|
|
|
|
|
|
|
|
|
|
|
|
|
|
|
|
|
|
|
|
|
|
|
|
|
|
|
|
|
|
|
|
|
|
|
|
||||
|
|
|
|
|
|
|
|
|
|
|
|
|
|
|
|
|
|
|
|
|
|
|
|
|
|
|
|
|
|
|
|
|
|
|
|
|
|
|
|
|
|
|
|
|
|
|
|
|
|
|
|
|
|
|
|
|
|
|
|
|
|
||
0 |
|
|
|
|
|
|
|
|
|
|
|
|
|
|
|
|
|
|
|
|
|
|
|
|
|
|
|
|
|
|
|
|
0 |
|
|
|
|
|
|
|
|
|
|
|
|
|
|
|
|
|
|
|
|
|
|
|
|
|
|
|
|
|
|
Jan-15 May-15 Sep-15 Jan-16 May-16 Sep-16 Jan-17 May-17 Sep-17 Jan-18 |
May-18 Sep-18 Jan-19 |
|
Jan-15 May-15 Sep-15 Jan-16 |
May-16 Sep-16 Jan-17 May-17 Sep-17 Jan-18 May-18 Sep-18 Jan-19 |
|||||||||||||||||||||||||||||||||||||||||||||||||||||||||||
|
|
|
|
|
|
|
|
|
Less than 30 m3/month |
|
|
|
|
|
|
Between 30 and 60 m3/month |
|
|
|
|
Above 60 m3/month |
||||||||||||||||||||||||||||||||||||||||||
|
|
|
|
|
|
|
|
|
|
|
|
|
|
|
|
|
|
||||||||||||||||||||||||||||||||||||||||||||||
Sources: Central Bank of Egypt (2019), Official Exchange Rates Historical, www.cbe.org.eg/en/EconomicResearch/Statistics/Pages/OfficialRatesHistorical.aspx; Egypt Today (2017), “No increase in gas prices for factories: Minister”, www.egypttoday.com/Article/3/9297/No-increase-in-gas-prices-for-factories-Minister; Enterprise (2016), “Breaking news: Egypt to cut fuel subsidies, raise price of petrol at the pumps”, https://enterprise.press/stories/2016/11/04/breaking- news-egypt-to-cut-fuel-subsidies-raise-price-of-petrol-at-the-pumps/; Fick, M. (2014), “UPDATE 1-Egypt to lift natural gas prices for homes, businesses”, Reuters, www.reuters.com/article/egypt-energy-gas-idUSL6N0ND1J520140421; Hua and Stanway (2018), “CORRECTED-UPDATE 1-Egypt hikes gas prices by up to 75 pct in IMF-backed austerity plan”, Reuters, www.reuters.com/article/egypt-economy-gas/update-1-egypt-hikes-gas-prices-by-up-to-75-pct-in-imf-backed-austerity-plan- idUSL8N1UH0DX.
Successive natural gas price hikes have been enacted since late 2016 as part of a wider economic reform programme and floating of the Egyptian pound.
The scope of the Gas Market Regulation law does not include natural gas pricing. On the production side, selling prices to the Egyptian Natural Gas Holding Company (EGAS), the Egyptian NOC, are determined by the provisions of production-sharing agreements. These were set at a flat rate of below USD 3/MBtu until the mid-2010s, and then substituted by individual prices negotiated on a project basis for recent offshore developments. On the
PAGE | 167
IEA. All rights reserved.

Gas Market Report 2019 |
4. Prices and market reforms |
consumption side, natural gas prices are set by government decree. Prices for retail consumers have been revised three times since the end of 2016 (Figure 4.12), in conjunction with the reform programme linked to the USD 12 billion International Monetary Fund (IMF) three-year Extended Fund Facility (EFF) and the Central Bank of Egypt’s decision to float the Egyptian pound against the US dollar in November 2016.
The latest price revision, enacted in September 2018, led to increases for retail consumers of up to 75%. Prices for industrial consumers increased by an average of 50% in November 2016 (Adel, 2016). Similar price revisions were conducted for petroleum products, electricity and other regulated products and services in the framework of the EFF reform programme. The IMF reported in February 2019, as part of its fourth EFF review, a decrease in the share of energy subsidies from 4.1% of gross domestic product in fiscal year (FY) 2016/17 to 2.1% for FY2018/19, and a projected 1.2% for FY 2019/20 (IMF, 2019). The Minister of Finance announced in late 2018 that Egypt would not seek further IMF funding at the end of the EFF. At the time of writing, there is no guideline on future natural gas price evolution or deregulation, in a context where Egypt regained self-sufficiency as a natural gas producer and is planning to progressively restart its LNG exports.
Russia
The objective of achieving a Russian domestic price transition to international benchmarks was first formulated in 2006 when the government announced its objective to converge with European netback prices.8 The successive price increases, coupled with the opportunity for alternative suppliers to enter the domestic market, led to a diminution of Gazprom’s market share.
Gazprom retains its role of pipeline system operator and is required to provide nondiscriminatory access to alternative suppliers – in 2017 it provided transmission services to 24 alternative suppliers for a volume of 138 bcm, out of a total of 354 bcm distributed domestically (representing a 40% market share for alternative suppliers excluding off-grid consumption) (Gazprom, 2019). Gazprom’s main competitors on the domestic market are oil and gas producing companies such as Novatek, Rosneft and Lukoil. In respect of the crossborder natural gas trade, Gazprom retains its monopoly on pipeline exports, while the legal framework was amended in 2013 by Presidential Order to allow for alternative suppliers to export LNG (Reuters, 2013), which enabled Novatek to develop its Yamal LNG export facility.
The Federal Antimonopoly Service (FAS) reportedly drafted a government resolution in mid2018 that supports a framework to ensure a transition to market-based prices for the wholesale natural gas market to be effective by mid-2019 (Analytical Center for the Government of the Russian Federation, 2018).
Retail prices for residential consumers have been re-evaluated several times over the recent past (Figure 4.13), growing by 22% between early 2015 and mid-2018 from RUB 5 070 (Russian rubles) to RUB 6 180 per thousand cubic metres. However, the ruble’s depreciation since the beginning of 2018 has offset part of the increase when converting domestic prices into US dollars, thus widening the gap with international market prices.
8 That is, export prices to Europe minus transport costs and transit fees.
PAGE | 168
IEA. All rights reserved.