

2
ELECTRICAL METHODS OF NONIDEAL PLASMA
GENERATION
The electrical methods of nonideal plasma generation include two principally di erent techniques, namely, the heating in resistance furnaces of ampoules containing the material under investigation and Joule heating of samples of material by an electric current passed through the latter. A resistance furnace can be used to obtain homogeneous volumes of plasma without passing an electric current through it and can record the plasma parameters to a relatively high accuracy. On the other hand, the static character of the method causes the restriction of its capabilities to temperatures of up to 3000 K. This is due to great di culties associated with the choice of structural materials. The techniques utilizing Joule heating include high–pressure gas discharges in thick–walled capillaries, the heating of materials with current in an atmosphere of inert gas, discharges in liquids, and some other techniques. These techniques, which are mainly pulsed, permit of plasma generation at considerably higher temperatures of up to 105 K. The principal di culties of these methods are caused by the di culty of attaining the homogeneity of plasma volumes and by various plasma instabilities.
2.1Plasma heating in furnaces
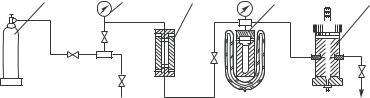
A detailed description of stationary methods of plasma generation can be found in the reviews by Alekseev and Iakubov (1983, 1986). These methods are based on heating an ampoule containing the material under investigation (measuring cell) in electric furnaces of various designs. The entire unit is placed in a chamber under a high pressure of inert gas. Shown by way of example in Fig. 2.1 is the schematic of a facility which was used (Alekseev 1968) to investigate alkali metals at high temperatures and pressures. Argon from cylinder (1) was fed via a system of valves to chamber (3) for cleaning. Cleaned argon was delivered to a nitrogen thermocompressor (4) with the pressure in the latter rising to 600 bar, and from the thermocompressor to measuring chamber (5) accommodating a heater and a measuring cell. The pressure was monitored by gauges (2). The temperature was determined using a thermocouple with its cold junction placed in a melting ice bath. If the required pressure level exceeded 600 bar, the facility was modified: the gas was compressed to 5000 bar using a booster (Kikoin and Senchenkov 1967).
High temperature values in the region of nonideality present the principal di culty of static methods which is due to the di culty of selection of the structural materials for measuring cells. Especially serious is the extremely narrow
26
PLASMA HEATING IN FURNACES |
27 |
||||
|
|
|
|
|
|
|
|
|
|
|
|
|
|
|
|
|
|
|
|
|
|
|
|
|
|
|
|
|
|
|
|
|
|
|
|
|
|
|
|
|
|
|
|
|
|
|
|
Fig. 2.1. Schematic of a facility for the generation and investigation of nonideal plasma of metals in the region of high temperatures and pressures (Alekseev 1968): 1, cylinder with argon; 2, pressure gauges; 3, argon cleaning system; 4, thermocompressor; 5, high–pressure chamber.
choice of insulating materials. The best insulating properties are observed in insulators of pure aluminum, zirconium, beryllium, and thorium oxides. Speaking of metals, the best materials include plastic tungsten, tungsten and molybdenum alloys, and molybdenum. The construction of a reliable cell calls for a high degree of experimental craftsmanship. As regards the development of the static methods of nonideal plasma research, note should be made of the importance of the pioneering work by Kikoin et al. (1966) and Hensel and Franck (1968). In the 1970s, new designs of measuring cells were developed which helped considerably to improve the accuracy of the experimental data. The results of previous studies were often considerably refined and, in some cases, revised. At present, the experimental data obtained in di erent laboratories are usually found to be in adequate agreement with each other.
The most convenient object for investigations of the nonideality e ect is cesium which has a low ionization potential (I = 3.89 eV), low critical pressure (about 110 bar), and a critical temperature that is quite accessible to static experiments (about 2000 K). A fairly high saturated vapor pressure at relatively low temperatures permits the investigation a nonideal cesium plasma at di erent levels of interparticle interaction (Renkertet al. 1969; Alekseev et al. 1970a, 1970b, 1975, 1976; Renkert et al. 1971; Barol’skii et al. 1972; Pfeifer et al. 1973; Sechenov et al. 1977; Dikhter and Zeigarnik 1977; Isakov and Lomakin 1979; Kulik et al. 1984; Borzhievsky et al. 1987).
2.1.1Measurement of electrical conductivity and thermoelectromotive force
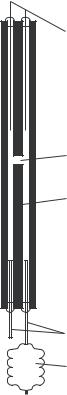
The requirements of measuring cells include high corrosion resistance of their walls upon contact with the plasma, air–tightness of contacts between the insulating ceramics and metal electrodes, and the protection of material under investigation against contact with an inert gas. Figure 2.2 illustrates a measuring cell of beryllium oxide with an H–shaped measuring volume in which the metal under investigation does not come in contact with the pressure-transmitting gas (Alekseev et al. 1976). Two through holes with a jumper in the center were made in the cell body (2) of beryllium oxide. Current (solid) and potential (tubular)
28 ELECTRICAL METHODS OF NONIDEAL PLASMA GENERATION
Cell (closed) for measuring the electrical conductivity (Alekseev et al. 1976): 1, H–shaped measuring volume; 2, beryllium oxide ceramics; 3, electrodes; 4, expanders of the material under investigation.
electrodes (3) were sealed at the ends. Using such a structure, one can measure the resistance in a volume whose uniformity is reliably guaranteed. An elastic expander, bellows (4), was attached to one of the ends (in a closed ampoule, the material expands upon heating) while through the other end liquid cesium was delivered in vacuum. After filling the cell and bellows with cesium, the measuring cell was sealed o .
The measuring current was passed through the bottom electrodes while the top electrodes were used to measure the voltage drop. Given the jumper dimensions, one can calculate the resistance. The error in measuring the cesium resistance at a temperature of up to 1300 K amounts to 3% and in the region of metallization (“metal–dielectric” transition) to 10% while in dense cesium vapors at a temperature above 2000 K this error may exceed 50%. The temperature is measured by W/Rh thermocouples. Special precautions may be taken
PLASMA HEATING IN FURNACES |
29 |
||
|
|
|
|
|
|
|
|
|
|
|
|
|
|
|
|
|
|
|
|
|
|
|
|
Fig. 2.3. Cell for measuring the coe cient of electrical conductivity, equipped with a guard-ring electrode (Borzhievsky et al. 1987): 1 and 5, measuring electrodes; 2 and 4, insulation ring; 3, guard ring; 6, measuring volume.
to eliminate the e ect of leakage currents on the electrode surface. Borzhievsky et al. (1987) measured the coe cient of electrical conductivity by the two–probe technique using a guard-ring electrode 3 made of sapphire (Fig. 2.3). Equal potentials of the electrode and guard-ring electrode 3 are maintained. Therefore, the current being measured (between the electrodes 1 and 5) could only flow in the radial direction in the plasma volume 6. It was the objective of Borzhievsky et al. (1987) to measure the coe cient of electrical conductivity of low–temperature cesium vapors, T ≤1200 K.
A thermoelectric e ect shows up in matter in the presence of a temperature
gradient, |
|
F = j/σ + S T, |
(2.1) |
where S is the thermoelectric coe cient usually referred to as the thermoelectromotive force, and F is the gradient of the electrochemical potential. In static experiments, the potential di erence U is measured, which appears at the ends of an open circuit consisting of dissimilar conductors. If the circuit contains two contacts so that the end conductors are of like metal (tungsten), with a temperature gradient developed along the middle conductor (cesium), a potential di erence appears at the circuit ends,
T2 |
|
|
U = |
(SCs − SW) dT , |
(2.2) |
T1 |
|
|
where T1, T2 define the temperature di erence.
Since the temperatures are high, during the experiment it is very di cult to maintain with adequate accuracy small temperature di erences between the
30 ELECTRICAL METHODS OF NONIDEAL PLASMA GENERATION
junctions. One should bear in mind that under these conditions the thermal e.m.f. may strongly depend on temperature. Averagings may also produce an appreciable error even in small temperature intervals. Therefore, the thermoelectromotive force is measured by a so–called integral technique. The “cold” junction is maintained at some known low temperature T1 while the “hot” junction temperature T2 varies. As a result, the quantity U (T2) is measured. By di erentiating the relationship U (T2), the thermal e.m.f. is obtained.
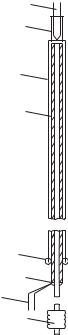
Consider now the structure of a measuring cell used to measure the thermoelectric properties of cesium and mercury plasma. The cell illustrated in Fig. 2.4 was employed for measurements using the integral technique (Alekseev et al. 1975, 1976). This cell was manufactured from a tungsten tube (3) terminating in an expander 8. Arranged coaxially inside the tube was an insulator (4) comprising a top electrode (2) in the form of a thin–walled tungsten tube with a thin tungsten bottom welded on its lower end and a W/Rh thermocouple (1) welded in the bottom. The thermocouple ends insulated by beryllium oxide ceramics passed out through the top end of the tube.
Cell for measuring the thermal e.m.f. (Alekseev et al. 1975, 1976): 1, thermocouple; 2, tungsten electrodes; 3, tungsten casing; 4, beryllium oxide insulator; 5, junction between the ceramics and the casing; 6, junction between the bottom electrode and the insulator; 7, thermocouple; 8, bellows.
PLASMA HEATING IN FURNACES |
31 |
The measuring element was filled with mercury or cesium. The working volume was essentially a cylinder with a height of 0.5–2 mm and diameter of 3–5 mm defined by the insulator, the lower end of the top electrode and the bottom of the outer tungsten ampoule serving the function of the second electrode 6. The thermal e.m.f. being measured occurs owing to the temperature gradient developed along the cell.
Let us now turn to the discussion of the results of measurements of electrical conductivity and thermal e.m.f. The electrophysical properties of cesium appear to be the most studied at present. Shown in Fig. 2.5 is a region in which the electrical conductivity and thermoelectromotive force of cesium were studied using both static and dynamic methods by Alekseev (1968), Barolskii et al. (1972), and Borzhievsky et al. (1987).
The pioneering study of cesium was performed by Alekseev (1968). It was shown that the electrical conductivity in the region of high temperatures on the isobars had dropped upon heating by up to four orders of magnitude.
Figure 2.6 gives the results of more recent measurements of the electrical conductivity of rubidium (Franz et al. 1981), which demonstrate clearly how the conductivity decreases upon heating and transition to the nonideal plasma state. Analogous data are cited by Pfeifer et al. (1979) and Freyland and Hensel (1972) for rubidium and potassium. These values are characterized by an error of 3–4% in liquid and 50–60% in the transition region.
MPa |
. |
Two-phase |
region |
cm g
g
Experimentally studied regions of p − V diagram of cesium. Static experiments: 1, phase coexistence curve (Renkert et al. 1971); 2, measurements of σ (Alekseev 1968; Alekseev et al. 1975; Renkert et al. 1969, 1971; Kulik et al. 1984) and measurements of S
(Alekseev et al. 1970b, 1975; Pfeifer et al. 1973); dynamic measurements of σ: 3, adiabatic tube (Isakov and Lomakin 1979); 4, 5, shock tube (Sechenov et al. 1977); 6, ohmic heating in an inert atmosphere (Dikhter and Zeigarnik 1977).
32 ELECTRICAL METHODS OF NONIDEAL PLASMA GENERATION
ohm cm |
. MPa
Fig. 2.6. The electrical conductivity of rubidium in the “metal–dielectric” transition region (Franz et al. 1981): 1, T = 300 K; 2, 500 K; 3, 900 K; 4, 1200 K; 5, 1400 K; 6, 1500 K; 7, 1550 K; 8, 1600 K; 9, 1650 K; 10, 1700 K; 11, 1750 K; 12, 1815 K; 13, 1830 K.
Let us now turn to the data on the thermoelectromotive force. The absolute magnitude of the thermal e.m.f. of cesium had grown rapidly with temperature in the region of the transition from the metal to plasma state (Fig. 2.7). One can see that the solid and broken curves, while featuring the same behavior of the variation of thermal e.m.f. with temperature, diverge somewhat in the “metal–nonideal plasma” transition zone.
Consider in more detail the results of measuring the electrical conductivity of
µV K-1
MPa
.
Fig. 2.7. Experimental values of the thermal e.m.f. of cesium: broken line, Alekseev et al.
1975; solid lines, Pfeifer et al. (1973).
PLASMA HEATING IN FURNACES |
33 |
ohm |
cm |
. MPa
Fig. 2.8. Isotherms of cesium electric conductivity (solid) and electric conductivity on phase
coexistence curve (dashed) (Renkert et al. 1971).
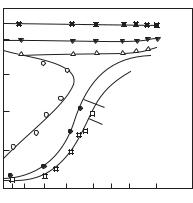
cesium in a nonideal plasma of metal vapors. The results obtained in this region are far from being numerous. Here, however, qualitative results were also obtained which had proved to be of importance in selecting the theoretical models of a nonideal plasma. Figure 2.8 gives the isotherms of the electrical conductivity of cesium, as well as the electrical conductivity of cesium on the phase coexistence curve (Renkert et al. 1971). Figure 2.9 represents a chart combining the results obtained in di erent laboratories (Alekseev et al. 1975; Renkert et al. 1971; Lomakin and Lopatin 1983) for the 2 MPa isobar and for saturated vapors.
Attention is drawn to the anomalously high level of the electrical conductivity of saturated vapor. It exceeds by orders of magnitude the level of standard estimates for an ideal plasma. Further, on isobaric heating, the electrical conductivity starting from these high values does not rise but, on the contrary, drops sharply. It decreases on the 2 MPa isobar to the minimum value of about 2 ·10−2 ohm−1cm−1 and, on further heating, starts increasing in the usual manner as in a weakly nonideal plasma.
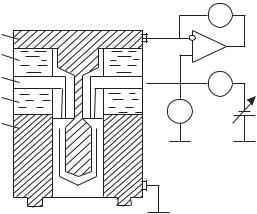
The region of weakly nonideal cesium plasma corresponds to low pressures of p 0.1 MPa at which the measurements are performed in vacuum chambers 1 (Fig. 2.10) accommodating heaters 2. Inserted in the heaters are two insulated electrodes 3 with applied potential used to measure the current–voltage characteristics. From the latter, the resistance of the plasma gap between the electrodes is determined. In order to weaken the end e ects, an insulated protective ring 4 is set on one of the electrodes.
The plasma of desired pressure is provided with the aid of a cesium delivery system 5. For this purpose, a furnace 6 maintains a preset temperature of the liquid cesium surface. An optical pyrometer or thermocouple was used to determine the plasma temperature.
34 ELECTRICAL METHODS OF NONIDEAL PLASMA GENERATION
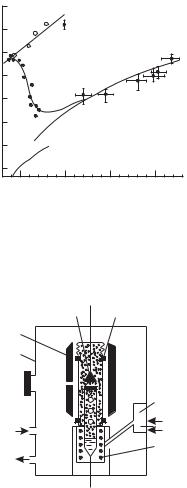
Figure 2.11 shows the results of measuring the electrical conductivity of cesium at low pressures. These values of electrical conductivity are characterized by an error of from 10 to 25%. At p 0.1 MPa, the plasma of cesium vapors is already nonideal. Therefore, the electrical conductivity increases as the pressure decreases, as in the case of an ideal plasma.
Mercury, like cesium, has a low critical temperature. Therefore mercury was
ohm |
cm |
Fig. 2.9. The electrical conductivity of nonideal plasma of cesium vapors. Measurement results: saturated vapor, ◦ (Renkert et al. 1971); on the 2 MPa isobar, • (Alekseev et al. 1975), (Renkert et al. 1971), + (Lomakin and Lopatin 1983). Calculated results: 1, saturated vapor by ideal gas approach; 2, isobar 2 MPa with account for molecular ions (Gogoleva et al. 1984).
Schematic of the facility for generation and studies of a low–pressure cesium plasma (p 0.1 MPa) in the high–temperature region (Ermokhin et al. 1971): 1, vacuum chamber body; 2, heaters; 3, electrodes; 4, protective ring; 5, cesium delivery system; 6, liquid cesium heating furnace.
PLASMA HEATING IN FURNACES |
35 |
 ohm cm
Fig. 2.11. The electrical conductivity of cesium at low pressures. Measurements: 1, 0.1 MPa; 2, 10−2 MPa; 3, 10−3 MPa (Ermokhin et al. 1971); 4, 0.66 · 10−2 MPa (Rochling 1963). Calculations: 5, 0.1 MPa; 6, 10−2 MPa; 7, 10−3 MPa ; 8, 0.66 ·10−2 MPa (Gogoleva et al. 1984).
the first substance whose properties were investigated in the “metal–nonmetal” transition region by Kikoin et al. (1966) and Hensel and Franck (1968). Isochores of electrical conductivity of dense mercury vapors are given in Fig. 2.12. For this purpose, the density was determined by extrapolating the experimental p −ρ −T data obtained at higher densities. It is seen from Fig. 2.12 that the electrical conductivity of mercury plasma at constant density grows with temperature if ρ ρc. The temperature dependence of electrical conductivity in this region exhibits a semiconductor behavior, σ exp(−∆E/T ). As the density increases, the slope of the curves decreases indicating that the “energy gap” ∆E decreases.
Figure 2.13 shows the temperature coe cient of conductivity of mercury as a function of density, ∆E = −2dlnσ/dβ, where β = 1/kT . The energy gap
∆E is closed at ρ ρ . An interesting, though still not properly understood, = c
peculiarity in the ∆E(ρ) dependence was observed by Kikoin and Senchenkov (1967) at ρ > ρc. In the liquid state region, the gap opens on further compression and finally closes again only at ρ 9 g cm−3. Kikoin and Senchenkov concluded that mercury had metallized only at 9 g cm−3.
The great uncertainty in this region is demonstrated by the data on the thermal e.m.f. of mercury. There is no doubt, however, that an interesting phenomenon of a sharp variation of thermal e.m.f. near the critical point has been observed in four laboratories by Alekseev et al. (1972, 1976), Dukers and Ross (1972), Tsuji et al. (1977), and Neale and Cusack (1979), which so far has no theoretical interpretation.