

METALLIZATION OF DIELECTRICS |
353 |
P,GPa |
|
|
|
300 |
|
|
|
200 |
8 |
|
|
6 |
7 |
|
|
100 |
11 |
|
12 |
80 |
|
|
|
|
|
|
|
60 |
|
|
10 |
50 |
|
|
|
40 |
|
|
Experiment |
30 |
|
|
|
|
|
- 1 |
|
|
|
9 |
- 2 |
20 |
|
- 3 |
|
|
|
||
|
|
|
- 4 |
6 |
|
|
- 5 |
|
|
|
|
10 |
0.8 |
1.0 |
1.2 |
0.6 |
|||
|
|
ρ, g cm-3 |
|
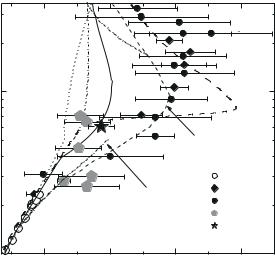
Fig. 9.12. Shock adiabat of deuterium. Experimental data: 1, Knudson et al. (2001); 2, Pavlovskii et al. (1987), 3, Da Silva et al. (1997); 4, Mostovych et al. (2000), 5, Grigor’ev et al. (1978). Calculated curves: 6, Kerley (1972), 7, Pierleoni et al. (1974), 8, Ebeling et al. (1991), 9, Beule et al. (1999), 10, Ross (1998), 11 and 12, Fortov et al. (2003).
9.3.2Inert gases
The phase diagram of xenon is shown in Fig. 9.13. In experiments where the electrical conductivity of xenon was measured under the conditions of multiple shock compression, densities up to 9.5 g cm−3, pressures up to 120 GPa, and temperatures up to (5–20)·103 K were achieved. The electron number density was as high as 3·1022 cm−3, with the ionization fraction being less than or equal to 0.5. In the region of maximum parameter values, the plasma was degenerate (neλ3e 50) and strongly nonideal, both for the Coulomb (γ 10) and interatomic (γa 1) interactions.
In Fig. 9.13, the phase boundaries of xenon states are depicted according to Ebeling et al. (1991). Metallization of xenon under the conditions of static compression in diamond anvils was experimentally observed by Goettel et al. (1989), Eremets et al. (2000), and Reichlin et al. (1989) at densities of about 12.3 g cm−3 and pressures in the range 130–150 GPa, which is in agreement with earlier calculations of Ross and McMahan (1980). In accordance with estimates of Ebeling et al. (1991), the phase boundary for the metal–dielectric transition intersects the xenon melting line at the triple point (Tp2) with p 50 GPa T 6000 K and terminates at the critical point C2 with p 10 GPa T
354 |
METALLIZATION OF NONIDEAL PLASMAS |
|
103 |
|
|
|
|
|
2 |
Metal |
|
ne λ3e =1 |
|
|
10 |
Dielectric |
|
|
|
|
|
|
Dence |
Γ =1 |
|
|
|
|
|
||
|
10 |
Melting |
Liquid |
plasma |
D |
|
C2 |
|
|||
|
|
|
|||
|
1 |
curve |
|
|
|
|
|
|
|
|
|
GPa |
10-1 |
|
|
|
|
P, |
|
|
|
|
|
|
10-2 |
|
Experiment: |
|
|
|
|
Gas |
|
|
|
|
10-3 |
- 1 |
|
|
|
|
|
|
|
||
|
|
- 2 |
Ideal |
|
|
|
|
=const |
- 3 |
|
|
|
10-4 |
- 4 |
plasma |
||
|
- 5 |
|
|
||
|
|
S |
- 6 |
|
|
|
|
|
|
|
|
|
10-5 |
|
- 7 |
|
|
|
102 |
103 |
104 |
105 |
|
|
|
||||
|
|
|
T, K |
|
|
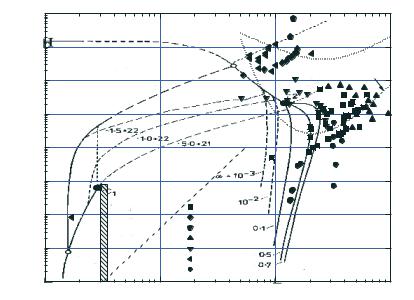
Fig. 9.13. Phase diagram of xenon. Measured equation of state: 1, shock compression of gas (Gryaznov et al. 1980), 2, shock compression of liquid (Keeler et al. 1965; Nellis et al.
1982; Urlin et al. 1992), 3, quasistatic compression (Urlin et al. 1992). Measured electric conductivity: 4, Mintsev et al. (1980); 5, Ivanov et al. (1976), Mintsev and Fortov (1979); 6, Mintsev et al. (2000). Measured optical properties: 7, Kulish et al. (1995).
10 000 K in the plasma region. At high temperatures, the phase transition is accompanied by a sharp change in the concentration of free electrons in a narrow range of plasma densities, which is shown in Fig. 9.13 by the curves of constant ionization fraction. Extensive experimental data from shock wave experiments, where the equation of state (Keeler et al. 1965; Gryaznov et al. 1980; Urlin et al. 1992; Fortov et al. 2001), optical properties (Radousky and Ross 1988; Urlin et al. 1992; Kulish et al. 1995), and electrical conductivity (Ivanov et al. 1976, Mintsev and Fortov 1979; Mintsev et al. 1980; Urlin et al. 1992; Mintsev et al. 2000) of the xenon plasma were measured, show no indications of any unusual feature in this parameter range. A sharp increase of the electrical conductivity observed in experiments by Mintsev et al. (2000) occurred at somewhat higher densities 8–10 g cm−3, and pressures 100 GPa. Note that, upon a formal interpolation of the melting curve to the parameter region of interest, some of the experimental points fall into the solid phase part.
Validity of the thermodynamic model of Fortov et al. (2003) was tested by comparing the results with experimental data obtained from the shock compression of liquid xenon in light–gas guns (Keeler et al. 1965; Nellis et al. 1982;
METALLIZATION OF DIELECTRICS |
355 |
|
140 |
|
|
- 1 |
|
|
|
|
|
|
|
|
|
- 2 |
|
|
|
6 |
|
|
120 |
|
|
- 3 |
|
|
|
|
|
|
|
|
- 4 |
|
|
|
|
|
|
|
|
|
|
- 5 |
|
|
|
7 |
|
|
|
|
|
- 6 |
|
|
|
|
|
|
100 |
|
|
|
|
|
|
|
|
|
|
|
- 7 |
|
|
|
|
|
|
|
|
|
|
|
P = 86.8 GPa |
|
|
|
|
GPa |
80 |
|
|
|
T = 29 100 K |
|
|
|
|
|
|
|
Γ = 11.9 |
|
|
|
|
||
60 |
|
|
|
ne λe3= 2.19 |
|
|
|
|
|
P, |
|
|
|
ne = 2.63 1022 |
|
|
|
||
|
40 |
|
|
|
|
|
|
T = 0 K |
|
|
ρ |
0 |
= 2.96 g cm-3 |
|
|
|
|
||
|
20 |
|
|
|
|
|
|
|
|
|
|
|
|
|
|
|
|
|
|
|
0 |
4 |
5 |
6 |
7 |
8 |
9 |
10 |
|
|
|
||||||||
|
|
|
|
|
ρ, g cm-3 |
|
|
|
|
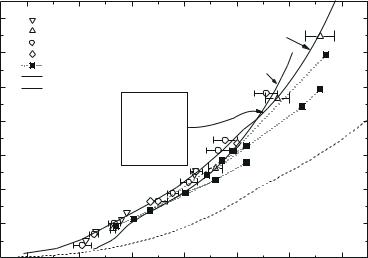
Fig. 9.14. Shock adiabat for xenon. Experimental data: 1, Keeler et al. (1965); 2, Nellis et al. (1982); 3, Urlin et al. (1992); 4, Radousky and Ross (1988); 5, Mintsev et al. (2000). Calculated curves: 6, Urlin et al. (1992), 7, Fortov et al. (2003), dashed line represents the “cold curve”.
Radousky and Ross 1988) and explosive experiments (Urlin et al. 1992). Figure 9.14 shows this along with the results of experiments by Mintsev et al. (2000) on multiple shock compression. In general, results of the Fortov et al. model are in satisfactory agreement with experiments. The discrepancy seen at low temperatures and pressures can be attributed to an insu ciently accurate approximation of xenon states in the liquid phase.
The Fortov et al. (2003) model provides a fairly good description of the shock adiabats also for liquid argon and krypton (see Figs. 9.15 and 9.16, where the experimental data are borrowed from Glukhodedov et al. 1999 and Grigor’ev et al. 1985). It is noteworthy that good agreement could also be reached for the measured values of the brightness temperature and the speed of sound in these substances.
The situation with the thermodynamic description of helium turns out to be more complicated, since much fewer experimental data are available and because the helium phase diagram is quite unusual (see Fig. 9.17) (Ebeling et al. 1991). Metallization of helium at low temperatures is expected to occur at extremely high pressures of 1.1 TPa. However, plasma phase transitions associated with a sharp change in the ionization composition must take place at much lower pressures. Indeed, the estimates performed by Ebeling et al. (1991) suggest that
356 |
METALLIZATION OF NONIDEAL PLASMAS |
70 |
P = 54.6 GPa |
|
|||
|
|
||||
60 |
T = 17 900K |
|
|||
Γ = 8.8 |
|
|
|||
|
n |
λ3 |
= 0.66 |
|
|
|
e |
e |
. |
21 |
|
|
n |
|
|
||
50 |
= 3.78 10 |
|
|
||
e |
|
|
|
|
|
|
|
|
|
|
|
ρ =1.398g cm-3 |
|
|
|
|
|
0 |
|
|
|
|
|
40 |
|
|
|
|
|
P,GPa |
|
|
|
|
- 1 |
30 |
|
|
|
|
|
|
|
|
|
|
- 2 |
20 |
|
|
|
|
|
10 |
|
|
|
T =0 K |
|
0 |
2 |
|
3 |
4 |
5 |
1 |
|
||||
|
|
ρ, g cm-3 |
|
||
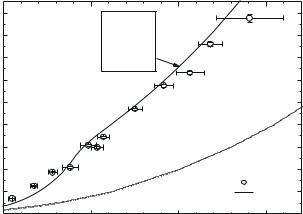
Fig. 9.15. Shock adiabat for argon. Experimental data: 1, Grigor’ev et al. (1985). Calcu-
lated curves: 2, Fortov et al. (2003); dashed line represents the “cold curve”.
the melting of solid helium due to the temperature increase will be accompanied by the direct transition into a singly ionized plasma state (triple point Tp3) followed by the transition into the double ionized state (triple point Tp4).
The curves of the plasma phase transition terminate at the critical points C1 and C2, yet the parameters of the first point (p 660 GPa and T 35 000 K) lie very close to the experimentally accessible region. In Fig. 9.17 the bullets and closed boxes represent the parameters of helium in the incident and reflected shock, respectively (Nellis et al. 1984). The shaded region corresponds to helium states obtained by Ternovoi et al. (2002) in the multiple shock experiments. It should be emphasized that the thermodynamic model of Fortov et al. (2003) satisfactorily describes the data on the shock compression in the incident and reflected waves (Nellis et al. 1984).
9.3.3Oxygen
The number of dielectric materials which exhibit the transition to a state with high “metallic” conductivity at extremely high densities increases every year. Metallic conductivity and even superconductivity were detected by Desgreniers et al. (1990) and Shimizu et al. (1998) in solid molecular oxygen at very low temperatures and pressures about 100 GPa. Recently, Bastea et al. 2001 performed experiments with shock reverberation in light–gas guns and found a metallic phase in the liquid molecular oxygen. Multiple shock compression provided a
METALLIZATION OF DIELECTRICS |
357 |
|
90 |
|
|
P = 65.8 GPa |
|
|
|
80 |
|
|
T = 20 100K |
|
|
|
|
|
Γ = 8.06 |
|
|
|
|
70 |
|
|
ne λ3e= 0.66 |
21 |
|
|
|
|
ne = 4.53·10 |
|
||
|
|
|
|
|
|
|
|
60 |
ρ |
= 2.41g cm-3 |
|
|
|
GPa |
|
0 |
|
|
|
|
50 |
|
|
|
|
|
|
P, |
40 |
|
|
|
|
|
|
|
|
|
|
|
|
|
30 |
|
|
|
|
T= 0 K |
|
? |
|
|
|
|
|
|
20 |
|
|
|
|
- 1 |
|
|
|
|
|
|
|
|
10 |
|
|
|
|
- 2 |
|
0 |
|
5 |
|
6 |
7 |
|
4 |
|
|
|||
|
|
|
|
ρ, g cm-3 |
|
|
Fig. 9.16. Shock adiabat for krypton. Experimental data: 1, Glukhodedov et al. (1999).
Calculated curves: 2, Fortov et al. (2003), dashed line represents the “cold curve”.
density increase by a factor of four, the pressure reached a value of 190 GPa, whereas the temperature did not exceed 7000 K. One can distinguish two main regimes for the pressure (or temperature) dependence of the electrical resistivity shown in Fig. 9.18. At pressures between 30 and 100 GPa there is a rapid drop of the resistivity by six orders of magnitude. Between 100 and 200 GPa the resistivity shows little sensitivity to pressure variations. Similar to the case of hydrogen, the temperature dependence of conductivity can be approximated by Eq. (9.2) with σ0 = 1205 ohm−1cm−1. By employing the Regel–Io e limit (9.1) for σ0, one can estimate the magnitude of the electron density in the region of saturated conductivity. This estimate yields the e ective number of conductive electrons per molecule of 0.1, whereas for good metals (e.g., Cu) this is 0.5.
The di erence observed in the conductivity after single and multiple shock compression (see Fig. 9.18) is mostly related to the corresponding di erence in the temperature. For a single compression, the states along the Hugoniot shock correspond to much higher temperatures. This causes dissociation of the molecules and, hence, provides an additional contribution to the conductivity due to the atomic compound. The estimates performed by Bastea et al. (2001) yield for p = 40 GPa and T = 1200 K after multiple shock compression, the dissociation fraction below 10−4%, whereas at the Hugoniot adiabat at the same pressure and temperature T = 6500 K estimates give the dissociation fraction of about 7%.