

128 |
WEAKLY IONIZED PLASMAS |
of correct inclusion of the electron/ion interaction, by similar divergence in a
continuous spectrum (Vedenov and Larkin 1959; Vorob’ev 2000). Rather than
∞
calculating gk exp(−βEk ), one should consider the quantity
k=1
ξiξe |
m |
3/2 |
gke−βEk − dr 1 + |
r |
+ 2 |
r |
2 |
. |
|
2π 2β |
|
|
βe2 |
1 |
βe2 |
|
|
|
|
|
|
|
|
One can see that energy.
The problem of eliminating the divergence has been long discussed in the literature. A rigorous result was derived by Vedenov and Larkin (1959). A correct description of the solution of this problem can be found in (Vorob’ev 2000; Larkin 1960; Kraeft et al. 1985). Expression (4.7) is valid, provided the second virial approximation is su cient. Under these conditions, the values of temperature exceed considerably the characteristic values of the interaction energy. Otherwise, no such correct solution is available at present.
The second virial coe cient of the plasma is calculated in a number of studies (see Vorob’ev 2000; Larkin 1960; Kraeft et al. 1985 and references therein). In addition to the main components discussed above, this coe cient includes high– order density terms such as n2 ln n (this term vanishes in a symmetrical plasma),
n2, n5/2 ln n, n5/2.
Quantum corrections appear in a term that is quadratic with respect to density. They are proportional to λ/rD and hence are minor, because λ/rD γ3/2(βRy)−1/2.
4.2Anomalous properties of a metal plasma
When the degree of ionization is low, the nonideality of the plasma may only lead to small corrections to the thermodynamic properties of the material. However, its e ect on the free electron concentration may be very strong. The electrical conductivity, for instance, varies by orders of magnitude as a result of variation of the number of carriers rather than of their mobility. Below we discuss the basic theoretical principles, detailed description can be found in Alekseev and Iakubov (1983); and Alekseev et al. (1981).
ANOMALOUS PROPERTIES OF A METAL PLASMA |
129 |
σ, ohm−1cm−1 |
|
|
|
|
|
|
|
104 |
|
|
|
|
|
|
|
103 |
|
|
|
p=100 MPa |
|
|
|
|
A |
|
|
|
|
|
|
102 |
|
|
|
|
|
|
|
|
|
15 |
|
|
|
|
|
101 |
|
|
|
|
|
|
|
|
|
|
|
|
|
|
|
1 |
|
|
|
|
|
|
|
10−1 |
2 |
|
0.01 |
|
|
|
|
|
|
|
|
|
|
||
10−2 |
|
|
|
|
|
|
|
10−3 |
|
0.1 |
|
|
|
|
|
10−4 |
1 |
2 |
3 |
4 |
|
3 |
|
|
T, 10 |
K |
|||||
|
|
|
|
|
|
||
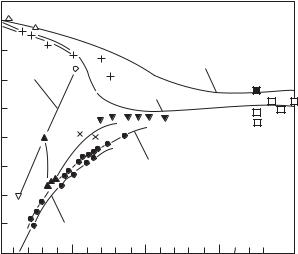
Electrical conductivity of cesium. Measurements on isobars: • — p = 0.01 and 0.1 MPa (Ermokhin et al. 1971); — p = 2 MPa (Alekseev et al. 1975); × — p = 2 MPa (Renkert et al. 1971); — p = 2 MPa (Isakov and Lomakin 1979); + — p = 15 MPa (Iermokhin et al. 1978); — p = 15 MPa (Sechenov et al. 1977); ∆ — p = 100 MPa (Borzhievsky et al. 1987); — p = 100 MPa (Iermokhin et al. 1978);
— p = 0.5 MPa (Borzhievsky et al. 1987). Solid lines are plotted over the measured
points, dashed lines are guides to the eye. A — conductivity on the phase coexistence
curve (Renkert et al. 1971); ◦ — vicinity of the critical point (Freyland 1979).
4.2.1Physical properties of metal plasma
Fig. 4.1 plots the electrical conductivity of cesium versus temperature in the entire range of pressures and temperatures, and Fig. 4.2 shows the data on thermal e.m.f. Let us now discuss the salient features.
A plasma may be considered ideal at low pressures, for instance, at p = 0.01 MPa pc. Therefore, at low temperatures the electrical conductivity grows with temperature because the electron concentration rises in accordance with Saha’s equation, ne exp[−I/(2kT )]. At high temperatures, the degree of ionization increases and collisions with ions begin to prevail over those with atoms. In this case, the conductivity is defined by Spitzer’s formula and has the power dependence on temperature, σ T 3/2/ ln Λ, where ln Λ is the “Coulomb” loga-
130 |
WEAKLY IONIZED PLASMAS |
|
||
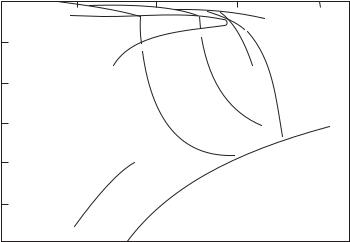
0.5 |
0.1 |
1.5 |
2.0 |
T, 103 K |
0
p = 20 MPa
1
13 MPa
-0.5
12 MPa
6 MPa
2 MPa
-1.0
2
3
S, mV K-1
Fig. 4.2. Isobars of the thermal e.m.f. of cesium: p = 2 and 6 MPa (Iakubov and Likal’ter 1987); p = 12 MPa (Alekseev et al. 1975); p = 13 and 20 MPa (Pfeifer et al. 1973): 1 — thermal e.m.f. on the phase coexistence curve; 2 and 3 — limiting relations (6.37) and (6.38), respectively.
rithm.
We can say that the p = 0.1 MPa isobar separates the regions of ideal and nonideal cesium plasma. At lower pressures, the electrical conductivity grows with decreasing pressure, (dσ/dp)T < 0. At p > 0.1 MPa, in contrast, σ increases with pressure, (dσ/dp)T > 0. At pressures above the critical, the electrical conductivity varies monotonically with temperature. Upon transition from a liquid metal to a plasma, the electrical conductivity decreases upon heating. Especially sharp is decrease of σ in the T Tc region at pressures comparable with pc, for example, p = 15 MPa. The metal–nonmetal transition occurs which results in the emergence of a nonideal plasma. Its electrical conductivity upon heating passes through a minimum. Further heating leads to an increase of the ionization fraction and the conductivity tends to the Spitzer dependence.
At high temperatures, all isobars sooner or later approach the Spitzer dependence σSp(T ) (see Chapter 6), because the nonideality decreases under conditions of strong heating. The σSp values depend on p very weakly (via the Coulomb logarithm).
The most interesting is the dependence σ(T ) at p < pc, for instance, at p = 2 MPa. This isobar has common features both with subcritical (p pc) and supercritical isobars. On the saturated vapor curve, the conductivity reaches anomalously high values (Fig. 2.9) which are five to six orders of magnitude higher than the results of conventional ideal–gas estimates. However, a slight
ANOMALOUS PROPERTIES OF A METAL PLASMA |
131 |
|||||||||
σ, ohm-1 cm-1 |
|
|
|
|
|
|
||||
104 |
|
|
|
|
Hg |
|
Rb |
|
||
|
|
|
|
|
|
|||||
|
|
|
|
|
|
|||||
|
|
|
|
|
|
|
|
Cs |
|
|
103 |
|
|
|
|
|
|
|
|
|
|
|
|
|
|
|
|
|
|
|
|
|
102 |
|
|
|
|
|
|
|
|
|
|
|
|
|
|
|
|
|
|
|
|
|
|
|
|
|
|
|
|
|
|
|
|
|
|
|
|
|
|
|
|
|
|
|
0 1 2 |
3 |
4 ρ/ρc |
|
|||||||
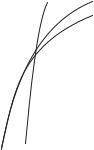
Fig. 4.3. Isotherms of the electrical conductivity of cesium, rubidium, and mercury,
T = 1.025 Tc (Hensel 1976; Hensel and Warren 1999).
temperature increase leads to a sharp drop in conductivity. Upon heating, the electrical conductivity on the isobar passes through a minimum at some value of temperature, and then starts growing and tends to Spitzer values.
Let us now turn to the discussion of the thermal e.m.f. of cesium, S, as shown in Fig. 4.2. In ideal weakly ionized plasmas the thermal e.m.f. has very weak dependence on p and is close to S = −I/(2eT ), i.e., it increases monotonically upon heating. At high temperatures, all S isobars should approach this dependence because the plasma becomes ideal.
Starting from the values typical for liquid metals, isobars of thermal e.m.f. fall o sharply with heating (Fig. 4.2). In the nonideal plasma region, upon heating the thermal e.m.f. passes through a minimum and tends to a [−I/(2eT )] dependence.
Therefore, the experimental results obtained for the electrical conductivity and thermal e.m.f. of nonideal cesium plasma do not fit the ideal–gas approximation limits (conventional for plasma physics). Equally inapplicable is the “almost free” electron approximation, which is successfully used in the theory of the liquid metal state.
4.2.2Lowering of the ionization potential
The electrical conductivity on the supercritical isobars decreases by orders of magnitude with a small temperature increase. Under these conditions, one can speak about an exponential density dependence of the electrical conductivity (Fig. 4.3). This was interpreted by Vedenov (1968), and Alekseev and Vedenov (1970) as a result of the electron concentration growth due to a decrease of the ionization potential.
The lowering of the ionization potential, ∆I, is the sum of two quantities, ∆I = ∆I1 + ∆I2. First of all, the free electron energy decreases, due to