

4. The marriage of supply and demand (market equilibrium)
Equilibrium prevails преобладает when economic forces balance so that economic variables перемены neither increase nor decrease.
Market equilibrium is attained достигается when the price of a good adjusts приводить в порядок so that the quantity buyers will buy at that price is equal to the quantity sellers will supply (fig. 3.7)
When market equilibrium is attained, forces of supply and demand balance so that there's no tendency for the market price or quantity to change over a given period.
The equilibrium price acts to ration the good so that everyone who will buy the good will find it available. Similarly, at the equilibrium everyone who wants to sell the good will be able to do so successfully.
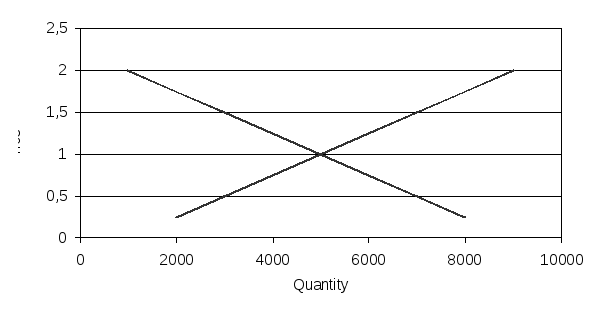
Figure 3.7. Market equilibrium
Equilibrium price and equilibrium quantity are the price and quantity of a good at the intersection пересечение of the supply and demand curves for the good.
The ability способность of the competitive forces of supply and demand to establish установить a price at which selling and buying decisions are consistent последовательный is called the rationing function of prices.
A surplus избыток (excess излишек supply) exists существует in a market when the quantity supplied of a good exceeds превышает the quantity demanded over a given period
(fig. 3.8).
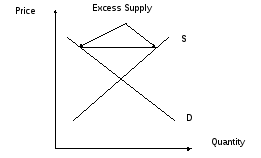
Figure 3.8. Excess supply (surplus)
A shortage недостаток (excess demand) exists in a market if the quantity demanded of a good exceeds the quantity supplied (fig. 3.9).
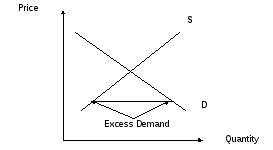
Figure 3.9. Excess demand (shortage)
This tendency for prices to rise when the quantity demanded exceeds the quantity supplied and for prices to fall when the quantity supplied exceeds the quantity demanded is a phenomenon which economists call the first dynamic law of supply and demand:
When quantity demanded is greater than quantity supplied, prices tend to rise;
When quantity supplied is greater than quantity demanded, prices tend to fall.
It’s called a dynamic law because dynamic refers to change and this law refers to how prices change, not to what prices will be.
Thus, the second dynamic law of supply and demand is:
In a market the larger the difference between quantity supplied and quantity demanded, the greater the pressure давление on prices to rise (if there is excess demand) or fall (if there is excess supply).
Where never quantity supplied and quantity demanded are unequal, price tends to change. If however, quantity supplied and quantity demanded are equal, price will stay the same because no one will have an incentive to change it. This observation leads to the third dynamic law of supply and demand:
When quantity supplied equals quantity demanded, prices have no tendency to change.
Rules Governing the Effects of Supply and Demand Shifts
1. An increase in demand which is more than an increase in supply will lead to an increase in quantity which is more than increase in price (fig. 3.10):
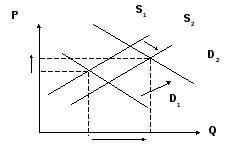
Figure 3.10. An increase in demand which is more than
an increase in supply
2. An increase in demand which is equal to an increase in supply will lead to an increase in quantity (fig. 3.11):
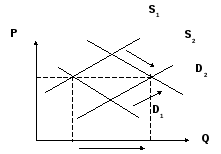
Figure 3.11. An increase in demand which is equal to
an increase in supply
3. An increase in demand which is less than an increase in supply will lead to an increase in quantity which is more than a decrease in price
(fig. 3.12):
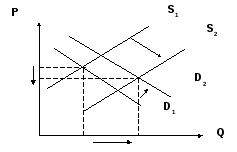
Figure 3.12. An increase in demand which is less than
an increase in supply
4. An increase in demand which is more than a decrease in supply will lead to an increase in quantity less than an increase in price (fig. 3.13):
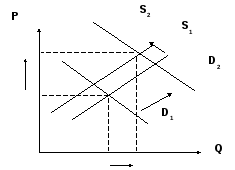
Figure 3.13. An increase in demand which is more than
a decrease in supply
5. An increase in demand which is equal to a decrease in supply will lead to an increase in price (fig. 3.14):
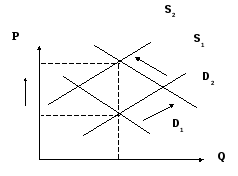
Figure 3.14. An increase in demand which is equal to
a decrease in supply
6. An increase in demand which is less than a decrease in supply will lead to a decrease in quantity less than an increase in price (fig. 3.15):
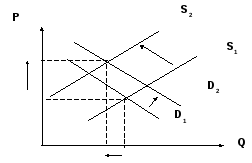
Figure 3.15. An increase in demand which is less than
a decrease in supply
7. An increase in demand with constant supply will lead to an increase in both equilibrium price and quantity (fig. 3.16):
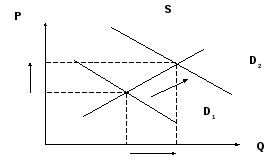
Figure 3.16. An increase in demand with constant supply
8. An increase in supply with constant demand will lead to a decrease in price and an increase in quantity (fig. 3.17):
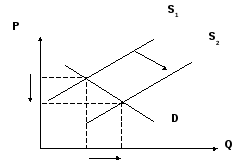
Figure 3.17. An increase in supply with constant demand
9. Constant supply with constant demand will lead to a constant price and quantity (fig. 3.18):
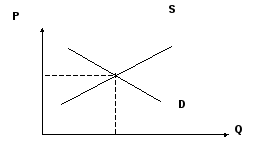
Figure 3.18. Constant supply with constant demand
10. A decrease in supply with constant demand will lead to an increase in price and decrease in quantity (fig. 3.19):
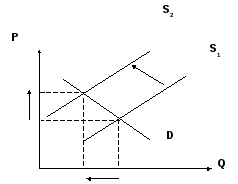
Figure 3.19. A decrease in supply with constant demand
11. A decrease in demand with constant supply will lead to a decrease in quantity and price (fig. 3.20):
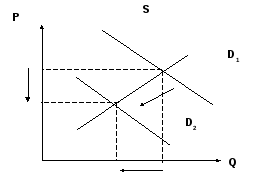
Figure 3.20. A decrease in demand with constant supply
12. A decrease in demand which is less than an increase in supply will lead to an increase in quantity which is less than a decrease in price
(fig. 3.21):
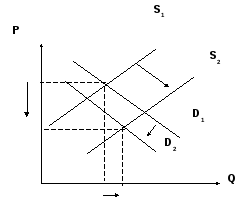
Figure 3.21. A decrease in demand which is less than
an increase in supply
13. A decrease in demand which is equal to an increase in supply will lead to a decrease in price (fig. 3.22):
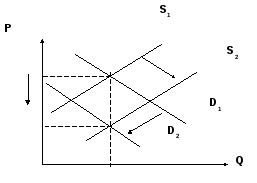
Figure 3.22. A decrease in demand which is equal to
an increase in supply
14. A decrease in demand which is more than an increase in supply will lead to a decrease in price which is more than a decrease in quantity
(fig. 3.23):
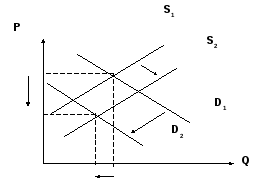
Figure 3.23. A decrease in demand which is more than
an increase in supply
15. A decrease in demand which is less than a decrease in supply will lead to a decrease in quantity which is more than an increase in price
(fig. 3.24):
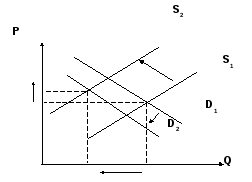
Figure 3.24. A decrease in demand which is less than
a decrease in supply
16. A decrease in demand which is equal to a decrease in supply will lead to a decrease in quantity (fig. 3.25):
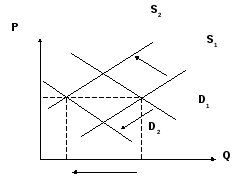
Figure 3.25. A decrease in demand which is equal to
a decrease in supply
17. A decrease in demand which is more than a decrease in supply will lead to a decrease in quantity which is more than a decrease in price
(fig. 3.26):
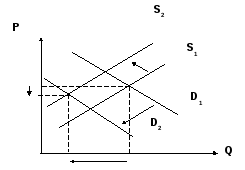
Figure 3.26. A decrease in demand which is more than
a decrease in supply
In Table 3.3 we gathered all possible cases of market changes.
Table 3.3
The possible cases of market changes
|
№ |
Demand |
Supply |
Quantity |
Price |
|
1 |
2 |
3 |
4 |
5 |
|
1 |
↑D |
↑D>↑S |
↑Q>↑P |
↑P |
|
2 |
↑D |
↑D≈↑S |
↑Q |
const |
|
3 |
↑D |
↑D<↑S |
↑Q>↓P |
↓P |
|
4 |
↑D |
↑D<↓S |
↑Q<↑P |
↑P |
|
5 |
↑D |
↑D≈↓S |
const |
↑P |
|
6 |
↑D |
↑D<↓S |
↓Q<↑P |
↑P |
|
7 |
↑D |
const |
↑Q |
↑P |
|
8 |
const |
↑S |
↑Q |
↓P |
|
9 |
const |
const |
const |
const |
|
10 |
const |
↓S |
↓Q |
↑P |
Table 3.3
|
1 |
2 |
3 |
4 |
5 |
|
11 |
↓D |
const |
↓Q |
↓P |
|
12 |
↓D |
↓D<↑S |
↑Q<↓P |
↓P |
|
13 |
↓D |
↓D≈↑S |
const |
↓P |
|
14 |
↓D |
↓D>↑S |
↓Q<↓P |
↓P |
|
15 |
↓D |
↓D<↓S |
↓Q<↑P |
↑P |
|
16 |
↓D |
↓D≈↓S |
↓Q |
const |
|
17 |
↓D |
↓D>↓S |
↓Q>↓P |
↓P |