

Table 7.1 Annual production possibilities for food and clothing
|
Type of good |
Production possibilities (alternatives) |
||||
|
Food per year (tons) |
55,000 |
50,000 |
40,000 |
25,000 |
0 |
|
Clothing per year (number of garments) |
0 |
10,000 |
20,000 |
30,000 |
40,000 |
At any point in time, an economy achieving full employment and productive efficiency must sacrifice some of one good to obtain more of another good. Scarce resources prohibit such an economy from having more of both goods.
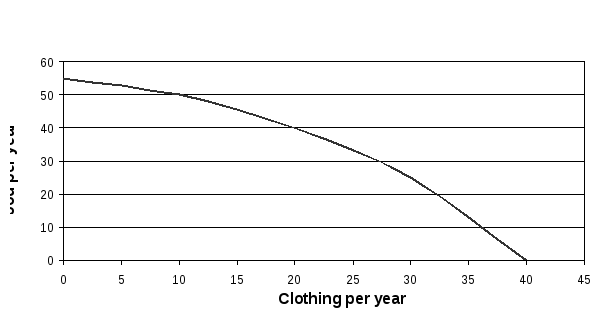
Figure 7.1. Production possibilities curve
3. Law of increasing opportunity cost
The law of increasing opportunity cost states that the opportunity cost of each additional unit output of a good over a period increases as more of that good is produced.
This law is an implication of the assumption that some economic resources are more suited than others to the production of particular goods.
Productive efficiency is attained when the maximum possible output of any one good is produced by given output of other goods.
4. Economic growth: expanding production possibilities
Three sources of economic growth
1. Increased quantities of economic resources.
2. Improved quality of economic resources.
3. Advances in technology.
Lecture 8: Macroeconomics: economic growth, business cycles, unemployment, and inflation
1. Economic growth and living standards.
2. Business cycles.
3. Unemployment.
4. Inflation.
5. Macroeconomic Policy.
Macroeconomics is the study of the performance of the national economy as well as the policies used to improve that performance.
1. Economic growth and living standards
Living standards – the degree to which people have access to goods and services that make their lives easier healthier, safer and more enjoyable.
Five of the most important causes of growth are the following:
1. Institutions with incentives compatible with growth.
2. Technological development.
3. Available resources.
4. Capital accumulation—investment in productive capacity.
5. Entrepreneurship.
Productivity
While growth in output per person is closely linked to changes in what the typical person can consume, macroeconomists are also interested in changes in what the average worker can produce.
Economists refer to output per employed worker as average labor productivity.
Average labor productivity, or output per employed worker, is a crucial determinant of living standards.
2. Business cycles
The business cycle is the term used to describe the fluctuations in aggregate production as measured by the ups and downs of real GNP (fig. 8.1). The fluctuations, although not subject to easy predictability or regularity, can be readily identified.
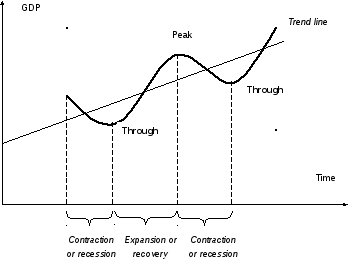
Figure 8.1. Business cycles phases
The business cycle is characterized by peaks and troughs and periods of contraction of expansion:
1. Peak. The peak is the highest level of real GNP in the cycle. Each peak (two are illustrated in the graph) indicates an economy operating at close to full capacity so that national product and national income correspond to a very high degree of utilization of labor, factories, and offices. During a peak of the cycle there are likely to be shortages of labor, parts, and materials in certain markets. On occasion the economy booms to such a degree that factories and offices are utilized around the clock with two or more shifts of labor.
A boom is a very high peak, representing a big jump in output. (That's when the economy is doing great. Most everyone who wants a job has one and everyone is happy.) Eventually an expansion peaks. (At least, in the past, they always have.)
A downturn describes the phenomenon of economic activity starting to fall from a peak. In a recession the economy isn't doing so great, many people are unemployed, and a number of people are depressed.
Contraction or recession. A contraction is a downturn from peak economic activity during which real GNP declines from its previous value. During a contraction, real GNP and therefore earnings also decline. Business profits also typically decline. As profitability falls, so does business demand for investment goods. A recession is a decline in real output.
A depression is a large recession. There is no formal line indicating when a recession becomes a depression. In general, a depression is much longer and more severe than a recession.
The bottom of a recession or depression is called the trough.
3. Trough. A trough is the lowest level of real GNP observed over the business cycle. A trough is reached when the economy begins pulling out of a period of contraction or recession. During this time, there is an excessive amount of unemployment and idle productive capacity. Businesses are more likely to fail because of low demand for their products.
Although a trough is the pits, it's also the point at which things start looking up. Once a trough is reached, things can't get much worse, and the economic health of the nation begins to take a turn for the better.
4. Expansion or recovery. An expansion is an upturn of economic activity between a trough and a peak during which real GNP increases. During an expansion, demand for goods and services increases and real GNP rises as firms expand production, hire more workers, and begin to purchase more investment goods. Employment opportunities increase during a period of expansion. The expansion in economic activity after a trough is called a recovery if it follows a period of contraction severe enough to be classified as a recession. During an expansion the economy moves toward a new peak where the cycle begins again.
Recovery is the term used to describe an expansion in economic activity after a through if the expansion follows a period of contraction severe enough to be classified as a recession.