

Figure 3.2. Changes in demand
Change in quantity demanded is movement from one point to another point on a fixed demand curve (fig. 3.3).
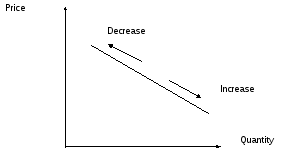
Figure 3.3. Changes in quantity demanded
3. Supply
The quantity supplied количество поставок is the quantity of the goods seller is willing and able to make available in the market over a given period at a certain price, other things being equal.
In this case the other things being held equal are all the previously listed supply influences other than the price of the good itself.
The concept of supply as used in economics is a relationship between the price of an item and the quantity supplied.
Like demand, supply is not a fixed quantity. Instead it signs how the quantity sellers will offer varies with price. The amount sellers bring to the market over any given period depends on the price of the product and the other supply influences.
The market supply curve and the law of supply
Table 3.2 provides hypothetical data for the price and quantity of eggs supplied in a local farmers' market each week. (Other supply influences are assumed not to change as price changes.)
The data comprise включать the supply schedule, which shows how quantity supplied is related to the price.
The law of supply states that, in general, other things being equal, the higher the price of a good, the greater the quantity of that good sellers are willing and able to make available over a given period.
Table 3.2 a supply schedule for a eggs
-
Price
(dollars per dozen)
Quantity supplied
(dozens per week)
2,00
9 000
1,75
8 000
1,50
7 000
1,25
6 000
1,00
5 000
0,75
4 000
0,50
3 000
0,25
2 000
The law of supply is an implication of a model based on the assumption предположение that sellers seek to maximize net pains старания from their activities. The law represents a hypothesis that is widely supported by empirical evidence.поддержано опытным путем
A supply curve is a graph of the data from a supply schedule that shows how quantity supplied varies with price.
Fig. 3.4 plots the weekly supply curve for eggs based on the data in the table. Price is plotted нанесена on the vertical axis, while quantity supplied corresponds соответствует to points on the horizontal axis.
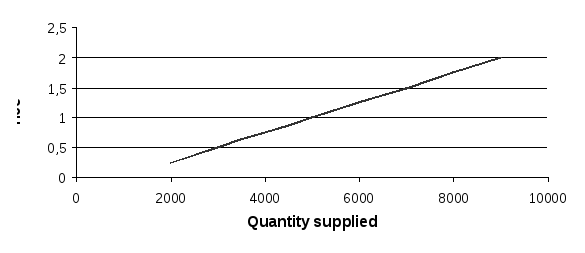
Figure 3.4. Supply curve
Change in supply is a change in the entire полный schedule and a shift сдвиг of the entire curve. An increase in supply to the right, a decrease уменьшать to the left (fig. 3.5).
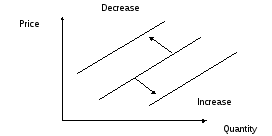
Figure 3.5. Change in supply
The cause of a change in supply is a change in one or more determinants of supply:
-
Current текущая prices of inputs needed to produce and market the good (resource prices).
-
Current technology available to produce and market the good.
-
Prices of other goods that can be produced with inputs used or owned by the seller.
-
Expectations ожидание about future prices.
-
The number of sellers serving the market.
-
Taxes and subsidies.
A change in quantity supplied is a movement from one point to another on a fixed supply curve (fig. 3.6).
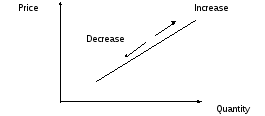
Figure 3.6. Change in quantity supplied