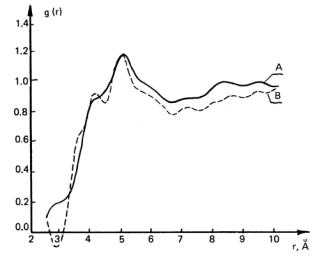
Correlation curves for liquid and crystalline PTMG are identical in the interval 1 – 3 Å, whereas at distances of more than 3 Å the curves for liquid oligomer have less pronounced maxima in comparison with the curve for the crystal.
Fig. 7. Experimental interatomic distance correlation curves for liquid
(A: Smax = 6.4 Å–1 and B: Smax = 8.7 Å–1) and crystalline (C: Smax = 8.9 Å–1) PTMG.
10.5. Results of conformational and modeling computations
Figure 8 shows the potential energy maps (PEM) for different pairs of chemical bonds in the fragment of the PTMG chain (fig. 2). It follows from the molecular symmetry that PEM for the pairs of angles τ2/τ3 and τ3/τ4 may be obtained from each
other by reflection across the diagonal plane. It is seen from Fig. 8a that there is possibility of realization of all probable trans (T) and gauche (G) conformers. However, the pairs G+G– and G–G+ are less probable. The most advantageous pairs of
τ2,τ3,τ4 .
conformers are: TG–, TG+ for angles τ3/τ4 , and G+T, GT– for angles τ2/τ3 .
The succession of conformers GTG is evidently most advantageous for the angles For the angle pairs τ1/τ2 and τ4/τ5 the PEM also may be transformed into
another by reflection across the diagonal planes. One of these maps is shown in Fig. 8b. It is seen that the successions of conformers G+G– and G–G+ for these bonds are practically forbidden. The most probable state for the bonds O–C–C is TG. For C–O–C bonds the successions of the conformers GT and TG are less probable and GG are impossible (Fig. 8c).
gtheor
|
Fig. 8. Potential energy maps for PTMG chain: |
|
maps (a), (b), and (c) correspond to (fig. 5) |
|
τ5/τ1,τ2/τ3, and τ4/τ5 |
dihedral angle pairs, respectively: |
( |
): 1 kcal/mol; ( |
):3 kcal/mol; ( |
):10 kcal/mol. |
For the bond pairs C–C–C the minima of the potential energy are narrow, with barriers which are equal to 3.5 kcal/mol. On the contrary, for bond pairs C–O–C the magnitude of the barriers between minima is half as large (1.7 kcal/mol), and the PEM may be described as a plate with a great hollow in the center, with gentle brims and with the four small hollows in these brims. It is seen from Fig. 8 that the lowest energy conformations for the bonds O–C–C–C–C–O are TGTGT or TTTTT (the energy of the first one is slightly lower). In accordance with the value of the minima, there is a certain probability of the realization of other successions of bond conformation, too, but all the same, the conformations TTTTT and TGTGT prevail.
For these conformations of the PTMG chain the theoretical curves of the correlation of the intramolecular interatomic distances (r) have been computed.
Values were taken in the range 0.05 – 0.5 Å to best coincide with the maxima profile for the theoretical and experimental curves. These curves for the chain containing 92 atoms are shown in Fig. 9.
Optimum values of βij for these curves are given in Table 2. It is seen that for
the interchain conformation-nondependent distances, the values are in good agreement with literature data for analogous compounds [63].
The comparison of model and experimental curves of the intramolecular distance correlation shows coincidence in the region of the first two maxima.
562
Fig. 9. Theoretical curves of the correlation of intramolecular interatomic distances: A and C – TTTTT conformation of PTMG chain;
B – TGTGT conformation of PTMG chain.
Table 2
The values of the amplitudes of the atomic displacement from the equilibrium positions βij for atomic pairs with different distances rij between atoms used in
calculation of the RDF of the PTMG chain, Å
Atomic pair |
rij |
βij |
First neighbors |
1.6 |
0.08 |
Second neighbors |
2.6 |
0.10 |
Third neighbors |
4.1 |
0.20 |
Forth, fifth, … neighbors |
4.1 |
0.50 |
At radial distances above 3 Å the theoretical curves are generally lower than experimental ones. Curves A and C (Fig. 9), which correspond to calculations for
563
conformation with Smax = 8.7 and Smax = 6.4 Å–1, are different. At the same time, curves A and B, calculated for various conformations with the same Smax , are different only
in the interval of radial distances 2.8 – 10 Å, i. e., in the region of conformationdependent distances.
The difference correlation curves for the interatomic distances are shown in Fig. 10. They are the result of substraction of model correlation curves for TTTTT and TDTDT conformation from experimental curves for crystalline PTMG.
Fig. 10. Difference correlation curves of the interatomic distances gexp (r) − gtheor (r) for crystalline PTMG:
A – subtraction of TTTTT chain conformation from the experimental curve; B – subtraction of TGTGT chain conformation from the experimental curve.
Figure 11 shows the difference curves for liquid PTMG. Comparing these difference curves with corresponding experimental and model curves for interatomic distances, one can note two important facts.
The first is the similarity of the curves for the same conformations with different Smax , which suggests the absence of spurious oscillations on the complete
experimental curves.
The second fact is the absence of slight maxima in the interval 3 – 10 Å for difference curves as compared with experimental and model ones.
10.6. Discussion
It is known that the high molecular weight analog of PTMG, polytetramethylene oxide (PTMO), crystallizes in space group C2/с, in a monoclinic lattice. The molecular chains of PTMO have the TTT conformation and are packed parallel to the (100) plane. The identity period along the c axis includes two monomers.
Fig. 11. Difference correlation curves of the interatomic distances gexp (r) − gtheor (r) for liquid PTMG:
A and B – subtraction of TTTTT chain conformation from the experimental curve; C – subtraction of TGTGT chain conformation from the experimental curve;
D – subtraction of chain conformation with equal numbers of TTTTT and TGTGT from the experimental curve.
The distance between the planes of the molecular chains is slightly less than the sum of the van der Waals radii of CH2 groups. The molecules are displaced along the c axis so that oxygen atoms are separated as much as possible. The most intense reflections of the difractograms of the crystalline PTMG (Fig. 6) typify the base planes of the crystalline lattice: the reflection 020 (d = 4.46 Å) is connected with the periodicity along the b axis and reflection 110 (d = 3.65 Å) is caused by the distances between the diagonal planes.
As is known, if compounds contain hydroxylic groups, molecular association takes place due to H-bond formation. It is possible that the terminal OH groups in PTMG also may lead to their formation. In this case, two modes of association are
565
probable – interaction between two terminal groups and participation in H-bonding of hydrogen atoms of one of the OH groups with an electron-donor oxygen of the main chain. Due to these two possibilities it is interesting to compare the structure peculiarity of PTMG with its high molecular weight analog.
Comparison of our diffraction curve of crystalline PTMG with literature data for PTMO shows that the presence of terminal OH groups in PTMG with a molecular weight of 1350 does not influence the molecular ordering in crystals. At the same time, the transition to liquid oligomers results in a slight difference in position of the main intensity maxima. The larger width and asymmetry of the main maxima for PTMG-500, as compared with other oligomers, may be explained by some increase in the structural defects due to an increase in H-bond concentration for shorter chains. Above molecular weight 1350 this effect is absent, thus enabling us to say that structures of PTMG-1350 and PTMG-2500 and their high molecular weight analogs in the liquid state are very similar.
The presence of only one symmetric diffuse maximum on the intensity curves of liquid oligomers, instead of the two observed crystalline reflections, shows that for PTMG in the melt, only one preferential distance is realized. Here the average value of interplanar distance in the base plane of the paracrystalline lattice in liquid PTMG is equal to 4.46 Å. From the theory of x-ray scattering for substances with paracrystalline ordering, it is known [36] that if there is only one maximum of intermolecular interference on the intensity curve, the fluctuation in periodicity is on the order of 17.5 – 35 %. Since on the intensity curve for the PTMG melt we observed only one maximum, we can use the fluctuation mentioned to suggest the packing of PTMG chain fragments as a paracrystalline lattice of hexagonal type with average interplanar distance 4.46 Å and fluctuations in the range 3.68 – 5.24 Å as a minimum and in the range 2.9 – 6.0 Å for maximum fluctuations. Assuming a perfect hexagonal lattice with interplanar distance 4.46 Å, the average value of distances between the adjacent macromolecular axes will be equal to 5.1 Å. The packing of nearest-neighbor molecular fragments in liquid PTVG cannot be represented as the result of crystalline lattice disordering. The data show that in the melt there is only one preferential distance between adjacent chains, whereas in the crystal there are two such distances.
As a first approximation, let us consider the base plane of the paracrystalline lattice of liquid PTMG as resulting from displacement of the 100 plane to a distance equal to 4.46 Å, with constant distance between 010 planes (Fig. 12).
The possibility of such changes follows from the temperature dependence of the lattice constant 0f PTMG; the coefficient of expansion along the a axis is at least an order of magnitude larger than that along the b axis. The model of chain

arrangements (Fig. 12) in the paracrystalline lattice is in good agreement with the interplanar distance found experimentally.
Fig. 12. Basis plane of crystalline PTMG and model basis plane of liquid PTMG.
It is worth noting that the average intermolecular distances in the model are in concordance with the position of the most intense maximum on the difference curves of interatomic distance correlation.
The variety and contradictions of the character of the models proposed by others for liquid (amorphous) polymers force us to consider the results of the structural investigations in the framework of the alternative models. At least three of them have been used with the most success for the explanation of the physical properties of amorphous polymers with flexible chains.
According to the statistical coil model, the macromolecules have unperturbed gaussian conformation; they do not “feel” their neighbors and do not change their conformations to achieve dense packing. Therefore this suggests no correlation of the mutual dispositions of the molecular fragments, this being in contradiction to the presence of the intense maximum of the intermolecular interference. As was noted, such maxima are caused by the existence of correlations between the positions of the molecular fragments in the framework of the distorted paracrystalline lattice.
The absence of correlation between the molecular fragments in the model of statistical coils results, in particular, in the ability to obtain a rather dense packing, with a conformer distribution which is nearly gaussian in spite of the use of montecarlo calculations. The intensity curve maxima calculated for this model have lower intensity and are more diffuse as compared with experimental curves [28].
In the framework of the statistical coil model it is difficult to explain the presence of intense maxima of intermolecular interference, the latter being typical for liquid PTMG. Thus, the statistical coil model in its present form does not conform to results of the structural experiments.
This deficiency in the model is absent in the two other models based on the supposition of local ordering of the molecular fragments. In the model of fringed-micellar grains formed by folded chains, a quasi-crystalline structure of ordered microdomains is postulated which exist together with disordered microregions. The “ordered” microdomains are distributed in the more irregular medium. It is evident that a qualitative distinction between ordered and disordered regions consists in the presence in liquid PTMG of some fragments of fully extended chains in TTTTT conformation and of some fragments formed by sequence of T and G conformers. In such a case, during melting of the oligomer the maximal change in
the specific |
volume |
for the ordered regions |
cannot exceed |
a |
value equal to |
(V1 −Vc ) /Vc , |
where V1 |
is the specific volume of |
the liquid, and |
Vc |
is the specific |
volume of the crystal. Since during melting the length of chains in the ordered domains and their conformational state do not change, the increase in specific volume may be connected with the increased cross-section area occupied by one molecular fragment.
In this case the value (S1 − Sc ) / Sc , where S1 and Sc are the cross-section areas of
one molecule in liquid and |
crystal, respectively, |
should not exceed the value |
(V1 −Vc ) /Vc . Our calculations |
show that the relative |
change in specific volume of |
PTMG during melting, obtained from measurements of microscopic density, is close to 0.131, while the change in area of the base plane passing from crystal to paracrystal equals 0.307. As is seen, the latter value is more than two times the increase in the specific volume calculated from density data.
Thus, if we accept, in accordance with the model of micellar grains, that the main maximum on the intensity curve for the liquid oligomer is connected with the periodicity of the ordered microdomains, this model does not agree with the experimental results.
As a third possibility, we consider the development of kink isomers during melting. If we used the concept that the structure of liquid/amorphous polymers is
based on an increase in the equilibrium concentration of kink isomers in the melt, as compared to the crystal, there is no need to use two-phase models.
The kink-isomer model was used for a detailed study of polyethylene [23, 24]. It is known that introduction of the kink GTG, so called 2g1 kink, into a polyethylene chain in the trans conformation leads to a shortening of its length by 1.26 Å and to an increase of the average size of the chain in the vicinity of the defect by 1.8 Å (in the plane parallel to the zigzag plane). It is suggested that for ordered regions with such defects, the ratio (V1 −Vc ) /Vc can be less than (S1 − Sc ) / Sc , because of the decrease in
extended chain length. Hence, the character of the change in density during melting does not put strict restrictions on the values of the intermolecular distances in the polymer melt. To apply this model to the description of the structure of liquid PTMG, let us consider the conformational properties of the chains. As follows from conformation analysis, they consist of the following:
1.PTMG chains may have fewer conformers than polyethylene chains. Specifically, for the succession of bonds C–C–C the conformations TT, TG, and GG can be realized, while the bonds C–O–C the conformation TT is most probable and the possibility of realization of conformations TG is much less.
2.In spite of this fact, the gentle character of the minima (Fig. 8c) withnesses to the shallowness of their slopes; i. e., large deviations from equilibrium positions are allowed. It must be reflected in large amplitudes of vibration of the C and O atoms.
In spite of the lower probability of gauche conformers in PTMG chains as compared to polyethylene chains, there are a certain number in the melt. This follows from the difference correlation curves (Figures 11, 12). These curves reflect the real picture of interatomic distance distribution only when the corresponding theoretical curves of intermolecular distances (subtracted from experimental curves) are calculated for conformations really present in the melt. If, in calculating theoretical curves, we underestimate the number of G (or T) conformers, it reflects in the correlation curve in the distance region along the chain to the third nearest neighbors for given conformers. This statement becomes clear if we compare the difference curves for crystalline PTMG, which may be considered as a model substance with well known structure and conformational state. As shown in Fig. 10, there are marked differences in the region 3 – 10 Å between the two curves which were obtained by subtracting the model curves calculated for TTTTT and TGTGT conformations from the experimental curves. It is worth noting that curve B represents in fact a nonreal situation because to obtain it, the theoretical curve for a chain with a great many gauche conformers was subtracted from the experimental curve for a crystal with few gauche conformers. Curve A (Fig. 10), on the contrary, corresponds to the curve


