

Yuriy Kruglyak. Quantum Chemistry_Kiev_1963-1991
.pdfmodeling was proposed by Gupta and Yeh [35] in the framework of the paracrystalline theory developed by Hosemann and Bagchi [36]. Unfortunately, in all these works the calculations have been done for molecules in conformations which are inherent to the crystalline state. However, it is well known that when flexible chain polymers transfer from the crystalline state into an amorphous one, conformational transitions play a very important role in structure changes and should influence the shape of RDF correspondingly.
One more factor to take into account when modeling RDF is the possibility of appearance of “spurious” oscillations [37]. This phenomenon is connected with the finite value of experimentally determined vectors in reciprocal space. Until the present, the effect of this factor on analysis and calculations of RDF was taken into account only qualitatively, thus influencing the correctness of conclusions as to the structure of substances.
In the present study we aimed to solve some questions connected with determining the character of short-range in liquid polymers with flexible chains. To understand the character of the origin and type of short-range ordering in polymers, it is desirable to make detailed structural investigation of the liquid state in a series of the polymers, beginning from low molecular weight oligomers up to high molecular weight polymers, which are capable of crystallizing at room temperature. The above comments explain our choice of the oligomeric analogs of polytetramethylene oxide. Structurally this material has additional interest not only because it gives the possibility to compare the short-range ordering of chains of the same chemical nature, but also because this oligomer is a constituent part of chains of such polymers as segmented polyurethanes and polyurethane networks. In our study oligomers with molecular weights in the range 500 – 2500 were used. Some of them can exist at room temperature, both in liquid and crystalline states, thus giving a fine opportunity to compare structural peculiarities in these substances in various phase states at the same temperature. It may be said that the short-range ordering in polymers is determined by mutual arrangements of adjacent macromolecular fragments in the range of 2 – 3 coordination spheres and by the conformational state of segments consisting of 10 – 15 chemical bonds. All oligomers under investigation have chain lengths above the values mentioned. Such oligomers may be described within the framework of concepts of persistent chains [38]. The question unresolved is whether the peculiarities of the structural state of oligomers may be transferred to high polymers. In accordance with current theories, the appearance of pure polymeric effects is due to the presence of a molecular network of entanglements [39]. In the oligoglycols such transition take place at molecular weight 1000 [40]. Therefore, in the molecular weight range 500 – 2500 there is the possibility not only to describe the
550
structure of liquid polymers with flexible chains but to compare data for oligomers with molecular weights below and above a critical one.
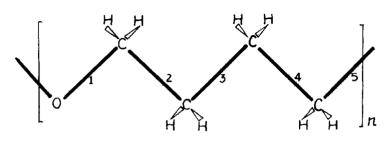
From the physical point of view polytetramethylene glycols are of special interest. It is known that their high molecular weight analog – polytetramethylene oxide – has the minimal melting point in the series [41]. As distinct from other members in the series polymethylene oxide, polyethylene oxide, and polyoxacyclobutane polytetramethylene glycol (PTMG) has a stable trans configuration for the chain in the crystalline state (Fig. 1).
Fig. 1. Fragment of the PTMG chain.
This conformation is the least stable in the series; however, crystallization in a helix conformation is not possible for this polymer, unlike the polymer homologs with a lesser number of methylene groups in the monomeric unit. Therefore the changes in structure and conformation during the transition of this polymer into the liquid state are of importance.
10.2. Experimental and computation methods
Polytetramethylene glycols with viscosity average molecular weights 500, 1350, and 2500 were used; the first is a liquid at room temperature, and the others are crystalline substances but capable of remaining in a liquid supercooled state for a long time. Due to this ability, they were investigated in both the liquid and crystalline states. The x-ray diffraction curves were obtained on an automatic diffractometer designed in our laboratory for investigations of polymers. Monochromatic molybdenum radiation was achieved using a graphite monochromator in the incident beam. An x-ray scientillation detector BDS-6 with pulse height analyzers VAV-100 in the main and monitor channels was used. Diffractograms were taken by stepscanning the detector over scattering angles 2θ =1.5 − 70 .
Taking of diffractograms was performed using a vacuum camera placed on the goniometer GUR-4. Samples under investigations were placed in a curvet with polyethelene terephthalate film windows in the center of the camera. The full angle interval was divided into three parts and diffractograms were taken in these parts independently at different experimental conditions. In the first angle interval 1.5 −18
551
the width of the detector slit was 0.28 , and the scanning step was 0.5 . In the interval 14 − 30 and 26 − 70 , these values were, respectively, 1.12 and 1 , and 2.24 and 1 . The total number of impulses stored for each point was 20,000 – 400,000. The intensity of scattering by the empty cuvet does not exceed 1% of the scattering by the sample.
Analysis of the resolution ability of our camera, based on the correction function in reciprocal space and information zone in physical space [36], has shown that the width of the correction function is 0.5 in the range of comparatively small scattering angles; this includes the main part of the information concerning molecular packing. As a result, using molybdenum radiation, the radius of the information zone in physical space for our diffractometer does not exceed 13 Å . It is evident that the corresponding scattering functions have information in the region of this zone only. Therefore the results of Fourier transformation of the intensity function reflect the true distribution of atomic centers in the sphere of radius mentioned. Due to this, analysis of RDF has physical meaning only in the interval of distances up to 13 Å . While it is probable that these functions have some peculiarities at greater distances, the interpretation of these results is questionable.
The initial treatment of the data consist of:
1.Statistical analysis of scattering data by cuvet alone cuvet with sample;
2.Introduction of the cuvet material, their absorbtion and polarization;
3.Smooting out of the intensity curves for any angle interval;
4.Formation of the total intensity curve from its different parts.
The statistical analysis of scattering data was performed by usual methods to give the more probable values of intensity for each point of the curve [42]. The corrections for absorption of x rays in a plane sample were introduced [43, 44]. The smoothing out of the intensity curves has been done by the least-squares method using polynomials of various powers for any part of the diffraction curve [45].
The calculation of RDF for atomic centers was performed using the formula
4πr2ρ(r) = 4πr2ρ0 + 2πr |
Smax |
|
|
∫ |
S I(S)sin(Sr)dS, |
(1) |
|
|
0 |
|
|
where ρ0 is the macroscopic density of the substance, r is the radial distance to any
atom of the substance, S = 4π sinθ/λ , Smax is the maximum value of S , 2θ is scattering angle, λ is the wave length,
|
|
n |
|
|
|
|
I(S) = J (S) − |
|
∑αk fk2(S) |
(2) |
|||
|
k=1 |
|
|
|||
|
n |
(S) |
2 |
|||
|
|
|||||
|
|
∑αk fk |
|
|
||
|
|
|
|
|
|
|
|
|
k=1 |
|
|
|
|
552
is the structure-sensitive part of the intensity curve, J (S) is the intensity of diffraction normalized to the average atom of sort k, αk is the partial molar quantity of atoms of sort k, n is the number of sorts of atoms in a monomer unit of a polymer, fk (S) is the
form factor of atoms of sort k.
The normalization of the intensity function to scattering by an average atom was done using a method developed in [44, 46]. To eliminate the low-frequency errors connected with incorrect values of form factors and absorption coefficients at different angles, the double Fourier transformation was used [47]. In calculating the RDF, the value Smax was taken such that I(S) equals zero at corresponding S values.
On the basis of the RDF of atomic centers, experimental correlation functions of interatomic distances were calculated (normalized RDF) according to
g(r) = |
4πr2 |
ρ(r) |
. |
(3) |
||
4πr2 |
ρ0 |
|||||
|
|
|
||||
The functions g(r) are the initial data for comparison with correlation functions based on various models. Curves g(r) characterize the degree of comparative excess of the atomic local density value at distance r relative to the arbitrary chosen atom above the level of macroscopic density (Figures 2 and 3).
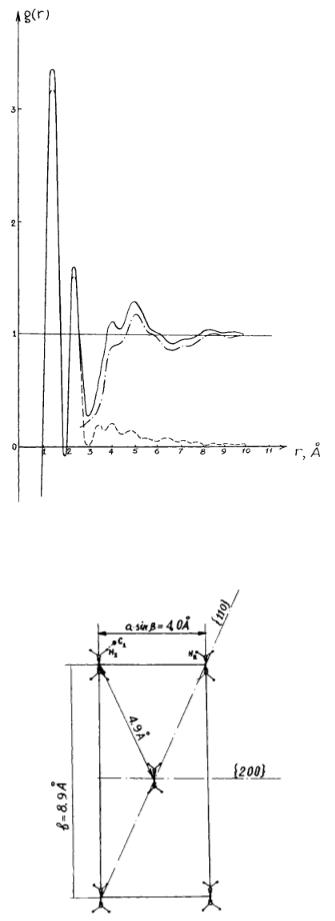
The first maximum of these curves is conditioned by the averaged contributions of the distances between all pairs of the valence-bonded atoms. The second maximum relates to the averaged distances between atoms divided by two chemical bonds. Both curves given are identical in the range of the first two maxima. In interval 3 – 10 Å, these curves are essentially different.
The important feature of the curve for crystal (Fig. 3) consists of two intensive peaks in the range 4.1 to 5 Å with feebly marked maxima along this part of the curve. Curve for liquid is characterized by the set of weak peaks against a background of appreciable curve increase in the range 4 – 6 Å and the curve lowering in the range 7 – 9 Å. It follows from experimental data on crystal structure of PTMG that the surrounding of each molecule of this polymer consists of two molecules located at a distance of 4 Å and four molecules at a distance equal to 5 Å: see Fig. 4 where the basic plane of the PTMG crystal lattice is shown.
These distances are close the maxima positions on for the crystal. However, almost the same values of the distances are characteristic for third and fourth neighbors in the conformation of the fully straightened chain (r3 = 3.88, r4 = 4.94). This leads to uncertainties in the interpretation of the maxima nature: it is not clear to what extent these maxima reflect features of molecular packing, and to what extent they reflect their conformational state.
553
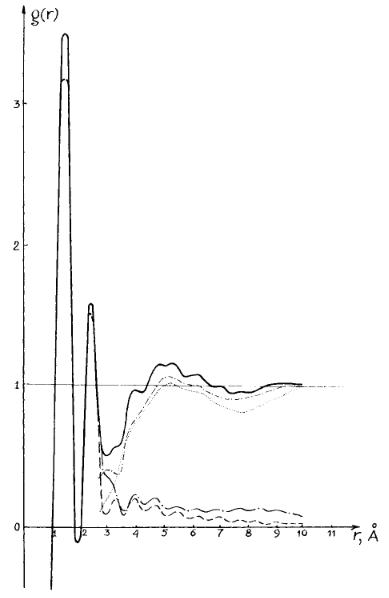
Fig. 2. Curves of the correlation of the interatomic distances for liquid PTMG:
( |
) : experimental curve. Conformational states: T – trans, G – gauche; |
( |
) : theoretical curve for TTTTT conformational state of the PTMG chain; |
( |
) : theoretical curve for TGTGT conformational state of the PTMG chain; |
( |
) : differential curve for TTTTT conformational state of the PTMG chain; |
( |
) : differential curve for TGTGT conformational state of the PTMG chain. |
The interpretation of for the liquid state of PTMG is even less meaningful in this interval of distance since the short-range order model has to be developed on the basis of the curve. According to one point of view [58 – 60] the shape of this curve is determined only be the correlation of mutual positions of molecules. On the contrary, some authors suppose that the locations of many weak peaks are caused by intramolecular distances from different conformers without any intermolecular effects [61, 62].
554
|
Fig. 3. Curves of the correlation of the interatomic distances for crystalline PTMG: |
||
( |
) : experimental curve; ( |
) : theoretical curve; ( |
) : differential curve. |
Fig. 4. Basic plane of the crystalline lattice of PTMG.
555

Such differences in the interpretation of the polymer RDF are connected with the lack of an objective method for their analysis. One may say that it is possible to make only one definite conclusion in this case: during the transition from the crystalline to the liquid state, the PTMG short-range order changes essentially. One must conclude that there is practically only one way to interpret RDF more fruitfully for such compounds – to perform model calculations.
10.3. Methods of conformational and modeling calculations
To estimate the conformational state of micromolecules , we apply a theoretical conformation analysis for the molecular fragment of PTMG shown in Figs 1 and 5.
Fig. 5. Fragment of the PTMG chain.
The potential energy was calculated as a sum of torsion potential and nonvalence interactions for all atoms with distances between them no more than 10Å. Foe the potential functions between nonbonded atoms, a Lennard-Jones potential with parameters proposed by Scott and Sheraga was used [48]. Thus the potential energy function had the following form:
E(τ |
,τ |
|
) = |
N |
B |
− |
a |
|
+ |
U |
0 |
(i) |
1 |
+cos |
( |
3τ |
|
+ |
U |
0 |
(i +1) |
1 |
+cos |
( |
3τ |
|
, |
(4) |
|
i+1 |
|
|
|
|
|
|
|
2 |
|
||||||||||||||||||||
|
r6 |
|
|
|
|
||||||||||||||||||||||||
i |
|
|
∑ r12 |
|
|
|
|
2 |
|
|
|
i ) |
|
|
|
|
|
|
|
i+1) |
|
|
|||||||
|
|
|
|
m<n |
mn |
|
mn |
|
|
|
|
|
|
|
|
|
|
|
|
|
|
|
|
|
|
|
|
|
|
where U0 (i) |
is the internal rotation barriers of the bond i, τi |
is the internal rotation |
|||||||||||||||||||||||||||
angle , and N is the number of atoms. To calculate the torsion potential, values U0 = 3 kcal/mol and 1.07 kcal/mol were taken for bonds C–C and C–O, reppectively. The geometry calculation for the molecular fragment was done using standard bond lengths CC = 1.54, CO = 1.43, CH = 1.1 Å and all valence angles were takes as 109.5º.
The ideal peak method [49 – 51] can be taken as a basis for model calculations. This method makes it possible to evaluate the profile of the maximum of RDF for the atomic pairs that are on the distance given; moreover, parameters of atomic vibrations for this distance and influence of the upper limit in integral (1) on the shape of the maximum which depends on “false” oscillations also being taken into account. Such methods of the synthesis of the RDF have been realized for some molecular liquids [52 – 55]. The main difficulty of such calculations for polymers consists in the
556

necessity to consider several thousand interatomic distances which becomes possible only with the use of computers. The modeling of the short-range order for polymers proposes the realization of the following computing procedures: (i) construction of the model and computation of all atomic coordinates, (ii) computation of all interatomic distances, and (iii) computation of the profile of the ideal peak for each atomic pair and integration of these peaks to construct the theoretical RDF.
The normalized RDF for PTMG were computed by summing the maximum profiles, corresponding to the contributions of all distances between atoms belonging to one molecule in a model structure. The simplest form for such maxima in computed RDF occurs for well-defined atomic positions. For this case the profile of the maximum corresponding to the interatomic distance rij and the amplitude of atomic displacement from the equilibrium position βij may be expressed as
|
|
|
|
r |
|
|
|
(r −rij ) |
2 |
|
|
|
(r + rij ) |
2 |
|
|
|
T |
(r) = |
|
|
|
|
|
|
|
|
|
(5) |
||||||
|
|
|
exp |
|
− |
2 |
|
−exp |
|
− |
2 |
|
|
. |
|||
|
|
|
|
||||||||||||||
|
|
|
|
||||||||||||||
ij |
|
πrijβij |
|
|
|
|
|
|
|||||||||
|
|
|
|
βij |
|
|
|
|
βij |
|
|
|
|||||
|
|
|
|
|
|
|
|
|
|
|
|
|
|
|
|
|
|
As the real values of Smax are not infinite, eqn. (5) gives an approximate
estimation of the contribution of interatomic distances to the RDF. It is known |
[36] |
that |
|
β > 2.3Smax. |
(6) |
Eqn. (5) may be used to find the profile of maxima of RDF. At smaller values, one should use more complicated approaches to find the profiles; in particular, eqn. (7) may be used [51], namely:
|
r |
Smax |
f |
(S) f |
j |
(S){cos[S(r −r )]−cos[S(r + r )]} |
|
|
|||||||||||||
Tij (r) = |
∫ |
i |
|
|
|
|
|
|
|
|
|
ij |
|
|
|
ij |
|
dS, |
(7) |
||
πr |
|
|
|
|
|
β |
|
S |
2 |
|
|
n |
|
|
2 |
|
|
||||
|
ij |
0 |
|
|
|
|
ij |
|
∑ |
|
|
|
|
|
|
||||||
|
|
|
|
|
|
|
exp |
|
|
|
|
αk fk |
(S) |
|
|
|
|
|
|||
|
|
|
|
|
|
|
|
2 |
|
|
|
|
|
|
|||||||
|
|
|
|
|
|
|
|
|
|
|
|
|
|
|
|
|
|
||||
|
|
|
|
|
|
|
|
|
|
|
|
|
|
k=1 |
|
|
|
|
|
|
|
where rij is the interatomic |
distance |
and |
βij |
is the |
parameter |
determining |
the |
||||||||||||||
amplitudes of the atomic vibrations. Now, the RDF for the model is computed by the expression
4πr2ρ(r) = |
1 |
N |
T (r), |
(8) |
|
N ∑ |
|||||
|
ij |
|
|||
|
|
|
|
||
j>i=1
where N is the number of atoms in the model chosen and theoretical value of normalized RDF is computed by eqn. (3) using eqn. (8) for its numerator.
557
When modeling the structure of PTMG, the total number of interatomic distances may be divided into intermolecular and intramolecular ones. The intramolecular distances are of two types – those nondependent on the conformational state of the macromolecule and those which are dependent on conformation. For conformation-nondependent, βij is in the same range of values as
for low molecular weight substances, namely, 0.04 – 0.09 Å [56]; their contribution to the RDF can only be estimated using eqn. (5). For conformation-dependent intrachain distances, βij is of the order of some 0.1 Å. In this case the more rough approximation
may be used. The same is valid for the distances between atoms of different chain.
In the present study all computational and modeling work were performed using computer BESM-6 with FORTRAN programs developed by N. E. Kruglyak [4].
10.4. Experimental data and results of calculations
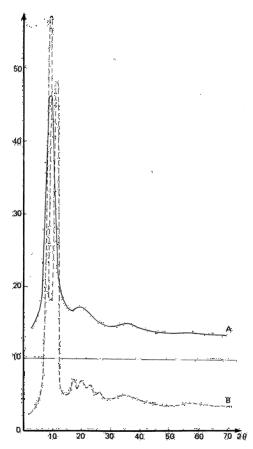
The intensity curves I(S) for all PTMG under investigation have a very intense broad maximum at 2θ = 9º and three gradually smoothing maxima at 19º, 35º, and 55º. One of these curves is shown in Fig. 6 as curve A for PTMG with a molecular weight of 1350.
Fig. 6. Intensity curves of the x-ray diffraction for liquid and crystalline PTMG.
558
The difference between the intensity curves for the various oligomers is only in the halfwidth and degree of asymmetry of the main maxima. The values of asymmetry degree are given in Table 1.
It is seen that increasing the molecular weight from 500 to 2500 leads to a decreasing degree of asymmetry of the main maxima.
The intensity curves for PTMG-1350 and PTMG-2500 in the crystalline state are identical. The most intense reflections on the diffraction curve for the crystalline oligomer PTMG-1350 (Fig. 6, curve B) are at 9º and 11º.
Table 1
The asymmetry characteristics of the main maxima for PTMG-500, PTMG-1350, and PTMG-2500*
Substance |
|
h / hm |
|
|
1 / 3 |
1 / 2 |
3 / 4 |
||
|
||||
PTMG-500 |
1.0 |
1.6 |
1.27 |
|
PTMG-1350 |
1.0 |
1.4 |
1.13 |
|
PTMG-2500 |
1.0 |
1.4 |
1.13 |
* h – height of asymmetry determination, hm – height of the main maximum.
These are the reflections from planes (020) and (110) of the crystalline lattice of polytetramethylene oxide [57]. The position of the (020) maximum is close to the position of the main maximum on the curves for the liquid oligomers, its wigth for the liquid being much greater than the (020) reflection for the crystal. At the same time, in the interval of angles corresponding to reflection from (110) planes, there no traces of the crystalline reflection.
The experimental interatomic correlation curves gexp (r) for the liquid oligomers
are essentially the same. Therefore, as a basis for the analysis, the data for PTMG-1350 were used. The correlation curves are shown in Fig. 7 for two values of Smax : 6.4 and 8.7 Å–1. The curve with Smax = 8.9 Å–1 is for the crystalline material.
The comparison of correlation curves for various Smax shows that with an increase in Smax the first two maxima become narrower and higher. There are some differencies for the curves with essentially the same Smax in the interval 3 – 10 Å; the
curves with Smax = 8.7 and Smax = 8.9 Å–1 have more maxima than curves with Smax = 6.4 Å–1, and the maxima have different positions on 8.7 and 8.9 Å–1 Smax curves.
There are intense, broad maxima in the interval 3.5 – 6.5 Å, broad minima in the interval 6.5 – 8.5 Å, and less intense maxima in the interval 8.5 – 10 Å in the crystalline 8.9 Å–1 Smax curve.
559