


murders linked through the common killer. Further data items were calculated from these relationships, such as the distance from residence to crime site. A total of 13 serial murder cases, comprising 15 serial killers, 178 victims, and 347 crime locations constitute the SFU data set.
9.2.2Serial Killer Characteristics
A breakdown of the characteristics for the 225 serial killers in the FBI data set is given in Table 9.2. The complete list is presented in Appendix A, Table A.1.
Table 9.2 Serial Killer Characteristics
Characteristic |
Results |
|
|
|
|
Offender Identity |
|
|
Known |
93.8% |
(211) |
Unknown |
6.2% (14) |
|
Sex |
|
|
Male |
90.7% |
(204) |
Female |
9.3% (21) |
|
Co-Killer |
|
|
Operated Alone |
75.6% |
(170) |
Operated With Partner |
24.4% |
(55) |
Mean Duration of Murder Activity |
4.4 Years |
|
Mean Number of Confirmed Victims |
9.7 |
|
Mean Number of Suspected Victims |
13.3 |
|
Mean Number of Different Cities |
2.8 |
|
Mean Number of Different States |
1.7 |
|
|
|
|
As there were 14 cases that remained unsolved with the identity of the offender unknown, the proportion of unsolved cases is 7.3% (there are 193 unique cases in the data set). The percentage of female offenders is comparable to that found in previous research (cf. Hickey, 1997; Newton; 1992), as is the estimate for mean duration of murder activity (cf. Hickey, 1991; Jenkins, 1988b). One-quarter of the serial murderers operated with a partner, and the proportion of cases with more than one offender is 11.9%. This estimate is at the low end of the range found in previous studies (cf. Hickey, 1997; Jenkins, 1990; Simonetti, 1984; Newton, 1992). Team killers averaged 1.7 partners.50
Figure 9.1 presents the distributions for number of confirmed and suspected victims by case. The mean for the suspected number of victims was calculated after eliminating those cases that claimed 100 or more victims, as
50 Interestingly, the hunting efficiency of solitary lions ranges from 8 to 19%, but increases to 30% in cooperative hunts (Barnard, 1984a; Schaller, 1972).
© 2000 by CRC Press LLC
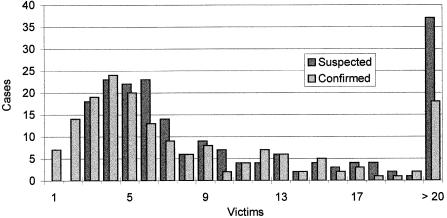
Figure 9.1 Confirmed and suspected victim numbers by case.
these figures were not considered reliable (the mean is 18.7 otherwise). The estimate for the mean number of different cities should be regarded with caution as the data appear to contain listings for both metropolitan areas (e.g., New York) and individual cities (e.g., Brooklyn, Queens).
9.2.2.1State Comparisons
Many researchers have noted regional variations in multiple murder, but there is little consensus as to where the high rate areas are. The Pacific Northwest is often held out to be the location with the most incidents of serial murder (Egger, 1990; Mathers, 1989). Cavanagh (1993) found that 39.6% of serial murder victims were from the Pacific subregion, a proportion more than twice as great as the next highest subregion. Levin and Fox (1985) observe that multiple murderers usually strike in urban areas, most likely in New York, Texas, or on the West Coast, particularly Southern California. They are least likely to attack in the Deep South, with the exception of Texas. But 64% of the female serial killers in Keeney and Heide’s (1994c) study were from the South, most commonly Florida (29%).
Hickey (1997) found a lack of regionality in serial murder, though California reported over half again the number of serial murder cases as New York, the next highest state. In Cavanagh’s (1993) analysis, California had over four times the number of victims of New York, the next highest state. Hickey observes that population density, particularly in metropolitan areas, appears to be a more important correlate than region. Jenkins (1990) suggests that the geographical concentration of serial murder in the western U.S. may be partially attributable to “a culture of casual predatory sexuality,” and differential access to vice facilities in Californian cities. Levin and Fox (1985)
© 2000 by CRC Press LLC