

The raptor approach was the most common attack method. Ambushes were primarily associated with either hunting or poaching search behaviour. There were no instances of victims being stalked (as defined in the hunting typology) prior to attack,53 despite commentary that serial and lust killers often engage in elaborate stalking as part of their careful, pre-crime planning (Holmes, 1991; Norris, 1988). Keeney and Heide (1994c) found little evidence of stalking behaviour on the part of female serial murderers, though over one third of the women in their study aggressively procured or lured victims.
Multiple responses were allowed for victim activity, and 225 actions were recorded. Disturbingly, almost one-third of the victims in this sample were attacked within their homes.54 Other common activities included walking or jogging, and prostitution. Not quite three quarters of the victims were females. Multiple responses were allowed for control and murder methods, and 201 and 210 responses, respectively, were recorded. Over half of the victims were controlled through an immediate and deadly blitz attack. Strangulation was the preferred method of murder. Only one-quarter of the victims’ bodies were well hidden by the killer.
9.4.3Locations
A breakdown of characteristics for the 347 crime locations in the data set is given in Table 9.6. Percentages and frequencies, or means, are used as appropriate.55 This is a summary of the information collected in the Data Coding Form #3: Serial Murder Locations (see Appendix B for the data coding form). Information regarding offence weekday and distance from offender residence to crime site (measured on a Manhattan metric) is also presented.
The crime location type counts are based on all 347 offence locations. The rest of Table 9.6 is based on 320 crime locations (those sites connected to same-incident secondary victims were excluded). Day of week is determined only from the encounter site dates. The other characteristics are presented for victim encounter sites, body dump sites, and all sites. For this purpose, the following crime locations types are classified as victim encounter sites (a total of 155 locations): (1) encounter; (2) encounter/attack;
(3) encounter/attack/murder; and (4) encounter/attack/murder/body dump. The following crime locations types are classified as body dump sites (a total
53Stalking behaviour has been observed in cases of serial rape. The determination of victim routine activity overlaps to identify common ground or “fishing holes” used by the offender is a viable line of police inquiry.
54Schlesinger and Revitch (1999) found 53.7% of the sexual homicide victims (n=106) they examined were murdered within their residence. In the FBI rape study, 64% of the encounter sites were at the victim’s home or workplace, and 70% were indoors (Warren et al., 1995); only 15% of the crimes involved transportation. Offenders who primarily raped indoors tended to be more selective in choice of victim.
55Percentages may add to more than 100 because of multiple responses.
©2000 by CRC Press LLC

Table 9.6 Serial Murder Location Data
|
Characteristic |
Results |
|
|
|
|
|
|
|
|
Crime Location Type |
|
|
|
|
|
|
|
|
|
Encounter Site |
27.7% |
(96) |
|
|
Encounter/Attack Site |
2.3% |
(8) |
|
|
Encounter/Attack/Murder Site |
1.4% |
(5) |
|
|
Encounter/Attack/Murder/Body |
19.9% |
(69) |
|
|
Dump Site |
|
|
|
|
Attack Site |
1.7% |
(6) |
|
|
Attack/Murder Site |
11.0% |
(38) |
|
|
Attack/Murder/Body Dump Site |
15.0% |
(52) |
|
|
Murder Site |
2.6% |
(9) |
|
|
Murder/Body Dump Site |
1.4% |
(5) |
|
|
Body Dump Site |
13.5% |
(47) |
|
|
Body Dump/Vehicle Drop Site |
0.9% |
(3) |
|
|
Vehicle Drop Site |
2.3% |
(8) |
|
|
Found Evidence Site |
0.3% |
(1) |
|
|
Day of Week |
Encounter Sites |
|
|
|
|
|
|
|
|
Monday |
12.9% |
(20) |
|
|
Tuesday |
10.3% |
(16) |
|
|
Wednesday |
8.4% (13) |
|
|
|
Thursday |
16.8% |
(26) |
|
|
Friday |
7.7% (12) |
|
|
|
Saturday |
16.1% |
(25) |
|
|
Sunday |
23.2% |
(36) |
|
|
Unknown |
4.5% |
(7) |
|
Distance to Crime Site |
Encounter |
Body Dump |
All Sites |
|||
|
|
|
|
|||
Number of Crimes Sites |
155 |
104 |
320 |
|||
Mean Distance |
21.8 km |
33.7 km |
25.8 km |
|||
0 Kilometres |
1.3% |
(2) |
16.3% |
(17) |
11.9% (38) |
|
0.1 — 1.0 kilometres |
7.1% (11) |
1.0% |
(1) |
4.4% |
(14) |
|
1.1 — 5.0 kilometres |
14.8% |
(23) |
2.9% |
(3) |
8.8% |
(28) |
5.1 — 10.0 kilometres |
11.6% |
(18) |
13.5% |
(14) |
10.3% (33) |
|
10.1 — 15.0 kilometres |
15.5% |
(24) |
5.8% |
(6) |
9.4% |
(30) |
15.1 — 20.0 kilometres |
4.5% |
(7) |
4.8% |
(5) |
4.4% |
(14) |
20.1 — 50.0 kilometres |
34.2% |
(53) |
29.8% |
(31) |
29.1% (93) |
|
Over 50 kilometres |
5.2% |
(8) |
20.2% |
(21) |
10.6% (34) |
|
Unknown |
5.8% |
(9) |
5.8% |
(6) |
11.3% (36) |
|
Crime Location Known to Police |
Encounter |
Body Dump |
All Sites |
|||
|
|
|
|
|
|
|
Yes |
70.3% (109) |
67.3% |
(70) |
60.9% |
(195) |
|
No |
29.7% |
(46) |
32.7% |
(34) |
39.1% |
(125) |
© 2000 by CRC Press LLC

Table 9.6 Serial Murder Location Data (continued)
Area Land Use |
Encounter |
Body Dump |
All Sites |
|||||
|
|
|
|
|
|
|||
Residential |
45.8% |
(71) |
45.2% |
(47) |
45% (144) |
|||
Commercial |
43.2% |
(67) |
3.8% |
(4) |
24.4% |
(78) |
||
Industrial |
0% |
(0) |
5.8% |
(6) |
3.4% |
(11) |
||
Institutional |
3.2% |
(5) |
1.0% |
(1) |
1.9% |
(6) |
||
Park |
1.3% |
(2) |
5.8% |
(6) |
2.5% |
(8) |
||
Rural or Agricultural |
0.6% |
(1) |
12.5% |
(13) |
5.3% |
(17) |
||
Wilderness or Uninhabited |
1.3% |
(2) |
21.2% |
(22) |
9.1% |
(29) |
||
Unknown |
4.5% |
(7) |
4.8% |
(5) |
8.4% |
(27) |
||
Site Description |
Encounter |
Body Dump |
All Sites |
|||||
|
|
|
|
|
|
|
||
Residence |
29% |
(45) |
17.3% |
(18) |
27.2% |
(87) |
||
Hotel or Motel |
0.6% |
(1) |
0% (0) |
1.3% |
(4) |
|||
Public Building |
1.3% |
(2) |
0% (0) |
0.6% |
(2) |
|||
School or Educational |
0.6% |
(1) |
0% (0) |
0.3% |
(1) |
|||
Business or Shopping Site |
11% |
(17) |
1.0% |
(1) |
7.8% |
(25) |
||
Entertainment Site |
5.8% |
(9) |
0% (0) |
2.8% |
(9) |
|||
Red-Light Zone |
23.2% |
(36) |
0% (0) |
11.3% |
(36) |
|||
Vehicle |
6.5% (10) |
5.8% |
(6) |
11.6% |
(37) |
|||
Public Transportation |
10.3% |
(16) |
1.0% |
(1) |
5.3% |
(17) |
||
Private Yard |
1.3% |
(2) |
5.8% |
(6) |
2.5% |
(8) |
||
Parking Lot |
3.9% |
(6) |
2.9% |
(3) |
3.4% |
(11) |
||
Street or Sidewalk |
51% |
(79) |
16.3% |
(17) |
34.7% |
(111) |
||
Alley, Lane, Pathway, or Trail |
0.6% |
(1) |
11.5% |
(12) |
5.3% |
(17) |
||
Highway or Ditch |
5.8% |
(9) |
3.8% |
(4) |
5.6% |
(18) |
||
Park |
1.9% |
(3) |
6.7% |
(7) |
3.1% |
(10) |
||
Farm, Field, or Open Area |
0% |
(0) |
11.5% |
(12) |
4.1% |
(13) |
||
River, Lake, or Marsh |
0% |
(0) |
20.2% |
(21) |
7.2% |
(23) |
||
Forest or Woods |
0.6% |
(1) |
21.2% |
(22) |
8.4% |
(27) |
||
Hills or Mountains |
0% |
(0) |
4.8% |
(5) |
1.6% |
(5) |
||
Desert or Wasteland |
0% |
(0) |
3.8% |
(4) |
1.3% |
(4) |
||
Other |
0% |
(0) |
4.8% |
(5) |
2.5% |
(8) |
||
Unknown |
0% |
(0) |
0% (0) |
0.9% |
(3) |
|||
Site Classification |
Encounter |
Body Dump |
All Sites |
|||||
|
|
|
|
|
|
|
||
Inside Private |
27.7% |
(43) |
15.4% |
(16) |
27.2% |
(87) |
||
Inside Semi-Public |
7.1% (11) |
0% (0) |
3.4% |
(11) |
||||
Inside Public |
2.6% |
(4) |
0% (0) |
1.3% |
(4) |
|||
Outside Private |
1.3% |
(2) |
3.8% |
(4) |
2.2% |
(7) |
||
Outside Semi-Public |
0% |
(0) |
6.7% |
(7) |
2.5% |
(8) |
||
Outside Public |
61.3% |
(95) |
73.1% |
(76) |
62.5% |
(200) |
||
Unknown |
0% |
(0) |
1.0% |
(1) |
0.9% |
(3) |
||
© 2000 by CRC Press LLC

Table 9.6 Serial Murder Location Data (continued)
Killer Travel Method |
Encounter |
Body Dump |
All Sites |
||||
|
|
|
|
|
|
|
|
Vehicle |
81.9% |
(127) |
78.8% |
(82) |
83.4% |
(267) |
|
Public Transportation |
8.4% |
(13) |
6.7% |
(7) |
7.2% |
(23) |
|
On Foot |
7.7% |
(12) |
13.5% |
(14) |
8.1% |
(26) |
|
Other |
1.3% |
(2) |
0% (0) |
0.6% |
(2) |
||
Unknown |
0.6% |
(1) |
1.0% |
(1) |
0.6% |
(2) |
|
Victim or Killer Residence |
Encounter |
Body Dump |
All Sites |
||||
|
|
|
|
|
|
|
|
Killer Residence |
1.3% |
(2) |
16.3% |
(17) |
11.9% |
(38) |
|
Victim Residence |
25.2% |
(39) |
1.9% |
(2) |
12.8% |
(41) |
|
Both |
0% (0) |
0% (0) |
0% (0) |
||||
Neither |
73.5% |
(114) |
81.7% |
(85) |
74.1% |
(237) |
|
Unknown |
0% (0) |
0% (0) |
1.3% |
(4) |
|||
of 104 locations): (1) attack/murder/body dump; (2) murder/body dump;
(3) body dump; and (4) body dump/vehicle drop.
Figure 9.3 shows serial murder incidents by day of week (based on encounter site date). Almost 40% of the cases occurred on the weekend as evidenced by the Saturday/Sunday bulge in the radar chart. Consistent with the routine activity approach, this finding is explained both by the greater opportunity an offender has to hunt during the weekend, and by the increased availability of victims.56
The valid percentages of cases falling into various distance-to-crime site ranges are shown in Figure 9.4.57 Excluding those cases where the offender kept the victim’s remains at home, body dump sites tend to be located further than victim encounter sites from the killer’s residence. This is probably the result of two factors. First, it appears that victim search activity occurs frequently while body disposal happens infrequently (see the case synopsis for Clifford Olson, for example). Second, optimal body disposal sites are often situated in uninhabited regions located some distance from urban areas.
The mean distance ratio between body dump and encounter sites is 11.6 (standard deviation = 25.9).58 Ratios less than one usually involve incidents in which an attempt was made to hide the body. There is some relationship between this ratio and the distance from offender residence to encounter site. If the latter is less than 1.0 kilometres, then the mean distance ratio is 26.0;
56Warren et al. (1995) found no difference in serial rape occurrence by day of week, but did observe larger hunting areas associated to weekend offenders. Such a result is consistent with the greater victim search opportunities available to employed offenders on Saturdays and Sundays.
57Outliers were excluded.
58A crime was excluded if either the victim encounter or body dump occured at the offender’s residence.
©2000 by CRC Press LLC
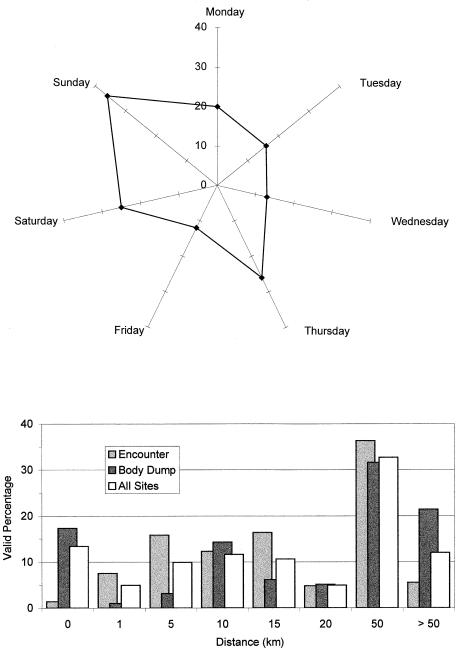
Figure 9.3 Serial murder by day of week.
Figure 9.4 Distance to crime site.
© 2000 by CRC Press LLC