

Учебники / Head_and_Neck_Cancer_Imaging
.pdf146 |
V. F. H. Chong |
a |
b |
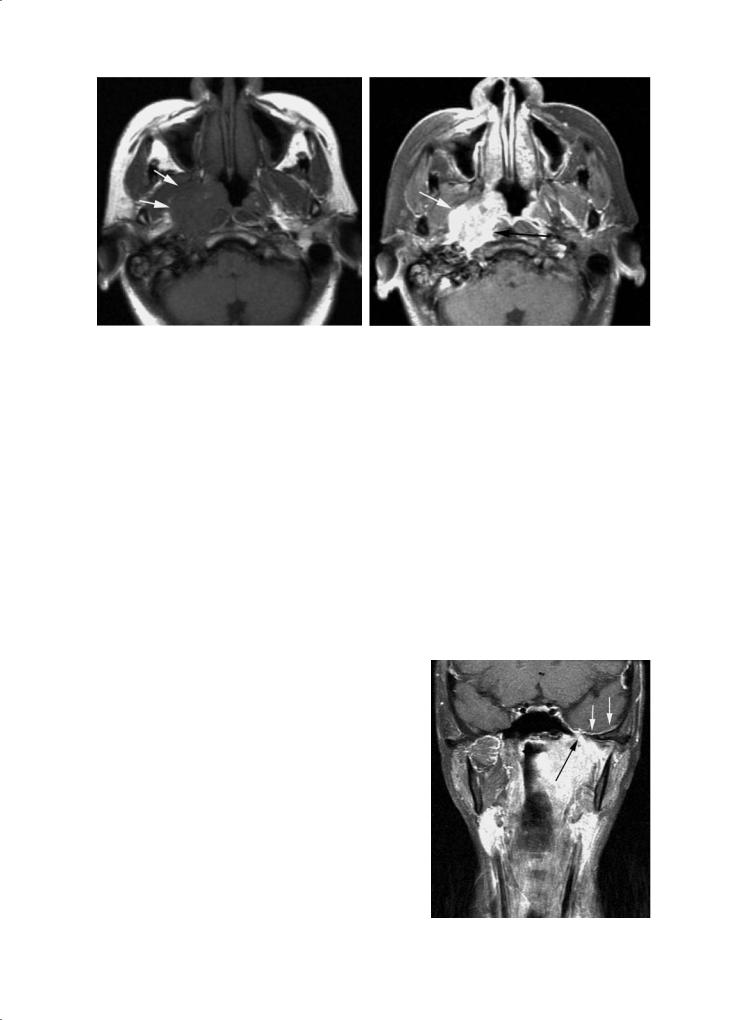
Fig. 8.3a,b. NPC spread along eustachian tube. a Axial T1-weighted MR image shows intermediate signal intensity tumor in eustachian tube (white arrow) and tumor eroding clivus (black arrows). b Axial contrast-enhanced MR image shows enhanced tumor in eustachian tube (thin arrows). Note secondary inflammatory changes in mastoid cells (thick arrow)
a |
b |
|
Fig. 8.4a–c. NPC with extension into PPF and orbit. a Axial CT shows tumor |
|
eroding and widening right pterygopalatine fossa (thick arrow); compare to |
|
normal contralateral side (thin arrow). b Axial CT shows tumor extending |
|
into and widening right inferior orbital fissure (arrow). c Axial CT shows |
|
tumor in right orbital apex (white arrow) and erosion of superior orbital |
c |
fissure (black arrow) |
Neoplasms of the Nasopharynx |
147 |
a |
b |
Fig. 8.5a,b. NPC with parapharyngeal spread. a Axial T1-weighted MR image shows tumor extending into right parapharyngeal space (arrows). b Axial fat-suppressed contrast-enhanced MR image shows enhanced tumor displacing lateral pterygoid muscle (white arrow) and invading right prevertebral muscle (black arrow)
a 
 b
b
Fig. 8.6a–c. NPC with masticator space involvement. a Axial contrast-en- |
|
hanced MR image shows tumor invasion of left masticator space (black |
|
arrow). There is tumor encasement of left carotid sheath (white arrow). |
|
b Coronal T1-weighted MR image shows invasion of left pterygoid muscle |
|
(asterisk). Normal right lateral pterygoid muscle (thin arrow). c Coronal con- |
|
trast-enhanced MR image shows tumor extension into left foramen ovale |
|
(black arrow). Note early thickening of the ipsilateral dura along floor of |
|
middle cranial fossa (white arrows) |
c |

148 |
V. F. H. Chong |
infiltration and subsequent intracranial extension. Denervation changes are readily demonstrated on MR images (Fig. 8.7).
Changes in the skeletal muscles following denervation can be divided into three phases: acute, subacute and chronic. Animal models show that in the first 4 weeks, there is a decrease in the caliber of muscle fibers but no change in the total amount of tissue water. There is, however, a relative decrease in intracellular water associated with a relative increase in extracellular water. In the chronic phase, muscle atrophy associated with fatty infiltration takes place. A mixture of features seen in the acute and chronic stages characterises the subacute phase. In addition, there is a relative increase in the perfusion of muscles following denervation.
In the acute to subacute phases, T2-weighted images show high signals thus producing an edema-like
appearance (Chong et al. 2004a). This is because T2 of extracellular water is longer than the T2 of intracellular water. In addition, there is a relative increase in perfusion and increased accumulation of contrast in the extracellular spaces in denervated muscles resulting in increased contrast enhancement (Fig. 8.7). In the chronic phase, there is muscle atrophy and increased signals on T1 and fast spin echo T2 weighted images due to fat accumulation.
The MRI features may be confused with tumor infiltration of the muscles concerned. It should be noted that malignant infiltration produces an increase in size of the affected muscles, whereas, denervation atrophy shows a decrease in muscle bulk. Additionally, the signal changes in denervation atrophy are generalised and higher in signal intensity. Malignant infiltration of the muscles on the other hand is more localised and lower in signal intensity.
a 
 b
b
|
Fig. 8.7a–c. Masticator muscle denervation atrophy. a Axial T1-weighted |
|
MR image shows atrophy of right lateral pterygoid muscle (white ar- |
|
row), right masseter muscle (black arrowhead) and right temporalis |
|
muscle (black arrow). b Axial contrast-enhanced MR image shows en- |
|
hancement in atrophied right lateral pterygoid muscle (arrow). c Axial |
|
T2-weighted MR image shows high signal intensity within atrophied |
c |
right lateral pterygoid muscle (arrow) |

Neoplasms of the Nasopharynx |
149 |
8.3.3 |
8.3.4 |
Posterior Spread |
Inferior Spread |
NPC can extend posteriorly infiltrating the RPS and prevertebral muscles (Fig. 8.5).Destruction of the vertebral bodies and involvement of the spinal canal is occasionally seen in neglected patients. Posterolateral spread results in the encasement or infiltration of the carotid sheath (Fig. 8.6). Posterosuperior extension may involve the jugular foramen and the adjacent hypoglossal canal thus endangering the cranial nerves IX–XII (Fig. 8.8) (Chong and Fan 1998). Subsequent spread into the posterior cranial fossa is not uncommon.
Involvement of the hypoglossal nerve results in hypotonia and atrophy of the tongue musculature (Fig. 8.9). The earliest clinical sign is muscle fasciculation; atrophy may not be obvious. At this stage, radiological signs of atrophy and fatty infiltration may be subtle. However, the affected side of the tongue can be seen to drop backwards in axial images; this is a helpful sign, easily seen in lower sections showing the posterior aspect of the tongue (Chong and Fan 1998). It is important to note that posterior displacement of the tongue may give the impression of an apparent increase in its length. MRI may show contrast enhancement and high T2 signal intensity changes in the tongue as a result of perineural infiltration or encasement of the hypoglossal nerve. The findings are similar to those observed in the muscles of mastication following tumor infiltration of the mandibular nerve.
Some tumors show preferential inferior spread along the pharyngeal wall.This may take place submucosally and thus escapes endoscopic detection. Submucosal spread into the oropharynx can readily be detected on imaging studies. The oropharyngeal wall shows subtle to gross wall thickening (Fig. 8.10). Tumor may also spread along the retropharyngeal space. Hence, imaging plays an important role in accurate tumor staging and mapping. However, in advanced cases, the tumor in the oropharynx may be clearly seen during clinical examination.
8.3.5
Superior Spread
When NPC spreads superiorly it may erode the clivus, sphenoid sinus floor, petrous apex, and the foramen lacerum. Skull base erosion is detected in up to onethird of the patients. The frequency of intracranial abnormalities on CT is 12% and on MRI 31% (Chong et al. 1996a; Sham et al. 1991a). This difference can be explained by the higher sensitivity of MRI.
For a long time, NPC was believed to spread intracranially mainly through the foramen lacerum (Neel 1986). CT studies however showed that the most common manner of intracranial spread was by direct skull base erosion (Curtin and Hirsch 1991; Sham et al. 1991b). However, on MRI the most
a 
 b
b
Fig. 8.8a,b. NPC showing posterolateral spread. a Axial T1-weighted MR image shows a large right nasopharyngeal tumor with extension into right hypoglossal canal (arrow). b Axial contrast-enhanced MR image shows tumor enhancement (white arrow). Note tumor involvement of clivus marrow (black arrow)

150 |
V. F. H. Chong |
Fig. 8.9. Hypoglossal nerve palsy. Axial contrast-enhanced CT shows right hemitongue atrophy with fatty infiltration. Note posterior displacement of right tongue base (thick white arrow), atrophied right geniohyoid-genioglossus complex (thin white arrow) and compensatory hypertrophy of right geniohyoid-genioglossus complex (black arrow)
common route involves the foramen ovale (Fig. 8.11) (Chong et al. 1996a; Su and Lui 1996). Dural thickening along the floor of the middle cranial fossa may be the first sign of intracranial infiltration and this feature can be detected on MRI (Fig. 8.6). It should be noted that dural thickening itself does not constitute conclusive of malignant infiltration. It is known that dura thickening may be due to reactive hyperplasia. Tumor may also be seen infiltrating the mandibular nerve, gasserian ganglion, trigeminal nerve and pons
(Chong 1996). This often results in denervation atrophy of the muscles of mastication. Intracranial extension usually involves the cavernous sinus thus placing the III, IV, ophthalmic division of V, and VI nerves at risk.
8.4 Metastasis
8.4.1
Nodal Metastasis
Cervical nodal metastasis is common in NPC. Often, it is the enlarged neck nodes that prompt initial medical consultation. In all, 75% of patients have enlarged cervical nodes at presentation (Chong et al. 1996b). Bilateral cervical lymphadenopathy may be seen in up to 80% of patients. Nodal metastasis shows an orderly inferior spread and the affected nodes are larger in the upper neck (Sham et al. 1990b). LRP lymphadenopathy may be seen in 65% of patients with cervical metastasis. Although the LRP nodes are considered first echelon nodes, 35% of metastasis bypasses the LRP nodes to reach the cervical nodes (Chong et al. 1995a).
8.4.2
Distant Metastasis
NPC shows a high frequency of distant metastasis compared with other tumors of the head and neck.
a 
 b
b
Fig. 8.10a,b. NPC with inferior spread to oropharynx. a Axial contrast-enhanced CT shows a large NPC (asterisk). Note also tumor infiltration of right retropharyngeal space and prevertebral muscle (black arrow). b Axial contrast-enhanced CT shows tumor extension in right pharyngeal wall (opposing arrows)

Neoplasms of the Nasopharynx |
151 |
a 
 b
b
c |
d |
Fig. 8.11a–d. NPC with intracranial extension. a Axial contrast-enhanced MR image shows enhanced right nasopharyngeal tumor (arrow). b Axial contrast-enhanced MR image shows dense enhancement in the right foramen ovale (arrow). c Axial contrast-enhanced MR image shows intracranial tumor adjacent to the right internal carotid artery (arrow). d Coronal contrastenhanced MR image shows right NPC extending through the foramen ovale (arrow)
The frequency of distant spread varies between 5% and 41% compared with 5%–24% in other head and neck tumors. Patients with low cervical lymphadenopathy, especially in the supraclavicular fossa, have a significantly higher risk of distant metastasis (Lee et al. 1996). This observation can be explained by the nature of the lymphatic drainage of the head and neck. Lymph flows down the neck and the supraclavicular nodes form the last defensive barrier to the spread of malignant cells within the lymphatic vessels. Malignant cells upon escaping the supraclavicular nodes enter the thoracic duct and subclavian vein resulting in systemic dissemination. Alternatively, tumor cells upon spreading into the PPS enter the
parapharyngeal venous plexus resulting in systemic spread (Cheng et al. 2005). Common sites of metastasis include bone (20%), lung (13%) and liver (9%) (Sham et al. 1990c).
8.5
TNM Staging System
Before 1997, the main staging system used in East Asia was that of Ho’s classification. In addition, staging systems for NPC have proliferated in the absence of an international consensus. The 5th edition (1997) of the

152
UICC TNM Classification (published in collaboration with the American Joint Committee on Cancer) introduced prominent modifications in the stage classification for NPC. This was made in response to a need for an updated and new staging system to facilitate the sharing of knowledge and the comparison of data. No significant changes to the NPC staging (Tables 8.1 and 8.2) were introduced in the 6th edition (2002) (Sobin and Wittekind 2002; Green et al. 2002).
The TNM system was originally constructed to assess only three basic indicators of anatomic spread (tumor, node, metastasis). However, over the years, non-anatomic factors were included to further refine prognostic accuracy (Sobin 2003; Gospodarowicz et al. 2004). In recent years, efforts were directed at elucidating the relationship between the TNM system and tumor volume in stratifying patients into prognostic groups.
Many investigators working in the field of NPC research have shown that tumor volume is an independent prognostic indicator. Tumor volume was consistently shown to be more accurate than the TNM system in predicting NPC treatment outcome (Chua et al. 1997; Willner et al. 1999; Chen et al. 2004; Sze et al. 2004). With the development of new tumor volume measuring tools and further validation studies, tumor volume could in future be incorporated into NPC TNM staging system (Chong et al. 2004b,c).
8.5.1
T Staging
8.5.1.1
T1 Tumors
V. F. H. Chong
Table 8.1. Nasopharyngeal carcinoma: 6th edition TNM Classification (2002)
T – Primary Tumor
TI |
Tumor confined to nasopharynx |
|
T2 |
Tumor extends to soft tissue of oropharynx |
|
|
and/or nasal fossa |
|
|
T2a |
Without parapharyngeal extension |
|
T2b |
With parapharyngeal extension |
T3 |
Tumor invades bony structures and/or paranasal |
|
|
sinuses |
|
T4 |
Tumor with intracranial extension and/or involvement |
|
|
of cranial nerves, infratemporal fossa, hypopharynx, or |
|
|
orbit |
|
N – Regional Lymph Nodes
NX Regional lymph nodes cannot be assessed N0 No regional lymph node metastasis
N1 Unilateral metastasis in lymph node(s), 6 cm or less in greatest dimension, above supraclavicular fossa
N2 Bilateral metastasis in lymph node(s), 6 cm or less in greatest dimension, above supraclavicular fossa
N3 Metastasis in lymph node(s)
(a)Greater than 6 cm in dimension
(b)In the supraclavicular fossa
Table 8.2. Nasopharyngeal carcinoma: stage grouping
Stage 0 |
Tis |
N0 |
M0 |
Stage I |
T1 |
N0 |
M0 |
Stage IIA |
T2a |
N0 |
M0 |
Stage IIB |
T1 |
N1 |
M0 |
|
T2a |
N1 |
M0 |
|
T2b |
N0, N1 |
M0 |
Stage III |
T1 |
N2 |
M0 |
|
T2a, T2b |
N2 |
M0 |
|
T3 |
N0, N1, N2 |
M0 |
Stage IVA |
T4 |
N0, N1, N2 |
M0 |
Stage IVB |
Any T |
N3 |
M0 |
Stage IVC |
Any T |
Any N |
M1 |
|
|
|
|
T1 tumors are limited to the nasopharynx and confined within the pharyngobasilar fascia (Fig. 8.2). There are two points worth noting. Firstly, a T1 tumor should not spread into the nasal cavity. In cross-sec- tion imaging, a line joining the posterior free margins of the medial pterygoid plates can be used to demarcate the nasopharynx from the nasal cavity. Secondly, involvement of the prevertebral muscles is, anatomically speaking, spread beyond the nasopharynx. However, this by itself is not given a higher T classification and is still considered a T1 tumor.
8.5.1.2
T2 Tumors
T2 tumors extend beyond nasopharynx into the oropharynx or into the nasal fossa. T2 tumors are subdi-
vided into T2a (without parapharyngeal extension) and T2b (with parapharyngeal extension).
There is a need to define the radiologic boundary between the nasopharynx and the oropharynx. This issue may require attention in future staging definitions. Using the soft palate (which slopes posteroinferiorly during imaging studies) as a demarcating structure can be difficult. The hard palate is a possible alternative landmark. There is, however, one important potential difficulty. NPC spreads into the oropharynx posteriorly. Extrapolating the hard palate posteriorly may produce inconsistent results, as the slope of the hard palate is dependent on the degree of flexion or extension of the neck. Generally speaking an adopted landmark should be as close to the tumor as possible and as such the C1/C2 level appears more appropriate.

Neoplasms of the Nasopharynx |
153 |
In the TNM staging system, parapharyngeal involvement is defined as “posterolateral infiltration beyond the pharyngobasilar fascia” (Sobin and Wittekind 2002). There is still a lack of consensus about the significance of parapharyngeal extension. Nevertheless, parapharyngeal involvement is currently categorized as T2b to facilitate future review.
Although the TNM system defined parapharyngeal spread as “posterolateral infiltration beyond the pharyngobasilar fascia”, it is not entirely clear to a diagnostic radiologist what this actually means. This problem is compounded by the presence of two definitions of PPS within the diagnostic radiology circle. The first definition includes two components: the “prestyloid parapharyngeal space” which is fat-filled and the “retrostyloid parapharyngeal space” containing the carotid sheath. The second definition designates the above two components as “parapharyngeal space” (excluding the carotid space) and “carotid space” (a more detailed discussion on the anatomic nomenclature concerning the PPS is in Chap. 9). The TNM definition appears to refer only to the “retrostyloid parapharyngeal space”.
8.5.1.3
T3 Tumors
Tumors that invade bony structures and the paranasal sinuses are classified T3 lesions. There are no separate sub-classifications for involvement of the various sinuses, bony structures or the skull base. Some investigators have shown that bone erosion in itself (without associated cranial nerve involvement) does not appear to be an important prognostic indicator. However, subdivisions may be required following further validation studies (Lu et al. 2001; Roh et al. 2004).
8.5.1.4
T4 Tumors
Tumors with intracranial extension, involvement of cranial nerves, infratemporal fossa, hypopharynx and orbit are classified as T4 tumors.
Involvement of the infratemporal fossa is defined as “extension of tumor beyond the anterior surface of the lateral pterygoid muscle or lateral extension beyond the posterolateral wall of the maxillary antrum and pterygomaxillary fissure” (Sobin and Wittekind 2002). This definition of infratemporal fossa involvement will present difficulties to a radiologist unless he is familiar with the term as specifically used in NPC staging classification. Furthermore, the
2002 edition of TNM included the masticator space under T4 classification without any definition of masticator space. Future editions of TNM should clarify the definitions of infratemporal fossa, the masticator space and their relationship.
Involvement of the orbit is classified T4 disease. In most instances, tumor spreads to the orbit via the PPF and the inferior orbital fissure. It remains unclear whether infiltration of the PPF or the inferior orbital fissure themselves should be classified T4 as these areas are not mentioned specifically.
8.5.2
N Staging
The distribution and prognosis of nodal metastasis is sufficiently different from other head and neck tumors to justify the use of a different N classification system. In NPC, nodal size of 6 cm is used to separate N1 and N2 disease in contrast to 3 cm in other head and neck malignancies. The level of nodal involvement is also important and a new term, the supraclavicular fossa, is now introduced in N staging.
The supraclavicular fossa is an unfamiliar staging term outside Asia. The supraclavicular fossa is formed by three points: (1) the superior margin of the sternal end of the clavicle; (2) the superior margin of the lateral end of the clavicle; (3) the point where the neck meets the shoulder. Nodes in the supraclavicular fossa will include caudal portions of levels IV and V.
It should be noted that involvement of the LRP nodes does not appear to affect prognosis in NPC. Hence, there is insufficient evidence for an N1 classification when LRP nodes are demonstrated, regardless of the nodal size. In contrast, in other head and neck tumors, LRP lymphadenopathy signifies a poor prognostic outcome.
8.6
Imaging Technique
The technique for CT will vary slightly depending on the scanner used. In general 3-mm axial sections through the skull base and nasopharynx should be obtained preceded by axial 5-mm sections through the neck. The volume of contrast injected also varies from institutions to institutions. Administration of 100–150 ml of contrast appears adequate for opacify-

154 |
V. F. H. Chong |
ing vessels and lesions in present generation of CT scanners. In all cases, images obtained through the skull base are reconstructed using a high-resolution bone algorithm. Although desirable, routine coronal sections need not be obtained.
For MRI, following sequences are adequate: 4-mm sections with 1.5-mm spacing using spin echo axial and coronal T1-weighted pre-contrast images and fast spin echo fat-suppressed axial T2-weighted images; following administration of gadolinium, fat-suppressed axial and coronal T1-weighted images are obtained.
8.7
Imaging Modalities
Compared with the pre-CT era, the post-CT period witnessed a dramatic improvement in treatment outcome of NPC. This was initially largely attributed to improvements in tumor staging and definition of tumor extent. Subsequent improvement in radiation treatment and chemotherapy techniques further improved the treatment results. The place of CT in the evaluation of NPC is now extensively documented. CT remains the most commonly used modality for staging in regions where NPC occur with high frequencies, as access to MRI is still limited.
MRI is superior to CT in demonstrating the tumor soft tissue extent (Mukherji et al. 1997). It was
generally accepted that CT was superior to MRI in detecting skull base involvement. It is now known that MRI is more sensitive to CT in detecting skull base marrow changes (Chong and Fan 1996b; Ng et al. 1997). CT often underestimates the frequency and extent of skull base involvement (Fig. 8.12). These marrow changes could represent tumor infiltration, inflammation or both. Hence, although MRI is more sensitive to CT in detecting marrow changes, the specificity of this observation remains unknown. This is because, unlike laryngeal cartilage signal abnormalities in patients with squamous cell carcinoma, histopathologic verification of skull base lesions cannot be easily performed. The nasopharynx is a relatively inaccessible place. Furthermore, the mainstay of treatment is radiation therapy. As a result, surgical verification of abnormalities detected by imaging studies is difficult.
Perineural tumor spread in head and neck cancers is well documented. The most commonly affected nerves in NPC are the maxillary and mandibular nerves. Perineural infiltration may lead to retrograde spread to the cavernous sinus, Meckel’s cave and the trigeminal nerve. MRI is far more sensitive than CT in detecting perineural tumor spread. It is clear that MRI may upstage many tumors staged with CT. This may introduce potential problems when comparing the results of treatment outcome.
Cervical lymphadenopathy is better studied with CT especially for nodal necrosis and extracapsular
a 
 b
b
Fig. 8.12a,b. NPC with clivus involvement. a Axial CT (bone window) shows unremarkable appearances in clivus. No erosion seen in the clivus. b Axial T1-weighted MR image shows infiltration (white arrow) replacing high signal intensity marrow in the clivus. Note intermediate signal intensity NPC involving the left petrous apex

Neoplasms of the Nasopharynx |
155 |
spread. Although much has been written on the superiority of CT over MRI in the assessment of nodal metastasis, both modalities are adequate in routine clinical practice. It is uncommon for CT to provide additional information over MRI resulting in a change of treatment strategy.
MRI is, however, the recommended modality in the assessment of recurrence. Although MRI has limitations in separating post radiation fibrosis from tumor recurrence, it is superior to CT in identifying submucosal infiltration, skull base marrow replacement and intracranial spread (Chong and Fan 1997).
8.8
Imaging Strategies
Three groups of patients require imaging of the nasopharynx. The first group presents with cervical lymphadenopathy but without endoscopic evidence of a nasopharyngeal lesion. The second group presents with a nasopharyngeal mass for radiologic evaluation or staging. The third group presents for post-treatment assessment for suspected treatment complications, tumor surveillance or mapping of tumor extent.
8.8.1
Occult Malignancy
NPC may show submucosal spread with normal or relatively normal endoscopic findings. These patients usually present clinically with metastatic cervical lymphadenopathy. Serologic studies may reveal elevated antibodies against EBV antigens. Radiologic evaluation for such patients is mandatory especially in populations with high frequencies of NPC. MRI should be performed as it is superior to CT in delineating submucosal abnormalities.
Residual nasopharyngeal lymphoid tissue may occasionally mimic neoplasms (Fig. 8.1). The adenoids decrease in volume with age but may persist as tags of tissue into adulthood. CT and T1-weighted MRI cannot separate lymphoid tissues from the underlying muscles with a high degree of confidence.However,T2weighted images show good contrast between the high signal intensity lymphoid tissue and the low signal intensity muscles. Lymphoid tissues enhance following gadolinium administration. They are located superficially and never penetrate the underlying muscle.
8.8.2 Staging
Most patients undergo imaging evaluation because of an endoscopically demonstrated nasopharyngeal mass. MRI is again the preferred imaging modality. As most current radiation therapy techniques utilize relatively large fields to cover potential areas of microscopic spread, CT staging is adequate for most patients. However, with the advent of 3D conformal radiation therapy and intensity modulated radiation therapy (IMRT), MRI should be used for more accurate tumor mapping.
The increasing use of MRI in tumor staging has given rise to problems related to tumor staging and treatment planning. The basic issue to be resolved is the significance of skull base marrow changes seen on MRI. If these changes are considered tumor involvement, then MRI will upstage a certain number of patients. In clinical practice, skull base with marrow changes (detected by MRI) are included within the radiation treatment field.
The detection of distant metastasis alters prognosis and treatment planning. Chest X-ray and abdominal (liver) ultrasound are performed as part of the overall staging procedure. If these examinations present diagnostic issues, chest or abdomen CT are ordered for further evaluation. Similarly, bone scans are only done if there is a clinical suspicion of osseous metastases. If neck adenopathies are present in nasopharyngeal cancer, also a FDG-PET scan, if available, may be considered to search for occult distant disease.
8.8.3
Follow-up Issues and Problems
The aims of post-treatment imaging include the early detection of recurrence and treatment complications. Follow up studies are important because they may lead to early treatment of recurrent disease, thereby decreasing morbidity and improving survival rates.
8.8.3.1
Tumor Recurrence
There is usually complete tumor resolution within 3 months following radiation therapy, otherwise, the patient is considered to have residual disease. Hence, designation of tumor recurrence rests on the documentation of a disease free period. The distinction between residual and recurrent disease is relevant because it affects not only treatment plans but also