


First messengers
Intracellular messengers
Second messengers formed as a result of the activation of receptors are discussed in subsequent chapters. They include cAMP, Ca2 , diacylglycerol, and the 3-phosphorylated inositol lipids. We shall see that many, indeed most, responses to stimulation of cell surface receptors are eventually mediated by
protein phosphorylation and dephosphorylation. These are the major devices by which the binding of ligand is converted into a cellular consequence. In general, these second messengers interact with a specific set of enzymes (kinases and phosphatases) either directly or indirectly, to phosphorylate or dephosphorylate target proteins at specific sites. With a few special exceptions, phosphorylations due to these second messengers occur on serine and threonine residues.
Binding of ligands to receptors
A hormone may elicit physiological effects at concentrations as low as 10 10 mol L 1 (10 10 6 1023 6 1013 molecules per litre). To get an idea of how many of these molecules an individual target cell might encounter, consider that a 12 m diameter cell occupies a volume of 10 12 l. This volume of extracellular fluid would contain only 60 molecules of hormone. In spite of the necessary high affinity, it is important to remember that the binding interaction is never covalent and is always reversible. Thus binding of hormone (H) to receptor (R) can be written:
H R HR
At equilibrium, the rates of the forward and backward reaction are equal (onrate off-rate) and by the law of mass action
kon[H][R] koff [HR]
where kon is the on-rate constant and koff is the off-rate constant, with units of L mol 1 s 1 and s 1, respectively. [H] and [R] represent the concentrations
of free (unbound) hormone and free (unoccupied) receptors. A high affinity interaction means that the predominant species is HR. That is, the equilibrium is to the right or the equilibrium constant K is large, where
K [HR] kon
[H][R] koff
and the rate constant kon is much greater than koff. The units of K are L mol 1 (i.e. reciprocal concentration). Instead of an equilibrium constant for
association, the expression above can be inverted:
KD |
[H][R] |
koff |
|
|
[HR] |
kon |
(Equation 2.1) |
The value of 60 molecules may be compared with the number of ions of electrolyte present in the same volume: 1.8 1011 (for isotonic saline). Furthermore, the same volume of intracellular water will contain about 1010 molecules of ATP (between 5 and 10 mmol L 1) and after hormonal stimulation, a cell might contain as many as 106 molecules of the second messenger cAMP.
29

Signal Transduction
KD is the dissociation constant and has units of concentration (mol l 1). It is also the concentration of hormone which, at equilibrium, causes 50% of the receptors to be occupied, i.e. [HR] [R].
Binding heterogeneity
One might imagine that all receptors are equal in terms of the effects that they generate. This is far from being the case. Binding site heterogeneity can be caused by the presence of receptor subtypes with different affinities or by receptors of
a single class undergoing regulated conformational transitions between high and low affinity states. Since such a process would be driven by intracellular mechanisms; it could be tested for by inhibiting the cells metabolically (preventing ATP synthesis/depleting intracellular ATP). An alternative approach would be to compare the hormone binding affinities of intact cells with their isolated plasma membranes. An experiment of this kind should reveal the extent to which either the affinity or the number of exposed receptor sites are regulated by cellular metabolic status, which again might be modulated by events set in train by the initial hormone-receptor interaction itself.
Measurement of binding affinity
To measure the binding parameters, the cells, or their membranes, are exposed to hormone that is radioactively labelled. After equilibration the bound and free hormone pools are separated, generally by centrifugation or filtration. The supernatant or filtrate contains the unbound material and the pellet or filtered material consists of cells or membranes bearing the bound hormone. These are briefly washed to remove residual and interstitial unbound hormone and then both samples are analysed for the presence
of the label. The range of concentrations over which binding occurs and becomes saturated can be determined by varying the hormone concentration and plotting a graph of bound against free hormone concentration. For the very simplest systems, in which there is only one binding site per receptor and no interactions between receptors that might modify the affinity of binding at unoccupied sites, we can derive an equation for the binding curve, as follows.
If the total concentration of receptors in the preparation is Rtot, then
[R] Rtot [HR]
Substituting [R] in Equation 2.1 gives the single site equilibrium binding equation:
[H] [HR] Rtot KD [H]
30
First messengers
Plotting [HR] against [H], we obtain a hyperbola (Figure 2.2a). As with most representations of data ranging over several orders of magnitude, it is generally more useful to plot the concentrations on a logarithmic scale. By extrapolating the graph to an infinite concentration of hormone, we may then determine the total receptor concentration in the system, [Rtot] (Figure 2.2b). In practice, binding data are analysed by non-linear regression using computer software that takes account of multiple binding sites and other complications, yielding values of Rtot and KD.
KD and EC50: receptor binding and functional consequences
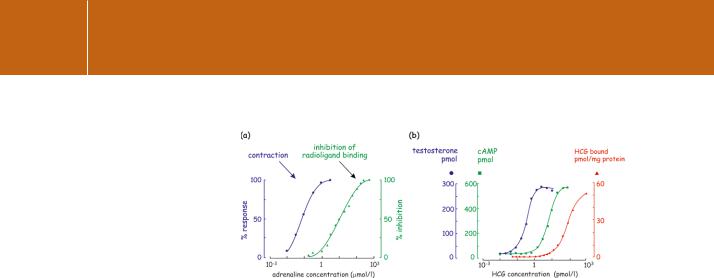
Having derived Rtot by extrapolation or curve-fitting and knowing the number of cells, we can calculate the number of binding sites per cell. We can also ask how the estimated KD relates to the likely hormone concentration in vivo and the biological responses that are evoked. More simply, is the magnitude of the tissue (or cell) response proportional to the fraction of occupied receptors? More often than not, there is no clear relationship.9 In many cases, the maximal cellular response – whatever it is that the cell does as a consequence of stimulation – is achieved with only a tiny fraction of the receptors being occupied (Figure 2.3a). We should therefore distinguish between KD and the EC50, the concentration of hormone at which the biological response or effect is half-maximal.
There are different ways of assessing a cellular response. An example is shown in Figure 2.3b in which an early response is estimated by measuring the generation of an intracellular second messenger (cAMP). Alternatively, more distal downstream events such as secretion or contraction might be measured. Curiously, we find that the EC50 for each type of response tends to be different. This is because KD is a parameter describing ligand binding at equilibrium, while EC50 reflects consequent events that may have multiple kinetic components determined by the rates of enzyme catalysed reactions that vary independently of receptor occupation. The concentration of a
Fig 2.2 Saturation binding. Direct binding curves plotted using (a) linear and (b) semi-logarithmic scales.
31
Signal Transduction
Fig 2.3 Receptor occupancy and cell response. (a) Correlation of adrenaline binding at 1-adrenergic receptors and contraction of smooth muscle (rat vas deferens). In this experiment, receptor occupancy was determined by measuring the displacement of a specific 1-antagonist, labelled with 125I. Contraction occurred at ligand concentrations that were too low to have a measurable effect in the binding assay. Adapted from Minneman
et al.10 (b) Correlation of hormone binding (gonadotropin), cAMP generation, and testosterone production from testicular Leydig cells. Note the 106-fold difference in affinity of the two hormone receptors. Adapted from Mendelson et al.11
hormone inducing a half-maximal response can be as much as two orders of magnitude (100-fold) smaller than the concentration required to saturate 50% of the receptors, as illustrated in Figure 2.3a. Similarly, maximal stimulation of glucose oxidation by adipocytes is achieved by insulin when only 2–3% of its receptors are occupied.
Spare receptors
The receptors that remain unoccupied have unfortunately been termed ‘spare receptors’,12 but this is not to suggest that their role is unimportant. This large apparent excess on most hormone-responsive cells helps to ensure that stimulation can occur at very low hormone concentrations. For example, imagine that an optimal cell response is only elicited when all of the available cell surface receptors are occupied. This condition could only be achieved
at infinite hormone concentration, because the binding follows a saturation relationship as depicted in Figure 2.2. Conversely, if the cell response is optimal when only a small proportion of receptors are occupied, then a concentration of hormone much lower than the KD will achieve this. The greater the receptor reserve, the lower the EC50 will be for a given level of occupancy. Figure 2.4 illustrates this.
The EC50 can be shifted by manipulations that alter the activity of the enzymes that take part in the stimulation pathway and that are well removed from events immediately set in train by the receptors. For instance, the
drug theophylline is an inhibitor of cyclic nucleotide phosphodiesterase, the enzyme that breaks down cAMP (Figure 2.5). Its effect is to augment the
32