

Вопрос 6 Origin of Speech Signals
The speech waveform is a sound pressure wave originating from controlled movementsof anatomical structures making up the human speech production
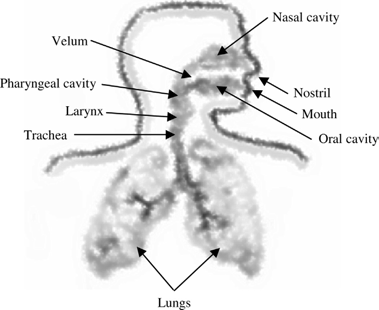
Figure 1.7 Diagram of the human speech production system.
system. A simplified structural view is shown in Figure 1.7. Speech is basically generated as an acoustic wave that is radiated from the nostrils and the mouth when air is expelled from the lungs with the resulting flow of air perturbed by the constrictions inside the body. It is useful to interpret speech production in terms of acoustic filtering. The three main cavities of the speech production system are nasal, oral, and pharyngeal forming the main acoustic filter. The filter is excited by the air from the lungs and is loaded at its main output by a radiation impedance associated with the lips.
The vocal tract refers to the pharyngeal and oral cavities grouped together. The nasal tract begins at the velum and ends at the nostrils of the nose. When the velum is lowered, the nasal tract is acoustically coupled to the vocal tract to produce the nasal sounds of speech.
The form and shape of the vocal and nasal tracts change continuously with time, creating an acoustic filter with time-varying frequency response. As air from the lungs travels through the tracts, the frequency spectrum is shaped by the frequency selectivity of these tracts. The resonance frequencies of the vocal tract tube are called formant frequencies or simply formants, which depend on the shape and dimensions of the vocal tract.
Inside the larynx is one of the most important components of the speech produc- tion system—the vocal cords. The location of the cords is at the height of the ‘‘Adam’s apple’’—the protrusion in the front of the neck for most adult males. Vocal cords are a pair of elastic bands of muscle and mucous membrane that open and close rapidly during speech production. The speed by which the cords open and close is unique for each individual and define the feature and personality of the particular voice.
Modeling the Speech Production System
In general terms, a model is a simplified representation of the real world. It is designed to help us better understand the world in which we live and, ultimately, duplicate many of the behaviors and characteristics of real-life phenomenon. However, it is incorrect to assume that the model and the real world that it repre- sents are identical in every way. In order for the model to be successful, it must be able to replicate partially or completely the behaviors of the particular object or fact that it intends to capture or simulate. The model may be a physical one (i.e., a model airplane) or it may be a mathematical one, such as a formula.
The human speech production system can be modeled using a rather simple structure: the lungs—generating the air or energy to excite the vocal tract—are represented by a white noise source. The acoustic path inside the body with all its components is associated with a time-varying filter. The concept is illustrated in Figure 1.9. This simple model is indeed the core structure of many speech coding algorithms, as can be seen later in this book. By using a system identification
White
noise
generator
Time-
varying
filter


 Lungs Trachea
Pharyngeal cavity Nasal cavity
Oral cavity Nostril Mouth
Figure 1.9 Correspondence between the human speech production system with a simplified system based on time-varying filter.
technique called linear prediction (Chapter 4), it is possible to estimate the para- meters of the time-varying filter from the observed signal.
The assumption of the model is that the energy distribution of the speech signal in frequency domain is totally due to the time-varying filter, with the lungs produ- cing an excitation signal having a flat-spectrum white noise. This model is rather efficient and many analytical tools have already been developed around the concept.
НЕ ВОПРОС. ВОзМОЖНО ПОПАДЁТСЯ СХЕМА!!!General Structure of a Speech Coder
Figure 1.12 shows the generic block diagrams of a speech encoder and decoder. For the encoder, the input speech is processed and analyzed so as to extract a number of parameters representing the frame under consideration. These parameters are encoded or quantized with the binary indices sent as the compressed bit-stream
Analysis
and
processing

speech


Extract
and
encode parameter
1
Index
1
Extract
and
encode parameter
2
ndex
2
Extract
and
encode parameter
N
Index
N
 I
I
Pack
Bit-stream
Unpack Index
1 Index
2 Index
N


Decode
parameter
1
Decode
parameter
2
Decode
parameter
N
Combine
and
processing speec


Figure 1.12 General structure of a speech coder. Top: Encoder. Bottom: Decoder.
(see Chapter 5 for concepts of quantization). As we can see, the indices are packed together to form the bit-stream; that is, they are placed according to certain prede- termined order and transmitted to the decoder.
The speech decoder unpacks the bit-stream, where the recovered binary indices are directed to the corresponding parameter decoder so as to obtain the quantized parameters. These decoded parameters are combined and processed to generate the synthetic speech.
Similar block diagrams as in Figure 1.12 will be encountered many times in later chapters. It is the responsibility of the algorithm designer to decide the functionality and features of the various processing, analysis, and quantization blocks. Their choices will determine the performance and characteristic of the speech coder.