

Narayanan V.K., Armstrong D.J. - Causal Mapping for Research in Information Technology (2005)(en)
.pdf40 Armstrong
concepts (constructs) that theory can be developed. Basic measures such as density and centrality may be used to develop theory. In a hypothesis testing context, the measures would need to be much more robust and cover many aspects of the map’s structure.
Reporting Results
While the standards in reporting CM results have not yet evolved, there are some key items that I have found reviewers will be looking for in your results. The first item is the sample design. Reviewers will want to know what sampling frame was used, was the sample population appropriate and was the sample adequate (point of redundancy). The second item that should be included is a discussion of the coding process. Reviewers will want to know what coding process was used as well as the reliability and validity of the process. One thing to keep in mind is that most IS reviewers are not yet familiar with the CM method. As with other research methods, you must prove that the research is well designed and rigorously undertaken. Similar to other qualitative methods, examples and quotes from the study are key to convincing the reviewer that what you report is an accurate (and rich) representation of the data. Over time, the need for clearly articulating the steps involved in CM research will diminish, but for now researchers may want you to include the steps provided in this chapter in an appendix to substantiate the CM process.
Summary of Key Decision Points
There are several issues discussed in this chapter that a researcher will want to consider when designing a CM study. There are nine key decision points that will be summarized here. See Table 10 for a listing of these decision points.
1.The first decision point is the selection of the research context (e.g., evocative, hypothesis testing). The research context should be selected based on the fit with the phenomenon under study and the research questions being addressed.
2.The second decision point is in the choice of data collection method (TBCM or IECM). This decision should be driven by which method is appropriate for the research question and the research context.
3.The third decision point is in the choice of which sampling method (e.g., random, snowball, exhaustive) to use. The sampling method should be chosen based on the data collection method (IECM versus TBCM) and in the IECM method also the sample (participants versus experts).
4.The fourth decision point is with regard to the reliability of the causal statement identification procedure. The level of agreement between the researchers should
Copyright © 2005, Idea Group Inc. Copying or distributing in print or electronic forms without written permission of Idea Group Inc. is prohibited.

Causal Mapping 41
be at least 0.75 to have an acceptable level of reliability. A reliability less than 0.75 indicates that the procedure is not robust enough for research purposes, and a modified identification procedure will need to be developed.
5.The fifth decision point is in the choice of coding scheme development method (benchmarking and theory-driven). This choice is primarily dependent on the research context of the study (discovery versus hypothesis testing).
6.The sixth decision point is with regard to validating the concepts. Once the coding scheme has been developed the concepts should be validated to ensure reliability of the scheme. The coding scheme approach (benchmarking or theory-driven) will determine the most appropriate method of validation.
7.The seventh decision point deals with the validation of the maps. The validation method is determined by the data collection method (IECM or TBCM). For IECMs one source of validation is a “member check,” whereas using TBCMs validation is often accomplished via triangulation with other sources.
8.The eighth decision point deals with representation. Causal maps may be represented via diagram or matrix. The only limitation on the choice of representation may be in complexity of the map. The more complex the map, the more difficult to represent and analyze via diagrammatic methods.
9.The last decision point deals with the analysis of the maps. When analyzing a causal map the researcher should address both the content and structural aspects of the map. Within the structural analysis there are many possible measures that can be utilized to operationalize the structural properties of the causal maps (e.g., centrality). The applicability of each measure is based on the research context used and research questions addressed.
Table 10. Key decision points
Decision Point |
|
Description |
Research Context |
|
The research context (e.g., evocative, hypothesis testing) should be selected |
|
|
based on the fit with the phenomenon under study and the research |
|
|
questions being addressed. |
Data Collection Method |
Choice of method (TBCM or IECM) is dependent on the research question |
|
|
|
and the research context. |
Choice of Sampling Method |
Choice of method (e.g., random, snowball, exhaustive) is dependent on data |
|
|
|
collection method and research context. |
Causal Statement Identification |
|
If reliability >= 0.80, then proceed with the study, if <= 0.80 the procedure |
Reliability |
|
will need to be modified. |
Coding Scheme |
Choice of method (benchmarking and theory-driven) is dependent on the |
|
|
|
research context of the study. |
Concept Validation |
The coding scheme approach (benchmarking or theory-driven) will |
|
|
|
determine the most appropriate method of validation. |
Map Validation |
|
The validation method is determined by the data collection method (IECM |
|
|
or TBCM). For IECMs a source of validation is a ‘member check’. For |
|
|
TBCMs a source of validation is via triangulation with other sources. |
Representation |
Causal maps may be represented in two main forms: via diagram or matrix. |
|
|
|
The choice of representation is only limited by the complexity of the maps. |
Analysis |
|
Many measures can be utilized to operationalize the structural properties of |
|
|
the causal maps (e.g., centrality). The applicability of each measure is based |
|
|
on the research context used. |
Copyright © 2005, Idea Group Inc. Copying or distributing in print or electronic forms without written permission of Idea Group Inc. is prohibited.

42 Armstrong
Conclusion
In this chapter I have explicated the CM process so that researchers and practitioners can utilize this method to address IS issues within organizations. While I have addressed the specific steps involved in the process there are issues that a researcher should be familiar with before engaging in CM research. As you have probably realized, the CM process is very labor intensive. Several software packages have been developed to aid the process (discussed in Chapter III), but there is still a significant amount of labor involved.
On the positive side, causal mapping is a versatile method on several fronts. As seen in this chapter, CM can be effectively used in several research contexts (discovery, evocative, hypotheses testing, and intervention). The CM method is also versatile with respect to the theories that can be used. With CM you can use multiple theories (lenses) to interpret the data collected (causal statements).
This chapter has detailed the process of conducting CM research. This book has a number of illustrations of how this method is employed. It is my hope that these techniques and examples will stimulate the use of causal mapping research within the IS field.
References
Axelrod, R. (Ed.) (1976). Structure of decision: The Cognitive Maps of Political Elites. Princeton, NJ: Princeton University Press.
Birnhaum-More, H., & Weiss, A.R. (1990). Discovering the basis of competition in 12 industries: Computerized content analysis of interview data from the US and Europe. In A. Huff (Ed.), Mapping strategic thought. London: John Wiley & Sons.
Bougon, M., Weick, K., & Binkhorst, D. (1977). Cognition in organizations: An analysis of the Utrecht jazz orchestra. Administrative Science Quarterly, 22(4), 606-639.
Bradburn, N.M. (1979). Improving interview method and questionnaire design. San Francisco: Jossey-Bass.
Carley, K., & Palmquist, M. (1992). Extracting, representing and analyzing mental models.
Social Forces, 70, 215-225.
Caroll, J.D., & Arabie, P. (1980). Multidimensional scaling. Annual Review of Psychology, 31, 607-649.
Eden, C., Ackerman, F., & Cropper, S. (1992). On the nature of cause maps. Journal of Management Studies, 18, 37-47.
Fahey, L., & Narayanan, V. K. (1989). Linking changes in revealed causal maps and environment: An empirical study. Journal of Management Studies. 26(4), 361-378.
Fiol, C. M., & Huff, A. S. (1992). Maps for managers: Where are we? Where do we go from here? Journal of Management Studies, 29, 267-285.
Copyright © 2005, Idea Group Inc. Copying or distributing in print or electronic forms without written permission of Idea Group Inc. is prohibited.
Causal Mapping 43
Fletcher, K.E., & Huff, A. (1990). Strategic argument mapping: A study of strategy. In A. Huff (Ed.), Mapping strategic thought. London: John Wiley & Sons.
Ford, J.D., & Hegarty, W. (1984). Decision maker’s beliefs about the causes and effects of structure: An exploratory study. Academy of Management Journal, 27(2), 271291.
Hong, E., & O’Neil, H.F. (1992). Instructional strategies to help learners build relevant mental models in inferential statistics. Journal of Educational Psychology, 84(2), 150-160.
Huff, A. (Ed.) (1990). Mapping strategic thought. New York: John Wiley & Sons.
Kemmerer, B., Buche, M., & Narayanan, V.K. (2001). Deriving revealed causal maps from non-traditional source documents: Challenges and methodological extensions,
Academy of Management Conference, Washington, DC, August 2001. Knoke, D., & Kuklinski. J.H. (1982). Network analysis. Newbury Park, CA: Sage.
Kvale, S. (1996). InterViews: An introduction to qualitative research interviewing. Newbury Park, CA: Sage.
Lincoln, Y. S., & Guba, E. G. (1985). Naturalistic Inquiry. Newbury Park, CA: Sage.
Mohammed, S., Klimoski, R., & Rentsch, J. (2001). The measurement of team mental models: We have no shared schema. Organizational Research Methods, 3, 123165.
Montazemi, A.R., & Conrath, D.W. (1986). The use of cognitive mapping for information requirements analysis. MIS Quarterly, 10(1), 45-57.
Nadkarni, S. (2003). Instructional methods and mental models of students: An empirical investigation. Academy of Management Learning and Education, 2(4), 335-351.
Nadkarni, S., & Narayanan, V.K. (2004). Validity of the structural measures of text-based causal maps: An empirical assessment. Organizational Research Methods (in press).
Narayanan, V.K., & Fahey, L. (1990). Evolution of revealed causal maps during decline: A case study of Admiral. In A. Huff (Ed.), Mapping strategic thought (pp. 109-133). London: John Wiley & Sons.
Nelson, K.M., Nadkarni, S., Narayanan, V.K., & Ghods, M. (2000). Understanding software operations support expertise: A causal mapping approach. MIS Quarterly, 24(3), 475-507.
Payne, S.L. (1951). The art of asking questions. Princeton, NJ: Princeton University Press.
Rubin, H.J., & Rubin, I.S. (2004). Qualitative interviewing: The art of hearing data.
Newbury Park, CA: Sage.
Schvaneveldt, R.W. (1990). Proximities, networks, and schemata. In R.W. Schvaneveldt (Ed.), Pathfinder associative networks: Studies in knowledge organization (pp. 135-148). Norwood, NJ: Ablex.
Shanteau, J. (1987). Psychological characteristics of expert decision makers. In J. L. Mumpower, O. Renn, L. D. Phillips, & V. R. Uppuluri (Eds.), Expert judgment and expert systems (pp. 289-304). Berlin: Springer-Verlag.
Copyright © 2005, Idea Group Inc. Copying or distributing in print or electronic forms without written permission of Idea Group Inc. is prohibited.

44 Armstrong
Shanteau, J. (1992). Competence in experts: The role of task characteristics. Organizational Behavior and Human Decision Processes, 53, 252-266.
Siegel, S. (1956). Nonparametric statistics for the behavioral sciences. New York: McGraw-Hill.
Stone, E. (1978). Research methods in organizational behavior. Glenview: Scott and Foresman.
Tan, F.B., & Hunter, M.G. (2002). The repertory grid technique: A method for the study of cognition in information systems. Management Information Systems Quarterly,
26(1),39-57.
Wrightson, M.T. (1976). The documentary coding method. In R. Axelrod (Ed.), Structure of decision: The cognitive maps of political elites (pp. 291-332). Princeton, NJ: Princeton University Press.
Endnotes
1Another approach that may be taken is to use group level mapping. If your text(s) capture a group situation (e.g., focus group) you could use the group as your level of analysis and develop a single map at the group level.
2Adapted from Wrightson (1976).
Appendix A: Coding Rules and Examples for Structural Relationships2
Linkage Codes
There are seven codes that can be applied to the linkages in a causal map. The codes and descriptions are provided.
Code Description
+Positive
-Negative
+Will not hurt, does not prevent, not harmful
-Will not help, does not promote, no benefit
A |
May or may not be related to |
|
|
M |
Effects in non-zero manner |
|
|
0 |
No effect, no relation to |
|
Copyright © 2005, Idea Group Inc. Copying or distributing in print or electronic forms without written permission of Idea Group Inc. is prohibited.

Causal Mapping 45
Structural Relationship Examples
1.Cause/Link/Effect
“If there was on-site daycare then it would be easier for me to do my job.”
On-site daycare /+/ Easier for me to do my job.
2.Cause/Link/Complex Effect
“It’s visual so the programming is easier and the logic is easier too.”
It’s visual /+/ programming is easier It’s visual /+/ logic is easier
3.Complex Cause/Link/Simple Effect
“If as a mother they know they have a place to take their children, they know they have a place for the kids to go after school, then I think there would be a lot less missed days.”
If as a mother they know they have a place to take their children /-/ missed days.
If as a mother they know they … for the kids to go after school /-/ missed days.
4.Either/Or Relationship
“Either I’m going to get that promotion or I am going to move to a dot com company to get the money I deserve.”
Get that promotion /+/ get the money I deserve.
Move to a dot com company /+/ get the money I deserve.
5.Probability
“Hiring a new CIO might help with the lack of promotions for women.”
Hiring a new CIO /+/ lack of promotions for women.
6.Inverted
“I’m just amazed because they are so into their children.”
They are so into their children /+/ I’m just amazed
7.Utility
“The trend toward outsourcing will sure help India.”
Outsourcing /+/ India
8.Complex Cause/Link/Complex Effect
“You have maintainability and robustness because you’re using OO and you have a good number of classes.”
Using OO /+/ Maintainability Using OO /+/ Robustness
Have a good number of classes /+/ Maintainability Have a good number of classes /+/ Robustness
Copyright © 2005, Idea Group Inc. Copying or distributing in print or electronic forms without written permission of Idea Group Inc. is prohibited.

46 Hodgkinson and Clarkson
Chapter III
What Have We Learned
from Almost 30 Years
of Research on
Causal Mapping?
Methodological Lessons and Choices
for the Information Systems and
Information Technology Communities
Gerard P. Hodgkinson
The University of Leeds, UK
Gail P. Clarkson
The University of Leeds, UK
Abstract
In this chapter we review major developments that have occurred over the past 30 years or so in the philosophical underpinnings, elicitation, analysis, aggregation and comparison of causal maps (also known as cause maps) across a wide range of domains of application in the fields of management and organization studies, in order to distill vital lessons concerning the strengths and weaknesses of various approaches for the information systems (IS) and information technology (IT) research communities. We offer some general guidelines to aid the would-be user in making methodological choices appropriate to particular contexts of application. The importance of attending to measurement issues in respect to reliability and validity at all stages of the research
Copyright © 2005, Idea Group Inc. Copying or distributing in print or electronic forms without written permission of Idea Group Inc. is prohibited.

30 Years of Research on Causal Mapping 47
process, from initial data collection to final analysis and comparison, is highlighted and an accompanying appendix presents an overview of selected computer software systems supporting the full range of activities associated with causal mapping.
Introduction
The purpose of this chapter is to provide an overview of some of the key problems that researchers and policy makers using causal mapping techniques have wrestled with over the ensuing years, both in order to illustrate the range of choices confronting the wouldbe user of these techniques and to highlight the strengths and limitations of particular approaches. Despite the fact that causal and other forms of cognitive mapping techniques are generally more labor-intensive and time-consuming than other research methods, in recent years the emerging field of managerial and organizational cognition has developed dramatically (e.g., Eden & Spender, 1998; Hodgkinson & Thomas, 1997; Meindl, Stubbart & Porac, 1994; Narayanan & Kemmerer, 2001; Porac & Thomas, 1989), to the extent that its reach is now extending across virtually all of the major sub-fields of management and organization studies, including information technology-related applications (Nelson, Nadkarni, Narayanan & Ghods, 2000a; Swan, 1997). Researchers have employed a rich variety of methods in an attempt to gain insights into actors’ belief systems, ranging from the relatively simple process of having participants list basic concepts (de Chernatony, Daniels & Johnson, 1993; Gripsrud & Gronhaug, 1985) to more sophisticated procedures such as the development and multivariate analysis of questionnaire items (Fombrun & Zajac, 1987) and repertory grid and related multidimensional scaling and related clustering techniques (Daniels, de Chernatony & Johnson, 1995; Daniels, Johnson & de Chernatony, 2002; Fournier, 1996; Ginsberg, 1989; Hodgkinson, 1997a; Hodgkinson, Padmore & Tomes, 1991; Hodgkinson, Tomes & Padmore, 1996; Reger & Huff, 1993). Fortunately, a number of comprehensive reviews of the many diverse methods for accessing thinking in organizational settings have been published elsewhere (e.g., Fiol & Huff, 1992; Hodgkinson, 2001; Hodgkinson & Sparrow, 2002; Huff, 1990; Jenkins, 1998; Lant & Shapira, 2001; Mohammed, Klimoski & Rentsch, 2000; J. Sparrow, 1998; Walsh, 1995).
In this chapter we shall confine our attention to a consideration of one particular class of cognitive mapping techniques — causal mapping — that has risen in popularity in research domains as diverse as strategic management (e.g., Fahey & Narayanan, 1989; Hodgkinson, Bown, Maule, Glaister & Pearman, 1999; Hodgkinson & Maule, 2002; Maule, Hodgkinson & Bown, 2003; Narayanan & Fahey, 1990), human resource management (Budhwar, 2000; Budhwar & Sparrow, 2002), and technological innovation (Swan, 1995; Swan & Newell, 1998). In the words of Huff (1990, p.16):
“Causal maps allow the map maker to focus on action — for example, how the respondent explains the current situation in terms of previous events, and what changes he or she expects in the future.”
Copyright © 2005, Idea Group Inc. Copying or distributing in print or electronic forms without written permission of Idea Group Inc. is prohibited.
48 Hodgkinson and Clarkson
It is the direct links to action implicit within this approach that make it such a powerful method, applicable across a wide range of contexts. However, as noted in this volume by Narayanan (2005), causal mapping techniques have been much under-utilized within the inter-related domains of information systems (IS) and information technology (IT). This is highly surprising, given the obvious parallels with general systems theory and the potential of these techniques to shed light on systems-designers’ and users’ understanding of a range of hardware and software capabilities and limitations (cf., Nelson et al., 2000a), thereby extending the repertoire of cognitive engineering tools and techniques available for use in these domains (Schraagen, Chipman & Shalin, 2000; Seamster, Redding & Kaempf, 1997). However, if this potential is to be realized, it is vital that important methodological insights already gained in the context of other domains, where causal mapping techniques have enjoyed widespread prominence, are brought to bear in the context of IS and IT applications. Since Axelrod (1976) produced his classic book that introduced causal mapping to the field of policy analysis, a number of significant methodological issues have risen to the fore across a range of fields, which in turn has stimulated much thinking and further advances.
In this chapter we map out some of the key methodological choices confronting the would-be user of causal mapping techniques, drawing upon the wider body of research that has been conducted using these techniques in other domains, over almost a 30-year period, both in order to illuminate the nature of those choices and to accelerate progress in these new, inter-related focal areas of application, by distilling the very valuable lessons that have emerged from extensive prior usage in these other domains. In so doing, our purpose is to accomplish three principal aims: (1) to illustrate the range of methodological choices associated with causal mapping techniques; (2) to highlight the strengths and limitations of the particular approaches identified; and (3) to offer some general guidelines to aid the would-be user of these techniques. Our recommendations are not intended to be prescriptive, but to assist potential users of causal mapping techniques in making methodological choices that are appropriate in particular contexts of application.
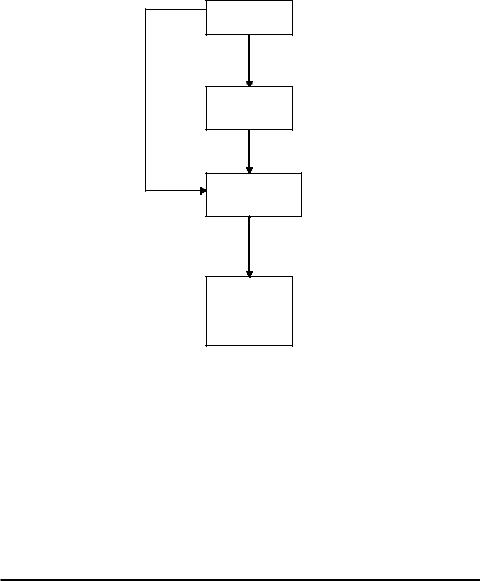
In Figure 1 we present a schematic overview of the principal stages involved in the causal mapping process, as discussed in this chapter. Undoubtedly, this representation oversimplifies the complex realities involved. (In practice, for example, the mapping process is often an iterative one, with feedback sought from participants during or soon after the construction and analysis stages.) Nevertheless, it serves as a useful framework to guide those new to the process of causal mapping and provides a clear overview of the organizing logic we have employed in structuring our chapter.
The chapter is organized in seven principal sections. Following this introduction, we alert the reader to ongoing philosophical debates concerning the ontological status of causal maps (also known as cause maps), outlining our own position in respect of these. In the third section, we identify a number of issues concerning knowledge elicitation that researchers need to address if they are to make well-informed mapping choices and we highlight a number of strengths and limitations associated with particular approaches. Next, we turn our attention to basic metrics for the analysis of individual cause maps. In the fifth section we discuss issues associated with the aggregation and comparative analysis of causal maps, while in section six we consider some measurement issues which
Copyright © 2005, Idea Group Inc. Copying or distributing in print or electronic forms without written permission of Idea Group Inc. is prohibited.
30 Years of Research on Causal Mapping 49
Figure 1. Schematic overview of the principal stages of the causal mapping process, as reviewed in the chapter
Knowledge
elicitation
Construction of cause maps
Analysis of cause maps
Aggregation and/or comparison of cause maps
are fundamental to the entire mapping process. Finally, we draw together our key recommendations and overall conclusions. In an accompanying appendix we provide a brief overview of some of the available computer software systems for supporting users throughout the various stages of the mapping process, from data collection/elicitation to analysis and comparison.
Philosophical Preamble
It is important to note at the outset that there is a wide spectrum of views concerning the ontological status of causal maps (and cognitive maps more generally). In this section we outline some of the main perspectives and clarify our own position.
In their attempts to capture information systems expertise, Nelson, Nelson and Armstrong (2000b, p.1) point out that it is not possible to literally “open the expert’s head” and extract
Copyright © 2005, Idea Group Inc. Copying or distributing in print or electronic forms without written permission of Idea Group Inc. is prohibited.