

Narayanan V.K., Armstrong D.J. - Causal Mapping for Research in Information Technology (2005)(en)
.pdf180Armstrong and Narayanan
theoretical framework. Each developer performed a card sort for each of the three theoretical frameworks. Based on the results of the card sort, we chose theoretical
Framework III.
3.Third, we employ the interpretive framework to engage an alternate methodology (survey) for empirical validation. We developed and validated an instrument from the concepts that emerged from the interviews. The validated instrument was then given to a large sample of software developers. Factor analysis identified five factors that explain the pattern of correlations within the data.
4.Finally, we attempt a rapprochement of the tensions between theoretical and applicative cycles through a system of bootstrapping: We use the empirical evidence to recast the interpretive framework to contrast the outputs of theoretical and applicative cycles. The factor structure is used as another framework (Framework IV) to interpret the interview data. Each causal statement is re-coded using Framework IV, and an additional causal map is produced. The two maps, one using Framework III and the other using Framework IV are then contrasted.
Method
Using the four-stage process detailed above, we conducted two interlinked studies (Armstrong 2001): Study I, incorporating stages 1 and 2 of the validation process (see Figure (1b)), used interview data gathered from expert developers to elicit Revealed Casual Maps (RCMs). Study II gathered survey data from a large sample of software developers to unearth the empirical structure of the raw concepts from interviews and to reconstruct the RCMs through bootstrapping, stages 3 and 4 of the validation process (see Figure 1(b)).
Study I: Revealed Causal Mapping
To represent the knowledge structures of OO software development experts, we followed the causal mapping procedure detailed in Chapter II.
•Data source. For this study, the data source was domain experts and the narratives were gathered through semi-structured, open-ended interviews. To accomplish this task, expert OO software developers were identified using a snowball technique (Shanteau, 1987, 1992) and convenience sample (Stone, 1978).
•Sample. The participants in the study were expert OO software developers, as acknowledged by their peers. Organizations were selected based on their identification of available “expert software developers” and their willingness to participate. Over 15 organizations of various sizes (15-10,000 employees) and industries (e.g., telecommunications, manufacturing, consulting, and services) provided access to their software developers. In Table 3, we summarize the key characteristics of the respondents.
Copyright © 2005, Idea Group Inc. Copying or distributing in print or electronic forms without written permission of Idea Group Inc. is prohibited.

Juxtaposing Causal Mapping and Survey Techniques 181
Table 3 — Study I. OO interview demographic, N=24
Demographic |
Mean |
SD |
Age |
39.29 |
7.35 |
Gender (% male) |
96.3% |
- |
Years in IT |
15.42 |
6.61 |
Years with current organization |
3.35 |
2.91 |
Years of procedural experience |
10.40 |
5.27 |
Number of procedural projects participated in |
20.5 |
16.73 |
Years of object-oriented experience |
4.73 |
1.54 |
Number of object-oriented projects participated in |
6.79 |
9.46 |
Table 3 — Study II. Survey demographic, N= 142
Demographic |
Mean |
SD |
|
|
|
Age (1 < 21, 2 = 21-30, 3=31-40, 4=41-50, 5=51-60, 6 > 60) |
3.77 |
.870 |
Gender (% male) |
85.9% |
- |
Years in IT |
19.98 |
8.90 |
Years with current organization |
10.89 |
8.63 |
Years of procedural experience |
16.52 |
7.76 |
Number of procedural projects participated in |
32.01 |
34.86 |
Years of object-oriented experience |
3.46 |
3.07 |
Number of object-oriented projects participated in |
2.91 |
2.61 |
•Interviews. The interview process consisted of open-ended interviews with probes (Rossi, Wright & Anderson, 1983). An interview guide was adapted from Nelson, Armstrong and Ghods (2002) to facilitate the interview process (see the Appendix for the Interview Guide). During the interviews respondents were asked questions regarding how they think about software development. Based on the respondent’s answer to the question, follow-up probes were asked to elicit further details regarding their software development thought process. Each interview lasted from 30 to 90 minutes. The range of interview lengths occurred because the interviewer did not constrain the responses to the questions. The interviews were tape recorded and later transcribed into a document format ranging from four to 14 pages.
Prior to commencement, we estimated the number of interviews necessary to reach redundancy or saturation of concepts at 25. The point of redundancy was reached at 15 participants eliciting a total of 19 concepts. The point of redundancy suggested that the achieved sample of 24 respondents was more than sufficient to capture all of the relevant concepts in the sample.
Deriving Revealed Causal Maps
The causal mapping process used for this study is consistent with the steps provided in Chapter II. We have expanded on those issues not previously addressed or unique to this study.
Copyright © 2005, Idea Group Inc. Copying or distributing in print or electronic forms without written permission of Idea Group Inc. is prohibited.
182 Armstrong and Narayanan
•Step 1: Identify Causal Statements. Due to the cognitive nature of this study it was determined that in addition to explicit causal statements, implicit causal statements should also be recorded. To establish the reliability of the identification procedure, interview texts were coded by the researchers and one of two additional raters. The raters were deemed appropriate to identify the causal statements because of their familiarity with the technique, the domain under study, and they were not participants in any portion of the study. There were two rounds of coding that covered six OO interview texts chosen at random from the interviews. The reliability between the researchers was calculated by measuring the level of agreement on terms and linkages. The level of agreement between the researchers averaged 0.80, suggesting an acceptable level of reliability.
•Step 2: Construct Raw Causal Maps. In the second step, the causal statements identified in the first step were separated into “causes” and “effects” to construct the “raw causal maps.”
•Step 3: Develop Coding Scheme. The relevant concepts were identified from the statements. A software development expert reviewed the statements and independently placed them into conceptual categories. The level of agreement between the researcher(s) and rater averaged 0.87 and a total of 19 OO concepts were identified. Once the conceptual level scheme was developed, the statements were placed into the appropriate concepts.
Tying emergent concepts to established literature has been recommended to develop categories that are distinct and uniform in breadth and level of abstraction (Carley & Palmquist, 1992; Fahey & Narayanan, 1989; Priem, 1994). To do this, we assessed the degree of congruence of the three theoretical frameworks identified in the literature review to the evoked concepts.
Three object-oriented software development experts were asked to assess the congruence of the emergent concepts with each theoretical framework. The developers were provided the constructs from each theoretical framework (see Table 2) and a set of index cards containing each of the 19 concepts, with a definition of the concept provided on the back of the card for their reference. Each developer performed a card sort according to each of the three theoretical frameworks. The card sort was conducted using a different framework order for each developer. The average level of agreement among the developers was 0.52 for Framework I, 0.33 for Framework II, and 0.70 for Framework III. Based on the results of the card sort, we chose theoretical Framework III as the appropriate construct level classification scheme. The correspondence between the 19 evoked concepts and constructs is presented in Table 4.
•Step 4: Recast the “raw” maps into Revealed Causal Maps. Once the classification scheme was completed, the causal statements for each respondent were placed into the appropriate concept and construct level categories. The result is a concept and construct level RCM for each respondent. The individual maps are then aggregated (Axelrod, 1976; Bougon, Weick & Binkhorst, 1977; Nadkarni & Nah, 2003) into one overall map.
Copyright © 2005, Idea Group Inc. Copying or distributing in print or electronic forms without written permission of Idea Group Inc. is prohibited.

Juxtaposing Causal Mapping and Survey Techniques 183
Table 4. Construct and concept detail for theoretical Framework III
Construct |
Concept |
Structure |
Abstraction |
|
|
|
Attribute |
|
Class |
|
Encapsulation |
|
Information Hiding |
|
Inheritance |
|
Instantiation |
|
Object |
Behavior |
Collaboration |
|
|
|
Message Passing |
|
Method |
|
Polymorphism |
|
Relationship |
OO Modeling/Analysis |
Identifying Objects |
|
|
|
Noun-Verb Analysis |
|
Object Model |
OO Development Concepts |
Patterns |
|
|
|
Layer |
|
OO Development |
•Step 5: Create Measures for the Maps. The analysis of the maps in this study was based on past research in causal mapping (Bougon et al., 1977; Ford & Hegarty, 1984: Huff, 1990; Narayanan & Fahey, 1990; Nelson et al., 2000). The measures used are borrowed from the social network analysis field (Knoke & Kuklinski, 1982) and include the adjacency and reachability matrices, centrality and density measures (see Chapter II for a detailed discussion of the measures).
Study II: Survey
•Data source. We developed an instrument to capture the concepts emerging from the interviews. As a starting point, five statements per concept were selected for inclusion in the instrument based on content and clarity. Internal validity and construct validity were addressed through a pretest sort (Anderson & Gerbing, 1991). Based on the results of the pretest sort statements were re-worded or deleted. The pilot instrument was developed from the remaining list of statements. The pilot instrument was given to 31 software developers. We assessed scale internal consistency reliability using Cronbach’s alpha (Huck, 2000). Correlations between variables were analyzed, and questions were deleted or re-worded for clarity. The final instrument covered 19 object-oriented concepts5.
Copyright © 2005, Idea Group Inc. Copying or distributing in print or electronic forms without written permission of Idea Group Inc. is prohibited.
184 Armstrong and Narayanan
•Sample. The validated instrument was then given to a large sample of software developers. The sample was drawn from organizations selected based on their identification of available “software developers” and their willingness to participate. Thirty-three organizations of diverse industries (e.g., telecommunications, manufacturing, aerospace and financial services) provided access to their software developers. Study respondents were chosen based on a key-informant method (Bagozzi, Yi & Phillips, 1991; Seidler, 1974). Participants in this phase of the study were different than the respondents used in the previous phase of the project. A total of 177 responses were originally recorded with 35 being eliminated due to lack of software development experience, duplicate responses, or other problems with the data, leaving a sample of 142 respondents. A profile of the Study II (survey) sample is presented in Table 3.
•Factor analysis. We used an exploratory principal components factor analysis with varimax rotation to reduce the variables to a usable set of constructs for the OO software development expertise framework. Past research has provided guidelines for the minimum sample size needed to conduct factor analysis. Some have suggested the ratio of sample size to number of variables as a criterion: the recommendations range from 2:1 to 20:1 (e.g., Bryant & Yarnold, 1995). Others have suggested using a minimum sample size as the criterion. For example, Lawley and
Table 5. Factor analysis for Framework IV
Construct |
Alpha |
Concept |
Nesting |
0.806 |
Inheritance |
|
|
|
|
|
OO Development |
|
|
Polymorphism |
Object Characteristics |
0.918 |
Attributes |
|
|
|
|
|
Class |
|
|
Encapsulation |
|
|
Instantiation |
|
|
Method |
Behavior II |
0.818 |
Collaboration |
|
|
|
|
|
Message Passing |
|
|
Relationship |
OO Modeling/Analysis II |
0.872 |
Identifying Objects |
|
|
|
|
|
Noun-Verb Analysis |
|
|
Object |
OO Development Concepts II |
0.883 |
Abstraction |
|
|
|
|
|
Patterns |
|
|
Information Hiding |
|
|
Layer |
|
|
Object Model |
Copyright © 2005, Idea Group Inc. Copying or distributing in print or electronic forms without written permission of Idea Group Inc. is prohibited.

Juxtaposing Causal Mapping and Survey Techniques 185
Maxwell (1971) suggest that there should be 51 more cases than the number of variables. In their 1988 study, Guadagnoli and Velicer found that absolute sample size was more important than functions of sample size in determining stable solutions and recommend 100 to 200 observations. Our sample of 142 respondents fell within the acceptable range for the analysis. The number of respondents represents a sufficient sample to perform principal components analysis.
The resulting factor structure is summarized in Table 5, with the associated Cronbach’s alpha reliability scores. As shown in the table, the object-oriented concepts loaded on five factors that we named Nesting, Object Characteristics, Behavior II2, OO Modeling/ Analysis II, and OO Development Concepts II, using an eigen value >1.00 criterion. Cumulatively, the factors accounted for 71% of variance in the sample. The Nesting construct (a = 0.81) dealt with managing the complexity in the object-oriented mindset (e.g., inheritance, polymorphism). Similarly, the Object Characteristics construct (a = 0.92) dealt with the packages that the basic concepts are put into (e.g., class, instantiation), thus focusing on the development and functioning of an object. The Behavior II construct (a = 0.82) consisted of the communication and relationships between sets of objects (e.g., collaboration, message passing). The OO Modeling/Analysis II construct (a = 0.87) consists of concepts that are the fundamental techniques for object-oriented analysis (e.g., object, identifying things as objects). Finally, OO Development Concepts II (a = 0.88) focused on how objects function within the larger system to make up an object-oriented application (e.g., abstraction, layer), i.e., finding, modifying, and assembling the classes and methods needed to support an entire application.
Results and Discussion
We present the results in three steps. First, we present the constructs revealed in the interviews that are central to understanding OO software development expertise, highlighting the characteristics of the revealed linkages between constructs in the aggregate RCMs. Second, we summarize the results of the recasting of RCMs based on classification suggested by the factor analysis of survey responses. Third, we provide an assessment of the congruence between the original and the reconstructed RCMs.
Study I: Revealed Causal Maps
The aggregate level RCMs from the interview data represented OO software development expertise as being constituted by four major constructs: Structure, Behavior, OO Modeling/Analysis, and OO Development Concepts and is shown in Figure 2(a). The overall density of the map is 1.75, indicating a relatively high interconnectedness. As shown in Table 4, eight concepts comprise the Structure construct, which has a centrality of 0.57, suggesting that it occupies a prominent role in OO software development. The Behavior construct contains five concepts and the centrality is 0.57 suggesting a
Copyright © 2005, Idea Group Inc. Copying or distributing in print or electronic forms without written permission of Idea Group Inc. is prohibited.
186 Armstrong and Narayanan
Figure 2(a). Aggregated construct level revealed causal map, interview data
prominent role in OO development. The OO Modeling/Analysis construct evoked in this study contains three concepts and has a centrality of 0.43 suggesting a slightly lesser role in OO software development. The fourth construct, OO Development contains three concepts related to overall OO development. The centrality of the construct is 0.43, suggesting a slightly lesser role in the OO approach. While the results are consistent with those found by Sheetz and Tegarden (2001), this is the first study that has found the importance of these additional concepts as components of OO. The data indicate that the structure and behavior of objects are equally central to OO development, with modeling and overall development slightly less central.
The reachability matrix of the aggregated construct level RCM is presented in Table 6. It reveals that experts see OO Modeling/Analysis as a cause construct (all arrows from the construct) and OO Development as an effect construct (all arrows into the construct). The Structure and Behavior constructs are both cause and effect constructs. The highest reachability occurs for the linkages in which OO Development Concepts is the effect construct.
Study II: Reconstructed RCMs
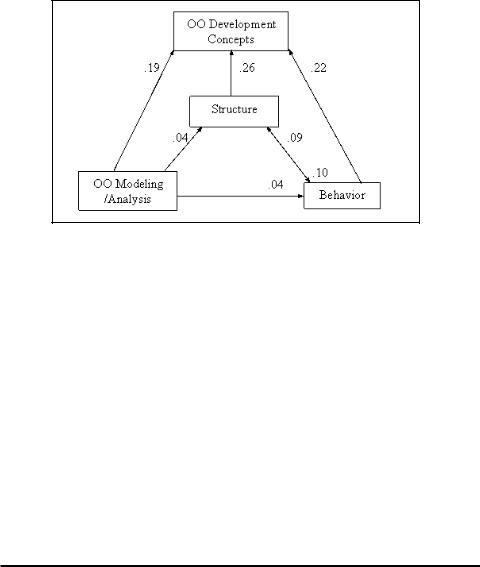
Recall that the factor analysis of the survey data yielded five factors: Nesting, Object Characteristics, Behavior II, OO Modeling/Analysis II, and OO Development Concepts II. The reconstructed map can be seen in Figure 2(b). The density of the overall map is 1.80. The centrality of the five constructs varied from a low of 0.11 (OO Development Concepts II), 0.33 (Object Characteristics), to 0.44 (Behavior II) to a high of 0.56 (OO Modeling/Analysis II, and Nesting). Table 6 also presents the reachability matrix for the reconstructed (aggregated construct level) RCM based on the survey data. The aggregated RCM of the OO software developers reveals that developers learning OO tech-
Copyright © 2005, Idea Group Inc. Copying or distributing in print or electronic forms without written permission of Idea Group Inc. is prohibited.

Juxtaposing Causal Mapping and Survey Techniques 187
Figure 2(b). Data aggregated construct level reveal causal map
Table 63. Reachability matrices for aggregated construct level RCM
Interview |
A |
B |
|
C |
D |
A. Structure |
|
0.104 |
|
- |
0.260 |
B. Behavior |
0.094 |
|
|
- |
0.219 |
C. OO Modeling/Analysis I |
0.042 |
0.042 |
|
|
0.188 |
D. OO Development Concepts 1 |
- |
- |
|
- |
|
Survey |
A1 |
A2 |
B |
C |
D |
A1. Nesting |
|
- |
- |
0.025 |
- |
A2. Object Characteristics |
0.047 |
|
- |
- |
- |
B. Behavior II |
0.074 |
0.036 |
|
0.045 |
- |
C. OO Modeling/Analysis II |
0.098 |
0.045 |
0.031 |
|
- |
D. OO Development Concepts II |
0.029 |
- |
- |
- |
|
Copyright © 2005, Idea Group Inc. Copying or distributing in print or electronic forms without written permission of Idea Group Inc. is prohibited.
188 Armstrong and Narayanan
niques (with the exception of OO Development Concepts II being a cause construct) do not see clear cause and effect constructs within the OO software development approach. The reachability values between the constructs were fairly consistent (mean .05), with the linkages into the Nesting construct (effect) slightly stronger.
A Comparative Analysis of Revealed and Reconstructed
RCMs
There are similarities and differences between the cognitive structures that constitute OO software development expertise yielded by revealed and reconstructed RCMs. See Table 7 for comparison of the concepts and constructs. From the demographics of the two samples we can see that the respondents for the interview data had about one additional year of OO experience, but had completed twice the number of OO projects as the respondents for the survey data. Based on the differences in experience, the difference between the interview (expert) cognitions and the survey cognitions should be quite large. When comparing the OO interview RCMs to the survey RCMs there should be differences because the respondents are at different places in the learning process.
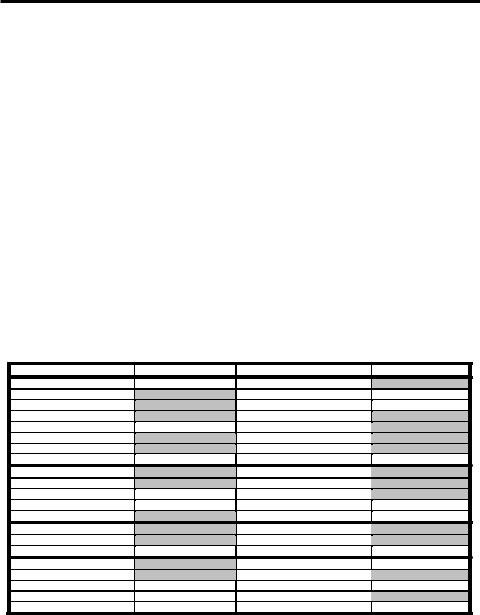
Recall that the factor analysis yielded five constructs, one more than the theoretical framework that best fit the evoked concepts. As shown in Table 7, there was significant overlap between the Behavior, OO Modeling/Analysis, and OO Development Concepts constructs across the two methods. The survey responses separated into two constructs (Object Characteristics and Nesting) what the best fitting theoretical framework combined into one (Structure). This is consistent with general theories of expertise on
Table 7.4 Comparision of Study I versus Study II concepts and constructs
Study I Construct |
Study I Concepts |
Study II Constructs |
Study II Concepts |
Structure |
Abstraction |
Nesting |
Inheritance |
|
Attribute |
|
OO Development |
|
Class |
|
Polymorphism |
|
Encapsulation |
Object Characteristics |
Attribute |
|
Information Hiding |
|
Class |
|
Inheritance |
|
Encapsulation |
|
Instantiation |
|
Instantiation |
|
Object |
|
Method |
Behavior |
Collaboration |
Behavior II |
Collaboration |
|
Message Passing |
|
Message Passing |
|
Method |
|
Relationship |
|
Polymorphism |
|
|
|
Relationship |
|
|
OO Modeling / Analysis |
Identifying Objects |
OO Modeling / Analysis II |
Identifying Objects |
|
Noun-Verb Analysis |
|
Noun-Verb Analysis |
|
Object Model |
|
Object |
OO Development Concepts |
Patterns |
OO Development Concepts II |
Abstraction |
|
Layer |
|
Patterns |
|
OO Development |
|
Information Hiding |
|
|
|
Layer |
|
|
|
Object Model |
Copyright © 2005, Idea Group Inc. Copying or distributing in print or electronic forms without written permission of Idea Group Inc. is prohibited.

Juxtaposing Causal Mapping and Survey Techniques 189
software development that asserts that as developers gain expertise they create larger chunks of information with more abstract representations (e.g., Adelson, 1981; McKeithen, Reitman, Rueter & Hirtle, 1981; Murphy & Wright, 1984; Pennington, 1987).
In addition to the basic structure of the maps there are several similarities and differences in the linkages of the maps. As shown in Table 6, the reachabilitiy matrices demonstrate that there is a common linkage from the Behavior construct to the Structure (Nesting and Object Characteristics) constructs. In addition, the OO Modeling/Analysis construct has two linkages in common across the maps, with the Structure (Nesting and Object Characteristics) and Behavior constructs. The centrality measures highlight some differences in the maps. The interview data indicated two layers of centrality, with layer one including the Structure and Behavior constructs, and layer two including the OO Modeling and OO Development constructs. This indicates a relatively flat cognitive structure. In contrast, the survey data indicated three layers, with layer one including the OO Development construct, layer two including the Behavior and Object Characteristics constructs, and layer three including the Nesting and OO Modeling constructs. In addition to more layers, the survey data map had a wider range of centrality scores than the interview data map. This indicates a more hierarchical and complex cognitive structure in which some concepts are more central and others more ancillary to the domain.
The reachability measure provides another mechanism for comparison. In the interview data map the OO Development construct has by far the highest reachability with a large variance among the reachability values. In contrast, in the survey data map the reachability values have a much smaller range with the Nesting construct having the highest reachability. Thus while the content of the maps is quite similar, the main difference in the two maps is in the linkages.
Discussion
Before discussing our results, we should place them in context, noting that OO development techniques have only come into vogue in recent years. This low level of maturity has three correlates: lack of theoretical parsimony, standardization and professionalization. As a field matures, developments are likely to result in parsimonious theory and consequently fewer clearly articulated concepts. This makes possible standardization of approaches, very much akin to the emergence of technical standards. In turn this allows transmission of explicit knowledge thus facilitating professionalization of practitioners. In our search for an adequate theoretical scheme to categorize the evoked concepts in OO, we found a variety of frameworks. Even the best fitting framework could embrace only slightly over half the evoked concepts. The tacit knowledge of the experts seems to be more extensive than represented by the available theoretical frameworks. Clearly, theoretical development in OO software development is far from complete.
Under these conditions, evocative approaches such as RCM appear not merely to be an adornment, but a necessity in research to capture the “true” phenomena under investigation. Against the backdrop of the lack of consensus among theoretical frameworks
Copyright © 2005, Idea Group Inc. Copying or distributing in print or electronic forms without written permission of Idea Group Inc. is prohibited.