

Narayanan V.K., Armstrong D.J. - Causal Mapping for Research in Information Technology (2005)(en)
.pdf150 Vo, Poole and Courtney
The Aggregate method. The subjects took turns: i) introducing a factor with a brief description if needed (determined by other members); ii) a member in charge wrote down this factor on a sheet and asked other members whether they agreed to include this factor in the group map; iii) the group then decided whether the factor should be included (if all members agreed, the factor was entered into the group map; if a majority did not favor it the factor was left out; if there were mixed opinions, the factor was marked on the group map with a different color for a second round of discussion); and iv) the process was repeated until all new factors were exhausted. During the factor entry process, relationships were entered into the group map in a similar manner. At the end, the groups were asked to revise their maps by discussing the marked elements. These elements remained in the group maps if group members agreed (including if they agreed that these elements were relevant from other perspectives that they had no knowledge about). Otherwise, the marked elements were left out. Groups were encouraged to add new information into the group map as a result of group discussion and interaction.
The Congregate method. The subjects took turns: i) introducing a causal loop with a brief description if needed (determined by other members); ii) a member in charge recorded this loop on a blackboard and asked other members whether they agreed this loop should be included in the group map; iii) the group then decided whether the loop should be included (if all members agreed, the loop was entered into the group map; if a majority did not favor it the loop was omitted; if there were mixed opinions, the loop was marked on the group map with a different color for a second round of discussion) and; iv) the process was repeated until no more loops were identified. During the loop entry process both factors and relationships were entered into the group map at the same time. At the end, the groups were asked to revise their map by discussing the marked loops or elements. These loops remained in the group maps if group members agreed (including if they agreed that these elements were relevant from other perspectives that they had no knowledge about). Otherwise these loops were omitted. Groups were encouraged to form new loops in the group map as a result of group discussion and interaction.
The Workshop method. The subjects took turns describing the problem situation by identifying problem variables, consequence factors, and causal factors that affect the problem variables, and causal relationships between them. The facilitators recorded these factors/variables and their relationships on blackboards and asked other members whether they agreed to include these elements in the group map and agreed with the story being told. If members all agreed, these elements were put on the group map. If a majority did not advocate inclusion, they were left out. If there were mixed opinions, they were marked with a different color for a second round of discussion. The process was repeated until element entries were exhausted. At the end, the groups were asked to revise their map by discussing the marked elements and considering reducing the number of zero in-degree and outdegree nodes. The agreed-upon elements remained in the group maps and elements on which there was disagreement were left out.
(4)Individual map update. After their group meeting, the subjects were asked to revise/update their individual maps (either on the questionnaire or on the diagram/
Copyright © 2005, Idea Group Inc. Copying or distributing in print or electronic forms without written permission of Idea Group Inc. is prohibited.
Collective Causal Mapping Approaches 151
map) to include any insights they had from the group meeting and from viewing the group map.
(5)Post experiment. The subjects were asked to give feedback on the experiment via a questionnaire. This questionnaire gathered information that was used to calculate the subjective measures to evaluate the collective causal maps, described below.
The treatments for this experiment were the three methods of deriving collective maps: aggregate mapping, congregate mapping, and workshop mapping. Subjects were selected from employees of HALONG who work in the sales, production, and accounting departments. They were randomly assigned to groups A, B, C and D. Groups A and B were assigned to the aggregate method, and groups C and D to the congregate method. Due to time restriction, sales reps were randomly assigned to groups E and F (the workshop method).
Measures
The collective maps were compared in terms of both objective measures and subjective measures. Objective measures consist of map complexity and distance ratios between collective models and individual models. These were calculated by the researchers based on comparison of the maps. Subjective measures were based on participants’ ratings. These included the degree to which the maps gave a full and accurate representation of the problem representation, the degree to which the maps suggested effective solutions to the problem, and the degree to which the map fairly represented different stakeholders’ views. These subjective attributes are based on a Multi-Attribute-Value (MAV) model developed for evaluating causal maps (Massey and O’Keefe, 1993; Massey and Wallace, 1996; Sakman, 1985). These responses were elicited from subjects with the questionnaire that was filled out in the final step of the study. Indices calculated from these responses were used as criteria to measure the effectiveness or utilities of the derived collective maps. Because the two studies used quite different samples and addressed different problems, the questionnaires and procedures for administering them differed, and details of this are given in the description of Study 2.
To analyze the results of Study 1, we used ANOVA, nesting subjects within groups to evaluate the impact of grouping and the impact of the method used on the effectiveness of the composite map in understanding the problem at the individual level. At the group level we were not able to employ statistical tests, but looked for patterns in results.
Table 3. Grouping and treatments
Treatments |
Aggregate method |
Congregate method |
Workshop method |
Grouping |
Group A (5 subjects) |
Group C (5 subjects) |
Group E (5 subjects) |
|
Group B (5 subjects) |
Group D (5 subjects) |
Group F (5 subjects) |
Copyright © 2005, Idea Group Inc. Copying or distributing in print or electronic forms without written permission of Idea Group Inc. is prohibited.

152 Vo, Poole and Courtney
Study 2
In Study 2, the objective was to construct a systems model of infrastructure for the city of Houston that represented the perspectives of a multidisciplinary research team. The research team, composed of engineers, environmental scientists, and social scientists, had been trying to build a decision support system for infrastructure decision making as part of a larger project. The team desired to build a systems model of infrastructure that reflected commonalities among their perspectives, a “best science” model of factors that influenced infrastructure growth and the positive and negative impacts that infrastructure growth had on the urban area .The basic approach taken was similar to Study 1: first build individual causal maps for the researchers, derive collective causal maps using different methods, and compare the methods in terms of which the researchers felt yielded best fit. The first step was to define a problem/issue. After consultation with members of the group, we framed the issue as: “The impact of infrastructure growth on quality of life of Houstonians.” The second step was to select participants. We had seven members, who were involved in developing a conceptual framework2 for the city’s infrastructure decision making system, participate in the experiment. The experiment consisted of two stages: individual causal mapping and building group maps.
We followed the same procedure as in Study 1 to capture individual causal maps. Individual maps provided the basis for building collective maps and also provided a standard of comparison for the final group maps. Participating in the individual stage provided the subjects with an opportunity to learn and become accustomed to the mapping method. Based on the interview transcripts3 and related literature (Forrester, 1969; Lee, 1995), we developed a list of 16 factors or constructs. The subjects were asked to select factors that are relevant to the problem of study and assess possible causal relationships between pair-wise selected factors. The purpose was to gather information that would enable us to draw a causal diagram that shows how the subjects believed infrastructure resource allocation affects the city. The process was assisted using a questionnaire (available from the authors).
After the individual maps were constructed, we applied the aggregate and congregate methods to build the aggregate and congregate maps based on the individual maps. Unlike Study 1, the subjects did not build the aggregate or congregate maps in groups. The experimenters constructed the maps. The subjects were then gathered in a workshop under the researcher’s facilitation to build the workshop map using a procedure similar to that described in Study 1. Following the completion of the workshop maps, subjects filled out a questionnaire similar to that utilized in Study 1.
Results of Study 1
In the actual implementation of the experiment, only 24 out of 30 planned subjects were able to participate in the experiment throughout the entire period of the study. (One participant was absent. Two persons left after the individual cognitive mapping because
Copyright © 2005, Idea Group Inc. Copying or distributing in print or electronic forms without written permission of Idea Group Inc. is prohibited.

Collective Causal Mapping Approaches 153
Table 4. Grouping and treatments
Treatments |
Aggregate method |
Congregate method |
Workshop method |
|
(M1) |
(M2) |
(M3) |
Grouping |
Group A (4 subjects) |
Group C (4 subjects) |
Group E (4 |
|
|
|
subjects) |
|
Group B (4 subjects) |
Group D (4 subjects) |
Group F (4 |
|
|
|
subjects) |
they developed “headaches.” Three other people left due to urgent duties). The outcomes of this experiment were six derived group maps (A, B, C, D, E, and F), which are provided in the Appendix. Each method of developing group maps was utilized for two groups. Information about treatments for these groups is provided in Table 4.
Objective Measures
A straightforward measure of map complexity is the number of links and nodes in the maps. Table 5 compares the total nodes (links) of group maps to the average number of nodes (links) in individual maps. An average individual map has ten nodes with a standard deviation of 2.6 nodes. The minimum number of nodes is four and the maximum number 15. Generally, the group maps have more nodes than the average individual maps, as indicated by the group/individual node ratio shown in Table 5. This observation is consistent across all groups. The use of the congregate method (groups C and D) tends to produce group maps that have relatively more nodes than average individual maps.
On average the individual maps have 15 links (minimum 8, maximum 22). The group maps have more links than the average individual maps, with the exception of group C, as indicated by the group/individual link ratios in Table 5. The use of the aggregate method
Table 5. Total number of nodes in individual and group maps
|
|
Groups |
|
|
|
|
|
|
|
A |
B |
C |
D |
E |
F |
Nodes |
Group |
11 |
11 |
11 |
11 |
15 |
11 |
Individual Average |
9.25 |
9.25 |
9.00 |
8.25 |
12.75 |
10.75 |
|
|
Individual Std. Dev. |
4.03 |
1.50 |
1.63 |
3.50 |
2.36 |
0.50 |
|
Group/Individual Ratio |
1.19 |
1.19 |
1.22 |
1.33 |
1.18 |
1.02 |
Links |
Group |
22 |
22 |
17 |
16 |
19 |
21 |
Individual Average |
11.5 |
12.75 |
17.75 |
11 |
18.5 |
16.25 |
|
|
Individual Std. Dev. |
2.08 |
2.22 |
5.32 |
4.08 |
4.73 |
2.50 |
|
Group/Individual Ratio |
1.91 |
1.73 |
0.96 |
1.45 |
1.03 |
1.29 |
Note: A and B use the aggregate method; C and D use the congregate method; E and F use the workshop method.
Copyright © 2005, Idea Group Inc. Copying or distributing in print or electronic forms without written permission of Idea Group Inc. is prohibited.

154 Vo, Poole and Courtney
Table 6. Links/nodes ratios
L/N ratios |
A |
B |
Avg |
C |
D |
Avg |
E |
F |
Avg |
|
(A & B) |
(C & D) |
(E & F) |
||||||||
|
|
|
|
|
|
|
||||
Group |
2.00 |
2.00 |
2.00 |
1.70 |
1.45 |
1.58 |
1.27 |
1.91 |
1.59 |
|
Individuals |
1.38 |
1.39 |
1.38 |
1.95 |
1.50 |
1.72 |
1.47 |
1.52 |
1.49 |
|
STD (ind.) |
0.28 |
0.10 |
0.20 |
0.43 |
0.44 |
0.47 |
0.27 |
0.25 |
0.24 |
Note: A and B use the aggregate method; C and D use the congregate method; E and F use the workshop method
(groups A and B) tends to produce the group maps with more links than the average individual maps.
From the link and node data another measure of map complexity, the links to nodes ratio (L/N) was calculated. The links to nodes ratio indicates how dense the maps are in terms of linkages among the concepts (nodes) in the maps. These ratios are shown in Table 6. The individual maps in our experiment have an average links to nodes (L/N) ratio of 1.54 with a standard deviation of 0.3 (maximum L/N ratio for individuals was 2.4; minimum L/ N ratio for individuals was 1.0). Generally, the group maps have an average ratio of 1.7 with a standard deviation of 0.3 (maximum 2.0, minimum 1.27).
As shown in Table 6, only for the aggregate method did the collective maps consistently have higher L/N ratios than the individual maps. For both congregate and workshop methods, the collective maps have about the same ratios as the individual maps with large variances. The aggregate models consistently have higher ratios than either the congregate or the workshop models, even though the individual maps for the aggregate method had lower L/N ratios on the average than did the other groups’ individual maps. One other interesting result was for congregate group C: this group had by far the highest individual L/N ratio, yet the resulting collective map was simpler than both aggregate maps and one of the workshop maps. This suggests that congregate mapping may simplify the collective map more than aggregate mapping.
Although Eden and Ackermann (1992) report typical ratios of 1.15 – 1.20 for maps elicited from interviews, several studies reported higher ratios. For example, Hart’s (1977) maps have ratios ranging from 1 to 1.4. The causal maps of subjects in Klein and Cooper (1982) have ratios ranging from 1.2 to 1.7. The causal maps in Laukkanen (1994) have ratios of 1.96 and 1.67. Thus our average individual ratio of 1.5 is consistent with other studies.
Table 7. Map density as a measure of map complexity
Map density |
A |
B |
C |
D |
E |
F |
Group map |
0.20 |
0.20 |
0.19 |
0.15 |
0.09 |
0.19 |
Average individual maps |
0.21 |
0.18 |
0.25 |
0.30 |
0.13 |
0.16 |
STD (individuals) |
0.10 |
0.06 |
0.05 |
0.25 |
0.03 |
0.03 |
Note: A and B use the aggregate method; C and D use the congregate method; E and F use the workshop method.
Copyright © 2005, Idea Group Inc. Copying or distributing in print or electronic forms without written permission of Idea Group Inc. is prohibited.

Collective Causal Mapping Approaches 155
The reason for smaller ratios reported by Eden and Ackermann is that their maps contain a large number of nodes and their method of eliciting maps results in less links than the cross-impact method that was used in this research. In the cross-impact method, the map builder considers many possible impacts of every factor on all other factors, while in the interviewing method the map builder only considers direct impacts.
As shown in Table 7, the individual maps have an average density of 0.20 (with a standard deviation of 0.12). In terms of map density as an indicator of map complexity, there were no statistically significant differences between the group maps and average individual maps. This result is not consistent with the results obtained using the L/N ratios, in which the aggregate models have higher ratios than average individual maps. However, inspection of Table 6 indicates that for both the congregate and workshop methods, one of the two groups had lower density than the two groups employing the aggregate method. There seemed to be more variation in density for the congregate and workshop methods than for the aggregate method.
Our maps are denser than those reported in previous studies. For example, maps in Hart (1977) have an average density of 0.03 (ranging from 0.024 to 0.042). The causal maps of subjects in Klein and Cooper (1982) have density ratios ranging from 0.06 to 0.21. The causal maps of subjects in Laukkanen (1994) have ratios of 0.09 and 0.10. The maps in this study are denser than those reported in the literature because these maps have smaller numbers of nodes4 and the method we used to elicit maps was “cross-impact” rather than “interviewing” or coding from documents or transcripts. Our result is consistent with the observation that Klein and Cooper (1982) drew from their studies: the smaller the maps, the larger density. They explain that in smaller maps the concepts tend to be of central importance to the situation, and thus the decision makers identify many relationships between them, making the maps dense.
Finally, we used the distance ratio (DR) proposed by Markoczy and Goldberg (1995) and the program provided by the authors to calculate DRs between the group maps and the individual maps. A summary of distance ratios between collective maps and individual maps is given in Table 8. On average, the DR between group maps and individual maps is 0.13 with a standard deviation of 0.03. The maximum DR is 0.19 and the minimum 0.08. The results shown in Table 8 suggest that the method used to construct group maps has an impact on the average DR from the collective map to the individual maps. To test this
Table 8. Distance ratios between collective maps and individual maps
Groups |
A |
B |
C |
D |
E |
F |
|
0.19 |
0.15 |
0.19 |
0.13 |
0.1 |
0.15 |
Groupindividual |
0.17 |
0.14 |
0.19 |
0.11 |
0.08 |
0.1 |
distance ratios |
0.15 |
0.14 |
0.16 |
0.13 |
0.09 |
0.11 |
|
0.12 |
0.17 |
0.12 |
0.12 |
0.08 |
0.12 |
Average |
0.16 |
0.15 |
0.17 |
0.12 |
0.09 |
0.12 |
Note: A and B use the aggregate method; C and D use the congregate method; E and F use the workshop method.
Copyright © 2005, Idea Group Inc. Copying or distributing in print or electronic forms without written permission of Idea Group Inc. is prohibited.

156 Vo, Poole and Courtney
observation, we conducted a one-way ANOVA with method as the factor and distance ratios between the collective maps and the respective individual maps as the dependent variable. For each method, we had eight cases. We found that the workshop mapping method had the lowest DR as compared to the congregate method (p < .006) and the aggregate method (p < .001). However, there was no difference between the aggregate and the congregate methods.
In summary, the results obtained for the links-to-nodes ratio and the distance ratio measures are supportive of the expectation that the aggregate method would produce more complex collective maps than the congregate method and the workshop method. And while the map density results were not significantly different, the pattern was also consistent with this expectation.
Subjective Measures
Subjective evaluation of the experimental outcomes was conducted three months after the comparative experiment under the guidance of an assistant. The rating process was supported by an evaluative questionnaire (available from the authors). The questionnaire consisted of eight maps or figures (six maps from the outcome of the comparative experiment, one map of the management team, and one synthesized map). Subjects were not told which maps were which. The questionnaire was designed based on a multiattribute value (MAV) model (Massey and O’Keefe, 1993; Massey and Wallace, 1996; Sakman, 1985) with three attributes or criteria: problem representation (C1), solution implication (C2), and stakeholder implication (C3). Subjects were asked to evaluate the figures in two steps. In step one, they identified the information in each map that was critical. In step two, they rated the map on the three criteria. The first step provided the basis for the second step. For example, for problem representation, the raters were asked to mark elements (factors and relations between factors) with þ (or 0) symbols if the raters agreed (disagreed) that these elements represented the problem situation. For solution implication, they were asked to mark relationships that had important implications for solving the problem. For stakeholder implication, subjects were asked to indicate how well various groups of stakeholders and their needs, interests, and power5 were incorporated in the map. They rank ordered these groups in terms of which were represented the best, second best, and so forth.
All HALONG subjects were contacted and asked to evaluate the maps. Half of them completed the questionnaire. To obtain a more robust evaluation of whether the maps represented the situation at HALONG, three senior management personnel who had not participated in building the maps were also recruited to evaluate them. In addition to HALONG personnel, 30 M.B.A. students who had been in management positions and ten lecturers in a Vietnamese school of management were recruited to rate the maps. Twentyeight usable questionnaires (21 from M.B.A. students, seven from lecturers) were obtained from this sample.
The measures in this study were three attributes of the group map that were defined above: problem representation (C1), solution implication (C2), and stakeholder implication (C3). The attributes were measured on a 0-10 scale, in which 0 indicates “strongly disagree” and 10 indicates “strongly agree.”
Copyright © 2005, Idea Group Inc. Copying or distributing in print or electronic forms without written permission of Idea Group Inc. is prohibited.
Collective Causal Mapping Approaches 157
Table 9. A plan for comparison of results of mapping across the groups
Treatments |
M1 (Aggregate) |
|
M2 (Congregate) |
M3 (Workshop) |
||
Group |
A |
B |
C |
D |
E |
F |
Raters |
G1 (HL) / G2 (non-HL) |
G1 (HL)/ G2 (non-HL) |
G1 (HL)/ G2 (non-HL) |
|||
As illustrated in Table 9, the comparison of the results is organized in the following manner. For each method (M1, M2, M3), we compared the two groups of raters (HALONG raters, indicated by G1, versus non-HALONG raters, indicated by G2) in terms of the three criteria (C1, C2, C3) to determine whether independent evaluations (non-HALONG raters) were significantly different from participant evaluations (HALONG raters). Originally we had planned to contrast HALONG participants’ perceptions with the perceptions of the three non-participating HALONG managers, but there were no significant differences between these two sets of ratings, so they were combined for this analysis. We also compared the pairs of group maps derived with the same method on the three criteria to determine whether they received significantly different evaluations. Finally, we compared the three methods over the three criteria for all raters combined to determine the relative performance of the methods.
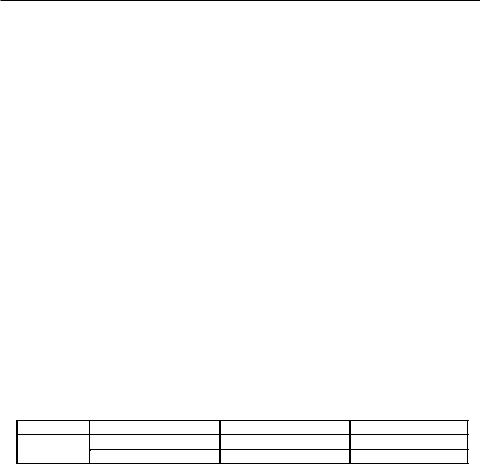
Comparison of means for the two aggregate collective maps constructed by groups A and B indicated that the two maps differed (see Figure 1). Although the maps for groups A and B were derived using the same method, B received significantly higher ratings than A for problem representation (t = -2.24, df = 84, p = .02, 2 tailed). The differences are near significant in terms of solution implication (t = -1.85, df = 83, p = .068) and stakeholder
Figure 1. Evaluation of the aggregate method over three criteria
7.5 |
|
|
|
7 |
|
|
|
6.5 |
|
|
|
6 |
|
|
|
5.5 |
|
|
|
5 |
|
|
|
C1 |
C2 |
|
C3 |
G1-A |
G1-B |
G2-A |
G2-B |
Notes: G1 stands for the HALONG rater group; G2 for the non-HALONG rater group. A and B are the two group maps constructed in the experiment using the aggregate method. C1 is the average ratings of the groups for problem representation criterion, C2 for solution implication criterion, and C3 for stakeholder implication criterion. So, G1-A represents the ratings given by HALONG raters (G1) to the first aggregate group map (A). G1-B represents the ratings of the second aggregate group map (B) by the HALONG raters (G1). G2-A represents the ratings of the first aggregate group map (A) by the non-HALONG raters (G2). G2-B represents the ratings of the second aggregate group map (B) by the non-HALONG raters (G2).
Copyright © 2005, Idea Group Inc. Copying or distributing in print or electronic forms without written permission of Idea Group Inc. is prohibited.
158 Vo, Poole and Courtney
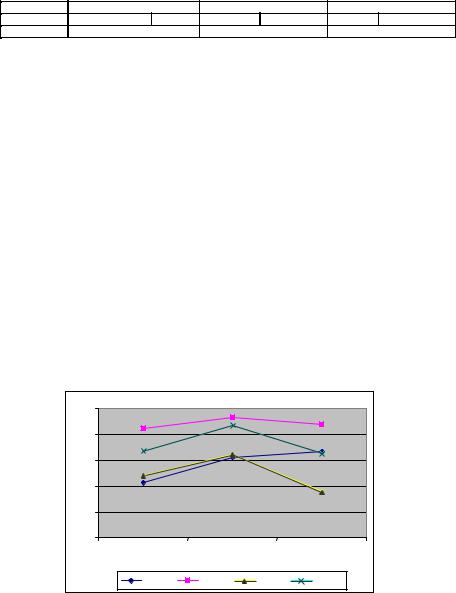
Figure 2. Evaluation of the congregate method over three criteria
7 |
|
|
|
6.5 |
|
|
|
6 |
|
|
|
5.5 |
|
|
|
5 |
|
|
|
C1 |
C2 |
|
C3 |
G1-C |
G1-D |
G2-C |
G2-D |
Notes: G1 stands for HALONG raters; G2 for non-HALONG raters; C and D are the two group maps constructed in the experiment using the congregate method. C1 stands for problem representation criterion, C2 for solution implication criterion, and C3 for stakeholder implication criterion. See Figure 1 note for further explanation.
implication (t = -1.891, df = 83, p = .062). No significant difference was found in the evaluations between the HALONG and non-HALONG raters for C1 and C2 (p>.1). HALONG raters gave slightly higher ratings to C3 than independent raters with a 10% level of significance (t = 1.777, df = 83, p = .07).
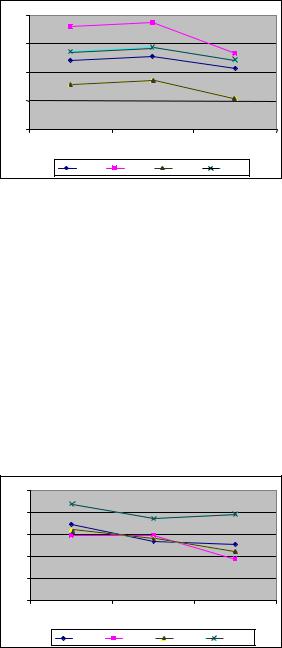
Figure 3. Evaluation of the workshop mapping method over three criteria
7.5 |
|
|
|
7 |
|
|
|
6.5 |
|
|
|
6 |
|
|
|
5.5 |
|
|
|
5 |
|
|
|
C1 |
C2 |
|
C3 |
G1-E |
G1-F |
G2-E |
G2-F |
Notes: G1 stands for HALONG raters; G2 for non-HALONG raters; E and F are the two group maps constructed in the experiment using the workshop method. C1 stands for problem representation criterion, C2 for solution implication criterion, and C3 for stakeholder implication criterion. See Figure 1 note for further explanation.
Copyright © 2005, Idea Group Inc. Copying or distributing in print or electronic forms without written permission of Idea Group Inc. is prohibited.
Collective Causal Mapping Approaches 159
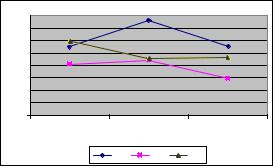
Figure 4. Comparison of the three methods over three criteria
7 |
|
|
6.8 |
|
|
6.6 |
|
|
6.4 |
|
|
6.2 |
|
|
6 |
|
|
5.8 |
|
|
5.6 |
|
|
5.4 |
|
|
C1 |
C2 |
C3 |
M1 |
M2 |
M3 |
Notes: M1 stands for the ratings averaged across all raters for both maps constructed with the aggregate method, M2 the ratings averaged across all raters for both maps constructed with the congregate method, and M3 the ratings averaged across all raters for both maps constructed with the workshop method. C1 stands for problem representation criterion, C2 for solution implication criterion, and C3 for stakeholder implication criterion
Comparison of means for groups C and D for the congregate mapping method (see Figure 2) indicated no significant differences between groups. The difference was near significance for problem representation (t = -1.956, df = 84, p = .054, 2 tailed), but it was not significant for either solution implication (t = -1.754, df = 84, p = .083) or stakeholder implication (t = -1.612, df = 84, p = .111). Although the figure suggests a tendency for HALONG subjects to rate outcomes higher than non-HALONG subjects, the difference was not statistically significant (p > .10).
The result of the means comparison between the maps of groups E and F, which utilized the workshop mapping method, indicated significant differences between the two maps (see Figure 3) for the non-HALONG raters. While the HALONG group rated the maps for groups E and F as approximately equal on the three criteria, the non-HALONG subjects rated group F’s map as better than group E’s on all three criteria (t = 2.44, df = 84, p = .017 for problem representation; t = 2.02, df = 84, p = .046 for solution implication; and t = 2.30, df = 84, p = .024 for stakeholder implication).
The effectiveness ratings for the three methods of constructing maps for all raters combined are shown in Figure 4. To test for differences in effectiveness between the three methods we conducted one way ANOVAs with methods as the factor for each of the three dependent variables (C1, C2, and C3). The ANOVAs revealed a significant main effect for the method factor for solution implication (C2: F = 4.123, df = 2/254, p = .017). A marginally significant main effect was also found for stakeholder implication (C3: F = 2.263, df = 2/254, p = .106). No significant effect was found for problem representation (C1). Post-hoc tests revealed that the aggregate mapping method was rated as superior to the other two methods on solution implication (p < .015) and to the congregate method in terms of stakeholder implication (p < .03)
Copyright © 2005, Idea Group Inc. Copying or distributing in print or electronic forms without written permission of Idea Group Inc. is prohibited.