

Narayanan V.K., Armstrong D.J. - Causal Mapping for Research in Information Technology (2005)(en)
.pdf160 Vo, Poole and Courtney
Discussion
The results of Study 1 suggest that aggregate maps are more complex than congregate and workshop maps. They also suggest that aggregate maps are perceived to be more effective in suggesting solutions than both congregate and workshop maps and more effective in representing stakeholders’ views than congregate maps. However, the results also showed that groups using the congregate and workshop methods could vary widely in the objective properties of the maps they created. Moreover, ratings of maps varied between groups using the same method for all three mapping approaches.
Differences between groups using the aggregate and congregate methods may be due to the skill of members involved. In the aggregate and congregate methods, facilitators were not directly involved in the process of building group maps. Groups followed the instructions for each method in their own way. It may be the case that the skill of members in carrying out the mapping process had an impact on the outcome. If facilitators had been more involved, there may have been more consistent results. It is well documented in the literature that facilitation plays an important role in group process outcomes (Hackman, 1990; Phillips and Phillips, 1993; Vennix, 1996).
Differences between the two groups using the workshop mapping method, which was aided by a facilitator, may be due to the nature of the facilitation. One of the facilitators in the study had a good deal more experience than the other. Eden and Ackermann (1992) observed that: “[I]nexperienced mappers [facilitators] tend to generate a map with a smaller number of constructs than those identified by an experienced mapper and in addition they generate more links.” As indicated in Table 5, the less experienced facilitator for group F created a map with 11 factors and 21 links, whereas the more experienced facilitator for group E created a map with 15 factors and 19 links. Thus, group facilitation may account for the variance in the links/nodes ratios for the collective mapping method.
The congregate method fared worst in terms of subjective ratings and also yielded models with quite different objective properties for the two groups. This may be because subjects were not familiar with thinking in terms of feedback loops (Hall, 1984; Weick and Bougon, 1994; Richardson, 1991; Steinbruner, 1974; Levi and Tetlock, 1980). Without special training it is difficult to identify important feedback loops, which in some cases may require time to think through. Some feedback loops may be associated with long delays that may take a long time to be effective. For many people, it is much easier to think about a problem in terms of a “shopping list” in which only one-way impacts are identified.
The HALONG raters consistently rated the two maps derived from the workshop method as equally good, but the non-HALONG raters tended to rate one map of each pair as significantly better than the other. This difference between the two groups of raters is not difficult to explain. The HALONG raters are likely to have relied more on content when making their judgments (e.g., whether the maps reflected the problem situation), while the non-HALONG raters are likely to have relied more on the structural characteristics6 of the map (e.g., the amount of information in the maps).
Copyright © 2005, Idea Group Inc. Copying or distributing in print or electronic forms without written permission of Idea Group Inc. is prohibited.

Collective Causal Mapping Approaches 161
Table 10. Correlations between objective and subjective measures
Correlations |
C1 |
C2 |
C3 |
L/N ratio |
-0.60 |
-0.13 |
-0.39 |
Density ratio |
-0.82 |
-0.36 |
-0.67 |
Links |
0.66 |
0.50 |
0.68 |
Note: C1 stands for problem representation criterion, C2 for solution implication criterion, and C3 for stakeholder implication criterion.
In an attempt to illuminate the relationships between the subjective and objective measures, we ran correlations between some objective measures (number of nodes, number of links, L/N ratios, map density ratios, out-degree and in-degree of problem variable – sales) and the subjective measures (problem representation, solution implication, stakeholder implication). Some of the interesting correlations are reported in Table 10.
Problem representation (C1) and stakeholder implication (C3) are negatively correlated with map complexity and L/N ratio, yet positively correlated with number of links. Correlations are weaker for stakeholder implication (C3) than for problem representation, and weaker still for solution implication (C2). Subjective measures have higher correlations to map complexity than to the L/N indicator. No significant correlations were found between subjective measures and the number of nodes, out-degree and in-degree of the problem variable (sales).
The relationships between objective and subjective measures are interesting and may suggest some implications for the conditions when the methods may be best applied. The negative correlations between the subjective measures and complexity suggest that maps with higher levels of complexity are not perceived to be as useful or as representative as simpler maps. One implication of this, for example, is that the aggregate method may not work well in larger and heterogeneous groups, as it tends to increase group map complexity as the number of group members or the distinct perspectives increases. On the contrary, the congregate method may be more suited to larger and heterogeneous groups as it is able to handle heterogeneous perspectives via causal loops. An increase in the number of causal loops does not necessarily increase group map complexity. The positive correlation between the number of links in group maps and the effectiveness of group maps is reasonable. Relationships in a map indicate the content or information in a map, and thus a greater number of relationships may imply more information-content in the map. However, too many relationships may increase map complexity, and this may reduce the effectiveness of the group map for observers.
Results of Study 2
Seven individual maps were elicited from members of the research team following procedures described above. These were used to build collective maps with the
Copyright © 2005, Idea Group Inc. Copying or distributing in print or electronic forms without written permission of Idea Group Inc. is prohibited.

162 Vo, Poole and Courtney
Table 11. Descriptive statistics on individual causal maps
|
Individual Researchers |
|
|
|
|
||
|
P1 |
P2 |
P3 |
P4 |
P5 |
P6 |
P7 |
Number of Factors (Nodes) |
20 |
23 |
10 |
27 |
17 |
18 |
16 |
Number of Relationships (Links) |
45 |
44 |
25 |
47 |
49 |
43 |
46 |
L/N ratio |
2.25 |
1.91 |
2.50 |
1.74 |
2.88 |
2.39 |
2.88 |
Density ratio |
0.12 |
0.09 |
0.28 |
0.07 |
0.18 |
0.14 |
0.19 |
aggregate and congregate methods. Summary information about individual maps is presented in Table 11. On average, an individual map had 19 factors (with a standard deviation of 5.4), 43 links or relationships (with a standard deviation of 8), an L/N ratio of 2.36 (with a standard deviation of .44), and a density ratio of 0.15 (with a standard deviation of .07).
The aggregate model was built by the researcher without the assistance of the group. In the aggregate method, all the factors and links from each individual map were included in the collective map. The result was that the aggregate map had 39 factors and 193 unique links. Its L/N ratio was 4.95 and density ratio was 0.13. Because the aggregate map was quite complicated, we split it into two parts: a unique map and a common map. The unique map (referred to as the aggregate map henceforth) contained unique relationships extracted from individual maps. Relationships that appear in at least two individual maps were entered into the common map (referred to as the common aggregate map henceforth).
The congregate model was built by the researcher, who identified the common causal loops in the individual causal maps of Houston’s infrastructure and folded them into a common model. The process of building the congregate model consisted of four steps:
(1)identification of key actors and their goals and behaviors in the infrastructure system,
(2)formulation of reference knowledge based on the interview transcripts, (3) identification of causal loops in individual maps matching reference knowledge and formulation of hypothetical causal loops to match the unexplained reference knowledge, and (4) construction of a map incorporating a theory of the problem based on a model that congregates causal loops identified in (3) with a consideration of temporal dynamics. The
Table 12. Descriptive statistics on common causal maps
|
Nodes |
Links |
L/N |
Density |
Aggregate |
39 |
193 |
4.95 |
0.13 |
Common Aggregate(*) |
21 |
51 |
2.43 |
0.12 |
Congregate |
16 |
32 |
2.00 |
0.13 |
Workshop |
38 |
57 |
1.50 |
0.04 |
Average of Individual Map Statistics |
29 |
83 |
2.72 |
0.11 |
Note: (*) The common aggregate map contains those beliefs (or relationships) that appear in at least two individual maps.
Copyright © 2005, Idea Group Inc. Copying or distributing in print or electronic forms without written permission of Idea Group Inc. is prohibited.

Collective Causal Mapping Approaches 163
resulting congregate model had 16 factors and 32 links. Its L/N ratio was 2.00 and density ratio was 0.13.
The workshop model was built by five out of the seven researchers in a mapping workshop. The workshop was initiated by a problem description that was based on the interview transcripts of interviews previously conducted by the researchers. Each participant received a ten-step instruction sheet to guide discussion. The subjects took turns in describing the problem situation by identifying problem variables, consequent factors, causal factors that affected the problem variables, and causal relationships between them. The facilitator (the first author) recorded these factors/variables and their relationships on a whiteboard and asked other members whether they agreed to include these elements and agreed with the story being told in the group map. The process was repeated until element entries were exhausted. The workshop took about an hour. The resulting workshop model had 38 factors and 57 links. Its L/N ratio was 1.50 and its density ration was 0.04.
In terms of map density ratio, shown in Table 12, we found that the aggregate method produced the most complex collective map of the three methods, followed by the congregate and workshop methods. The common aggregate map is simpler than the whole aggregate map but it is still more complex than the workshop and the congregate maps (in terms of L/N ratio). Although the workshop map has a great number of factors, it is the simplest map in terms of L/N and map density ratio.
When compared to the individual maps within each group, only the congregate map has fewer factors, while the workshop and aggregate maps have more factors than the average individual map. In terms of the number of links, both congregate and workshop maps have fewer links, while the aggregate map has more links than the individual maps. In terms of L/N ratio, both congregate and workshop maps are less complex but the aggregate map is more complex than the individual maps. In terms of map density ratio, the workshop map is less dense while both congregate and aggregate maps are denser than the individual maps.
Distance ratios (DRs) between the collective maps and the individual maps are shown in Table 13. On average, the DR between group maps and individual maps is 0.07 with a standard deviation of 0.02. The maximum DR is 0.12 and the minimum 0.05.
We observe from Table 13 that the method used to construct group maps might have some impact on the average DR from the collective map to the individual maps. To test this observation, we used one-way ANOVA with one factor (method) and one dependent variable (DR). For each method, we had seven cases. The results of the ANOVA revealed
Table 13. Distance ratios between collective maps and individual maps
|
P1 |
P2 |
P3 |
P4 |
P5 |
P6 |
P7 |
Aggregate |
0.08 |
0.12 |
0.08 |
0.07 |
0.08 |
0.09 |
0.12 |
Common |
0.07 |
0.11 |
0.06 |
0.05 |
0.08 |
0.06 |
0.09 |
Aggregate |
|
|
|
|
|
|
|
Congregate |
0.07 |
0.10 |
0.05 |
0.06 |
0.06 |
0.07 |
0.09 |
Workshop |
0.05 |
0.06 |
0.06 |
0.06 |
0.07 |
0.06 |
0.07 |
Copyright © 2005, Idea Group Inc. Copying or distributing in print or electronic forms without written permission of Idea Group Inc. is prohibited.
164 Vo, Poole and Courtney
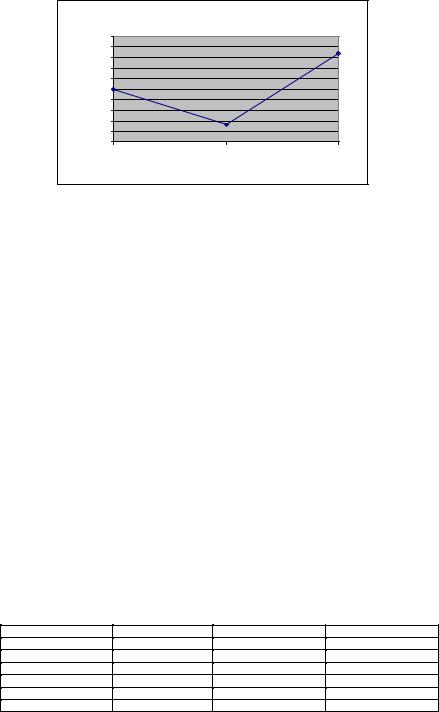
Figure 5. Comparison of group maps in terms of Problem Representation
Representation |
7.5 |
|
|
7.3 |
|
|
|
7.1 |
|
|
|
6.9 |
|
|
|
Problem |
|
|
|
6.7 |
|
|
|
6.5 |
|
|
|
6.3 |
|
|
|
6.1 |
|
|
|
of |
|
|
|
5.9 |
|
|
|
Mean |
|
|
|
5.7 |
|
|
|
5.5 |
|
|
|
|
|
|
|
|
Aggregate |
Congregate |
Workshop |
|
|
Method |
|
a significant main effect for the method factor that had an impact on DR (F = 3.941, df = 3/27, p = .02). Post-hoc tests (LSD) revealed that the aggregate map had higher DRs than both the workshop (p < .002), and the congregate methods (p < .05).
Subjects were asked to evaluate the maps in terms of problem representation, solution implication and stakeholder implication, as described in Study 1. Figure 5 shows the means on problem representation for the three methods: the congregate method had the lowest rating, followed by the aggregate method, with the workshop method receiving the highest rating. There was no consensus on what model was best in terms of problem representation among the raters. Three raters believed that the model based on the workshop method was best, while two raters chose the model based on the aggregate as the best and one rater preferred the model based on the congregate method.
A preparatory step in the rating for solution implication asked the rater to identify critical paths that indicated where the problem was and what he/she agreed could be useful in developing some resolution directions for the problem. Based on this activity, the rater was asked to rate the degree to which the model could help in developing policies to resolve the problem on a scale from 0 (strongly disagree) to 10 (strongly agree). The workshop model received higher ratings than did the congregate model, which received higher ratings than the aggregate model. However, none of these differences was statistically significant.
Stakeholder implications were rated with reference to six groups of stakeholders: elected officials, the city public works department, citizens, businesses, contractors, and media.
Table 14. Comparison of the three methods on stakeholder implications
Stakeholders |
Workshop |
Congregate |
Aggregate |
Elected Officials |
7 |
4.8 |
4.7 |
City Departments |
6.2 |
5 |
4.2 |
Citizens |
6.5 |
5.5 |
5 |
Businesses |
6.8 |
6.2 |
5.8 |
Contractors |
5.5 |
5 |
4.3 |
Media |
5 |
4.5 |
3.5 |
Copyright © 2005, Idea Group Inc. Copying or distributing in print or electronic forms without written permission of Idea Group Inc. is prohibited.

Collective Causal Mapping Approaches 165
Table 15. Comparison of the three methods on multiple perspectives implication
Perspectives |
Workshop |
Congregate |
Aggregate |
|
Economic |
8 |
|
7.2 |
7 |
Political |
7.8 (a) |
5 (a) |
4.2 (a) |
|
Technical |
7.3 |
(b) |
4.5 (b) |
4.3 (b) |
Environment |
6.2 |
|
4.7 |
6 |
Social |
6.2 |
|
5 |
4.8 |
Ethical |
2.3 |
|
1.8 |
1.8 |
Note: Means in the same row labeled with (a) are significantly different at p < .05; means in the same row labeled with (b) are significantly different at p < .10.
Raters were also allowed to identify additional stakeholder groups that were not listed in the questionnaire. As a result, two stakeholder groups were added to the set: environmentalists and engineers. For each group of stakeholders, the rater was asked to circle a number on a scale from 0 (strongly disagree) to 10 (strongly agree) indicating how well the needs and interests of that stakeholder group were incorporated into the model. Results are displayed in Table 14. On average, the workshop method received the highest ratings for all stakeholders while the aggregate model received the lowest ratings. The congregate model received intermediate values. However, these differences were not statistically significant.
The three methods were compared on one additional criterion, multiple perspectives implication, the degree to which the collective causal map is able to capture various perspectives on the problem situation. In this study, multiple perspectives implication indicated how adequately a group map represents six perspectives on infrastructure: economic, political, technical, environmental, social, and ethical. Although raters were asked to identify additional perspectives that were not listed in the questionnaire, they did not suggest any. For each perspective, the rater was asked to circle a number on a scale from 0 (strongly disagree) to 10 (strongly agree) to indicate how well the perspective was represented in the model. Results are reported in Table 15. On average, the model derived from the workshop method received the highest ratings for all perspectives, while the aggregate model received the lowest ratings with the exception of the environmental perspective. The congregate model was intermediate. ANOVA tests revealed that the workshop model was able to better capture the political and technical perspectives of the problems. Other differences were not statistically significant. Of interest is the fact that none of the methods was judged able to capture the ethical perspective on the situation as perceived by the raters.
Discussion
In this study, we also found that the aggregate method produced the most complex collective map. In terms of distance ratios between collective maps and individual maps, we found that workshop maps had the lowest DRs, aggregate next lowest, and congregate the highest DRs. An implication of this pattern is that the workshop method may enhance
Copyright © 2005, Idea Group Inc. Copying or distributing in print or electronic forms without written permission of Idea Group Inc. is prohibited.

166 Vo, Poole and Courtney
the effects of knowledge sharing among group members, while the congregate mapping method may have difficulties in gaining acceptance from group members. In terms of problem implication and solution implication, workshop maps were perceived to be superior to aggregate or congregate maps, with congregate maps faring worse than aggregate maps. The workshop model was also rated better in terms of stakeholder implications and multiple perspective implications, with congregate maps next and aggregate maps receiving the lowest ratings. Many of these results were not, however, statistically significant due to the low power of the tests.
It is interesting to note the differences between subjective judgments of complexity and the objective measures of complexity. Our observation during this study was that human subjects tend to make judgments that are similar to the simplest objective measure (the number of nodes) while placing less emphasis on objective measures based on both nodes and links (L/N ratio or density). Most raters believed that the congregate map was the simplest. One rater commented that “we don’t like it [the congregate map] because it is too simple” compared to the other maps. However as indicated in Table 11, the congregate map is actually more complex than the workshop map in terms of L/N ratio and map density.
Summary and Conclusion
The results of both studies lend support for the hypothesis that the aggregate method would produce the most complex collective maps, whereas the congregate method would produce collective maps lower in complexity. The workshop method tended to produce collective maps with an intermediate degree of complexity. This result is particularly evident for the L/N ratio, but is also reflected in several map density comparisons. In terms of distance ratios between individual maps and the collective maps, the congregate and workshop methods were less distant than the aggregate method in both cases.
In terms of subjective ratings of the methods, Study 1 suggested that the aggregate method was rated better than the congregate method for all criteria. Moreover, the aggregate and the workshop mapping methods were equally good in terms of problem representation and stakeholder implication. However, the aggregate method outperformed the workshop mapping method in terms of solution implication. In Study 2 a different pattern of results emerged. Workshop mapping was generally superior to aggregate and congregate approaches across all four criteria. Further, congregate maps generally received somewhat better ratings than aggregate maps. Together the two studies lend mixed support to Hypothesis 2.
It is useful to consider the relationships between the objective and subjective results. The objective results were for the most part consistent across the two studies, but there were differences in the subjective results. Aggregate mapping fared better in Study 1 than in Study 2, whereas congregate mapping fared better in Study 2 than in Study 1. Workshop mapping was rated well for the most part in both studies. In Study 1 its ratings were equivalent to those of aggregate mapping (except for solution implication), whereas in Study 2 it was rated much higher than aggregate or congregate mapping. This suggests
Copyright © 2005, Idea Group Inc. Copying or distributing in print or electronic forms without written permission of Idea Group Inc. is prohibited.

Collective Causal Mapping Approaches 167
that map complexity and the degree to which the map corresponds to individual representations had different meanings for the two samples. In Study 1 map complexity did not seem to correlate with lower ratings, whereas in Study 2 it did. In Study 1, degree of difference between collective and individual maps did not correlate with ratings, whereas in Study 2 it was positively correlated.
At least three explanations for this difference can be advanced. First, and most plausible to us, the average number of links and nodes was much higher in the individual maps in Study 2 than in Study 1 (an average of 10 nodes and 15 links in the individual maps in Study 1 versus an average of 29 nodes and 83 links in the individual maps in Study 2). Hence, the aggregate maps in Study 2 were likely to be much more complicated and difficult to interpret than those in Study 1. This may have resulted in lower ratings by the subjects. In addition subjects in Study 1 may have been able to see their own concepts and ideas in the aggregate maps more easily than subjects in Study 2, and thus they might be disposed to rate it higher than in Study 2. Both groups rated the workshop method high, which suggests that higher levels of participation increase perceived value of the collective map.
A second explanation is that the use of groups to build maps in all three conditions in Study 1, but only for the workshop method in study 2, influenced ratings. Participation in Study 1 may have mediated subject ratings of the maps, particularly those of the subjects who built the maps. In Study 2, however, subjects only participated in finalizing the maps for the workshop map and may have seen the aggregate and congregate maps as “alien.” If this explanation is accurate, then one implication is that the aggregate method used in a workshop is superior to the other methods although it performs less well when the facilitator builds the maps. A third possible explanation for the results is that they stem from cultural differences between the subjects in the two studies. However, it is not apparent what cultural differences could account for the differences in results.
Lessons Learned
We can advance several lessons learned about the three methods. The advantage of the aggregate method is that it is simple and easy to implement. It is also very good at pooling information from group members’ individual maps. As the comparative study suggested, the aggregate method works best when individual maps are not very complex and/or when the group is relatively homogeneous (as in Study 1). The disadvantage of the aggregate method is that group maps derived from this method tend to be complex and dense. In larger and more heterogeneous groups, the aggregate method may not be effective as it is in small and homogeneous groups (as in the setting of this experiment).
It seems likely that the congregate method would be more effective in larger and heterogeneous groups. The advantages of the congregate method are two-fold. First, it is less complex (than the aggregate method). An increase in the number of causal loops does not necessarily increase group map complexity. Second, it is better in representing the interactions of multiple perspectives via causal loops. In organizational problem
Copyright © 2005, Idea Group Inc. Copying or distributing in print or electronic forms without written permission of Idea Group Inc. is prohibited.

168 Vo, Poole and Courtney
Table 16. Dependency of method effectiveness on group size
Effectiveness |
Group size |
|
|
Rank |
< 5 |
5 to 7 |
> 7 (hypothesized) |
Best |
Aggregate method |
Workshop method |
Congregate method |
Intermediate |
Workshop method |
Aggregate method = |
Workshop method |
Worst |
Congregate |
Congregate method |
Aggregate method |
formulation, the congregate method is proposed to apply at the organizational level, where the number of groups is many and groups have more distinct perspectives. At the organizational level, the congregate method will help identify different perspectives to be included in the organizational model.
The workshop method fared best in terms of least complexity and highest subjective ratings across the two studies. This is likely due, in part, to the higher level of involvement subjects have in the map-building process. The workshop method can be used alone or in combination with other methods to improve the shared effect of collective maps. Other researchers (Ackermann et al., 1997; Diffenbach, 1982; Eden, 1989) have suggested that such combinations improve the group mapping outcome. The workshop method can replace the aggregate method at the group level when individual maps cannot be obtained for some reason. This substitution may not seriously affect the effectiveness of group maps. In combination with the workshop approach, the congregate method has potential in handling multiple perspectives in complex systems.
One final point to bear in mind is that Study 1 showed that, in terms of objective measures, the congregate and workshop methods had more variation in results than the aggregate method. This is probably due to the fact that these require more judgment on the part of the modeler and group than the aggregate method, which is for the most part based on clear-cut rules. Subjective judgment may well be perceived as bias by some participants, which may create a sense that both the congregate and workshop methods are not representative of some user perspectives.
Based on the results of the two studies, we can also advance some suggestions concerning the relationship between group size and effectiveness of mapping methods. We propose that when group size increases, the effectiveness of the aggregate method will decrease significantly, while the effectiveness of the workshop method may increase slightly, and that of the congregate method will increase.
Table 16 summarizes our hypothesized relationship. This relationship may suggest the best fit method for a given group size. Further study is, however, needed to fully test this relationship because we are going beyond the four-person groups used in the first study and the seven-person group in the second.
References
Ackermann, F., Eden, C., & Williams, T. (1997). Modelling for litigation: Mixing qualitative and quantitative approaches. Interfaces, 27, 48-65.
Copyright © 2005, Idea Group Inc. Copying or distributing in print or electronic forms without written permission of Idea Group Inc. is prohibited.
Collective Causal Mapping Approaches 169
Axelrod, R. (Ed.) (1976). Structure of decision: The causal maps of political elites.
Princeton, NJ: Princeton University Press.
Boland, R. J., Tenkasi, R. V., & Teeni, D. (1994). Designing information technology to support distributed cognition. Organization Science, 5, 456-475.
Bougon, M. G. (1992). Congregate causal maps: A unified dynamic theory of organization strategy. The Journal of Management Studies, 29, 369-389.
Checkland, P. (1981). Systems thinking, systems practice. New York: John Wiley & Sons.
Courtney, J. F. (2001). Decision making and knowledge management in inquiring organizations: A new decision-making paradigm for DSS. Decision Support Systems, 31, 17-38.
Diffenbach, J. (1982). Influence diagrams for complex strategic issues. Strategic Management Journal, 3, 133-146.
Dutta, A. (2001). Business planning for network services: A systems thinking approach.
Information Systems Research, 12, 260-283.
Eden, C. (1989). Using causal mapping for strategic options development and analysis (SODA). In J. Rosenhead (Ed.), Rational analysis for a problematic world: Problem structuring methods for complexity, uncertainty, and conflict (pp. 2124). Chichester, UK: Wiley.
Eden, C., & Ackermann, F. (1992). The analysis of cause maps. The Journal of Management Studies, 29, 309-323.
Eden, C., Jones, S., & Sims, D. (1983). Messing about in problems: An informal structured approach to their identification and management.. New York: Pergamon.
Forrester, J. W. (1969). Urban dynamics. Cambridge, MA: Productivity Press. Forrester, J. W. (1961). Industrial dynamics. Cambridge, MA: Productivity Press.
Hall, R. I. (1976). A system pathology of an organization: The rise and fall of the old Saturday Evening Post. Administrative Science Quarterly, 21, 185-211.
Hart, J. A. (1977). Causal maps of three Latin American policy makers. World Politics, 30, 115-140.
Hong, T., & Han, I. (2002). Knowledge-based data mining of news information on the internet using causal maps and neural networks. Expert Systems with Applications, 23, 1-8.
Klein, J. H., & Cooper, D. F. (1982). Causal maps of decision makers in a complex game.
Journal of the Operational Research Society, 33, 63-71.
Kwahk, K. Y., & Kim, Y. G. (1999). Supporting business process redesign using causal maps. Decision Support Systems, 25, 155-178.
Langfield-Smith, K. (1992). Exploring the need for a shared causal map. The Journal of Management Studies, 29, 349-368.
Langfield-Smith, K., & Wirth, A. (1992). Measuring differences between causal maps.
The Journal of the Operational Research Society, 43, 1135-1150.
Lant, T. K., & Shapira, Z. (2001). Organizational cognition: Computation and interpretation. Mahwah, NJ: Lawrence Erlbaum.
Copyright © 2005, Idea Group Inc. Copying or distributing in print or electronic forms without written permission of Idea Group Inc. is prohibited.