

Narayanan V.K., Armstrong D.J. - Causal Mapping for Research in Information Technology (2005)(en)
.pdf200 Nelson
References
Ford, J. D., & Hegarty, W. H. (1984). Decision maker’s beliefs about the causes and effects of structure: An exploratory study. Academy of Management Journal, 27(2), 271291.
Mitroff, I. I., & Mason, R. O. (1982). Business policy and metaphysics: Some philosophical considerations. Academy of Management Review, 7(3), 361-372.
Nelson, K. M., Nadkarni, S., Narayanan, V. K., & Ghods, M. (2000). Understanding software maintainer expertise: A causal mapping approach. Management Information Systems Quarterly, 24(3), 475-507.
Rice, S., & Nelson, K. M. (2003). Analyzing the revealed relationships of it personnel transition concepts. Academy of Management Conference 2003, Seattle, WA.
Robinson, W. S. (1950). Ecological correlations and the behavior of individuals. American Sociological Review, 15, 351-157.
Rossi, P., Wright, J., & Anderson, A. (1983). Handbook of research methods. Orlando: Academic Press.
Siegel, S. (1956). Nonparametric statistics for the behavioral sciences. New York: McGraw-Hill.
Endnote
1This research was funded by an NSF Career grant from the Organizations and Innovation Program.
Copyright © 2005, Idea Group Inc. Copying or distributing in print or electronic forms without written permission of Idea Group Inc. is prohibited.

Reflections on the Interview Process in Evocative Settings 201
Appendix
Information Technology Personnel Transition Study
Interview Instrument
Hi. I’m_________________from the University of XXX. Thank you for agreeing to participate in this interview. I’m going to ask you some unstructured questions and ask for your opinions and feelings on the topics. Are you ready to start?
PROBE PROBE PROBE
1.What motivates you to come to work here at Y every day?
2.How is this motivation ________ tied to your current work environment?
3.What is the best thing about your current work environment?
4.What is the worst thing about your current work environment?
5.What is the most important thing you contribute to (your company)?
6.What could you contribute to (your company) that you currently are unable to contribute?
7.What barriers keep you from making this contribution?
8.Where do you see yourself professionally in five years?
9.Where would you ideally like to see yourself professionally in five years?
10.What barriers might keep you from your ideal situation?
11.How much do you like change?
12.How much do you think the IT field, in general, is changing?
13.How much do you think the IT field at (your company) is changing?
14.How do you feel about this level of change?
15.How is (your company) supporting you in personally making these changes?
16.What barriers do you see to making these changes?
17.What is your primary, personal, one-year professional goal?
Date: _____
Name: ________________________
Tape #: _____
E-mail __________________
Copyright © 2005, Idea Group Inc. Copying or distributing in print or electronic forms without written permission of Idea Group Inc. is prohibited.
202 Nelson
Section III
Causal Mapping in
IS/IT:
Research and Applications
Copyright © 2005, Idea Group Inc. Copying or distributing in print or electronic forms without written permission of Idea Group Inc. is prohibited.

Using Causal Mapping to Uncover Cognitive Diversity 203
Chapter IX
Using Causal Mapping
to Uncover Cognitive
Diversity within a
Top Management Team
David P. Tegarden
Virginia Tech, USA
Linda F. Tegarden
Virginia Tech, USA
Steven D. Sheetz
Virginia Tech, USA
Abstract
The cognitive diversity of top management teams has been shown to affect the performance of a firm. In some cases, cognitive diversity has been shown to improve firm performance, in other cases, it has worsened firm performance. Either way, it is useful to understand the cognitive diversity of a top management team. However, most approaches to measure cognitive diversity never attempt to open the “black box” to understand what makes up the cognitive diversity of the team. This research reports on an approach that identifies diverse belief structures, i.e., cognitive factions, through the use of causal mapping and cluster analysis. The results show that the use of causal mapping provides an efficient and effective way to identify idiosyncratic and shared
Copyright © 2005, Idea Group Inc. Copying or distributing in print or electronic forms without written permission of Idea Group Inc. is prohibited.

204 Tegarden, Tegarden and Sheetz
knowledge among members of a top management team. This approach allows the cognitive diversity of the top management team to not only to be uncovered, but also to be understood.
Introduction
There continues to be a growing interest in linking cognition to decision making, especially group or team decision making (Schwenk, 1995; Walsh, 1995). One aspect especially important to top management team effectiveness is cognitive diversity (Kilduff, Angelmar & Mehra, 2000; Knight et al., 1999). Cognitive diversity is defined as variation in underlying and invisible cognitive processes such as attitudes, beliefs or values among a top management team (Hambrick & Finkelstein, 1987; Finkelstein & Hambrick, 1990). An important feature of group effectiveness is the dispersion or variation of a group’s attributes like tenure, age and differences in beliefs (Hambrick, 1994). Demographic attributes like tenure, age, functional specialties and educational background, are often used as proxies for unmeasured psychological constructs like risk aversion and commitment (Finkelstein & Hambrick, 1990; Hambrick & Mason, 1984). Yet, it is less common for researchers to compile actual psychological profiles of decisionmaking teams (Jackson, 1992). We focus on the explicit identification of differences among a top management team regarding their perceptions and beliefs about the firm’s future direction and strategy, especially regarding their differing perceptions of the situation. While demographic variation implies that there are differences in perception, an actual measurement of these different perceptions can portray the cognitive diversity among a top management team.
A review of the literature suggests that cognitive diversity among a top management team can either enhance or reduce a firm’s performance. It is proposed that cognitive diversity in a top management team is important when a firm is operating in complex environments because there is a lack of clarity about the causes of organizational success and failure (Ashby, 1952; Weick, 1979). Multiple beliefs and perspectives, e.g., cognitive diversity, are important in order to capture the wide range of information necessary to interpret complex environments. Kilduff et al. (2000) found that cognitive diversity is positively related to performance during initial decision making stages among simulation teams. As such, an explicit representation of each perspective could be beneficial to the top management team, especially at the initial stage of a strategic planning cycle.
On the other hand, cognitive diversity can also be detrimental to top management team effectiveness. Some researchers have hypothesized that the greater the shared understanding, i.e., the lower the cognitive diversity, that exists between individuals that work together, the greater the team’s effectiveness (Cannon-Bowers, Salas & Converse, 1990). Other researchers have found that the degree of consensus about goals and about the means of achieving them influences the effectiveness of the firm (Bourgeois, 1980; Dess, 1987; Dess & Origer, 1987). One approach to increase the shared understanding between individuals is to make the beliefs and perceptions explicit by modeling different interpre-
Copyright © 2005, Idea Group Inc. Copying or distributing in print or electronic forms without written permission of Idea Group Inc. is prohibited.
Using Causal Mapping to Uncover Cognitive Diversity 205
tations so as to capture and evaluate both the similarities and differences found in the individuals’ cognitions (Daft & Weick, 1984; Eden & Akermann, 1998a).
Cognitive diversity is an important dimension for both researchers and decision-makers to explicitly model. It is our contention that by explicitly modeling cognitive diversity (the degree to which beliefs and perceptions differ among a top management team), decisionmakers within a top management team can better understand the situation and provide a starting point for deciding on the future direction of the firm. We report on a method that captures both individual and group belief structures. By comparing individual belief structures, it is possible to construct cognitive factions, individuals or subgroups with different beliefs and perspectives. An explicit uncovering of these beliefs can facilitate both researchers interested in investigating the relationship between cognitive diversity and performance and decision-makers interested in investigating and resolving different perspectives within their top management team.
The purpose of this research is to describe a way to uncover cognitive diversity among members of a top management team and to demonstrate, using different analytical techniques, the validity of the identified cognitive factions within the top management team. We identify cognitive factions by grouping individual team members together that have similar belief structures. The number of cognitive factions represents the level of cognitive diversity within the team. As such, the cognitive diversity of the team is represented by the different factions.
As Hambrick (1994) has pointed out, “many top management ‘teams’ may have little ‘teamness’ to them . . . By opening the question of how integrated—how team-like—a group of top managers are, we create the opportunity for important advances in research. First, it allows the explicit introduction of top group integration as a construct. . . .[and s]econd, explication of the construct of top group integration will allow its use as a moderator in studies of associations between top group attributes and organizational outcomes.” As such, the explicit representation of cognitive diversity, through the identification of cognitive factions, at the beginning of a strategic planning cycle, will benefit the planning process. Explicit representation of multiple perspectives can enhance the team’s understanding of the scope of the firm’s environment and situation. The views from the factions increase the scope of views and alternatives for the firm to consider. This allows minority views to be explicitly “heard” and discussed that might otherwise be ignored. As such, at the initial stage of a strategic planning cycle, an explicit representation of the different perspectives, belief structures of cognitive factions, prior to the negotiating and bargaining processes can be beneficial to the top management team in developing a better plan.
In the remainder of the paper, we review causal mapping techniques, overview our causal mapping-based approach for capturing individual and deriving collective cause maps, identify the cognitive factions through the use of cluster analysis and describe the factions using various analytical techniques that demonstrate that indeed the factions are different. Next, we discuss the collective causal maps of the cognitive factions and summarize the results. Finally, we discuss implications for managers and researchers.
Copyright © 2005, Idea Group Inc. Copying or distributing in print or electronic forms without written permission of Idea Group Inc. is prohibited.

206 Tegarden, Tegarden and Sheetz
Table 1. Types of collective cause maps
Type |
Data Capture Approach |
Data Merging Approach |
Congregate Map |
Participant-Driven |
Researcher-Driven |
(Bougon, 1992) |
|
|
Shared Map |
Researcherand Participant-Driven |
Researcherand Participant- |
(Langfield-Smith, 1992) |
|
Driven |
Group Map |
Researcherand Participant-Driven |
Researcher-Driven |
(Eden & Ackermann, 1998a) |
|
|
Oval Map |
Researcherand Participant-Driven |
Researcherand Participant- |
(Eden & Ackermann, 1998a) |
|
Driven |
Group Map |
Participant-Driven |
Participant-Driven |
(Tegarden & Sheetz, 2003) |
|
|
Causal Mapping Background
Causal maps have been used to represent managerial cognition at both the individual and group levels (Axelrod, 1976; Eden & Ackermann, 1998a; Huff, 1990; Meindl, Stubbart, & Porac, 1996). From a managerial and organizational cognition perspective, five causal mapping approaches have been used to produce collective causal maps (see Table 1). Most collective causal map approaches capture the data for the collective maps using individual maps. The individual maps tend to be either created using a participant-driven interview, such as the Self Q interview (Bougon, 1983), or a negotiated researcher and participant interview (Eden & Ackermann, 1998a). The advantage of a participant-driven approach is the minimization of the possibility of researcher bias impacting the creation of the individual maps (Nicolini, 1999).
All of the approaches for creating collective maps from individual maps require that the concepts used in individual maps be standardized in order to create collective maps. The use of congregate labels created by the researcher to group similar concepts used across individuals is common to all approaches that merge individual maps into collective maps (Bougon, 1992; Eden & Ackermann, 1998a, 1998b). In the merging processes associated with the first four approaches in Table 1 (congregate, shared, group, and oval maps), this standardization process occurs after the individual maps are created. Congregate labels are based on researcher’s and possibly participant’s identification of similarities of beliefs contained in the individual maps. The congregate labels are then substituted in the individual maps. Once the congregate labels have been placed into the individual maps, the individual maps can then be merged based on the common nodes (congregate labels) contained in the individual maps. As a result, the process of merging individual maps into a collective map is both time consuming and results in a loss of information regarding idiosyncratic differences among individual belief structures. In addition, researcher bias may be present as the research/facilitator usually determines the congregate labels across individual maps (Nicolini, 1999). In contrast, our process (Tegarden & Sheetz, 2003) enables the individuals in a decision-making team to agree upon the congregate labels so that researcher intervention and bias is minimized.
Copyright © 2005, Idea Group Inc. Copying or distributing in print or electronic forms without written permission of Idea Group Inc. is prohibited.
Using Causal Mapping to Uncover Cognitive Diversity 207
To identify cognitive diversity or what we call cognitive factions in a top management team, we cluster the causal maps created by the members of the top management team based on the similarity of the cause-effect linkages between the nodes (congregating labels). A similar approach was employed by Reger and Huff (1993) to compare cognitive similarities and differences of industry maps across top managers within an industry. In the next section we describe the methodology used to identify the cognitive factions.
Methodology
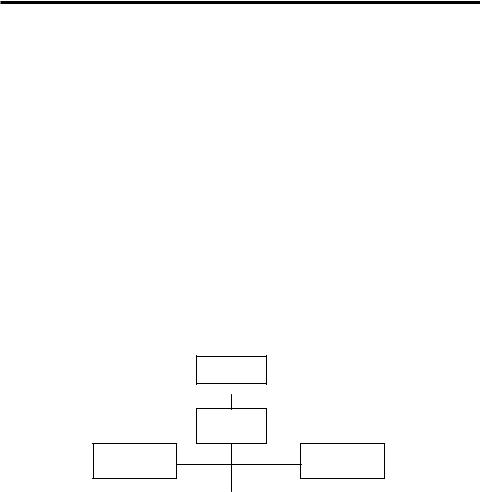
The company described in this paper is a highly successful information technology company that provides customized solutions for government and commercial clients. They employ 500 professionals in six states. It is a privately held, employee-owned company. The company was founded in 1966 with a focus on operational research of transportation issues. In the mid 1980s, they began developing IT solutions to transportation and distribution business requirements. Since 1989, their revenues have grown by an average of 20% each year. Approximately 80% of that growth can be attributed to repeat business from satisfied customers. They are organized into three divisions: the Information Technology Services Division; the Technical Services Division; and, the Facilities Services Division. Figure 1 describes their organizational structure. The planning team is comprised of these eight executives plus five more from various areas of the organization.
The methodology used in this study consists of three primary steps (Figure 2). First, causal maps were elicited. Second, collective causal maps were derived and analyzed. Third, using the causal maps, cluster analysis, and a set of analytical techniques, cognitive factions were identified and justified. Each of these steps is described.
Figure 1. Organizational chart
CEO
President
VP & General
Manager
VP Business
Development
|
|
|
|
|
|
|
|
|
|
VP IT Division |
|
Director |
|
Director |
|||
|
|
|
|
|
Technical |
|
Facilities |
|
|
|
|
|
|
Services |
|
Services |
|
|
|
|
|
|||||
|
|
|
|
|
|
|
|
|
|
|
|
|
|
|
|
|
|
|
VP Army |
|
|
|
|
|
|
|
|
Logistics |
|
|
|
|
|
|
|
|
Systems |
|
|
|
|
|
|
|
|
|
|
|
|
|
|
|
|
Copyright © 2005, Idea Group Inc. Copying or distributing in print or electronic forms without written permission of Idea Group Inc. is prohibited.

208 Tegarden, Tegarden and Sheetz
Figure 2. Cause map elicitation and cognitive faction identification steps
Causal Map Elicitation
Collective Causal Map Derivation
Cognitive Faction Identification
Causal Map Elicitation
As mentioned previously, we use a method where participants identify congregate labels before the causal relationships are identified at the individual map level (Tegarden and Sheetz, 2003). This approach minimizes the potential for researcher bias and provides an efficient means for deriving collective maps in a comparatively short period of time. However, once congregate labels are derived, any causal mapping approach can be adapted to construct cognitive factions using the cluster analysis based approach described here. In our approach, both the individual causal maps and collective maps embody the congregate labels. As such, we can analyze differences as well as similarities among the individual causal maps to create an overall collective map and collective maps representing cognitive factions.
The causal mapping methodology used is a modification of the Self-Q Technique (Bougon, 1983; Sheetz, Tegarden, Kozar & Zigurs, 1994). The methodology is supported by a distributed system that runs in a WWW-based environment.1 The software couples group support systems (GSS) technology with causal mapping to provide a mechanism for the group to identify their own congregating labels. Like most systems that use GSS technology, the software supports anonymity. Anonymity minimizes the effect that the more powerful members of the top management team can have on the other members (Valacich, Dennis & Nunamaker, 1992). Using the software, no one member has any more or less influence on any other member.
The causal mapping elicitation procedures are supported using an agenda of activities implemented in the software. Each activity is supported with an individual tool. Throughout the session, a facilitator provides procedural guidance to the group, e.g., administrative activities such as reading instructions and keeping time. To avoid potential researcher bias, at no time does the facilitator provide feedback on group responses.
Individuals first log on to the system to begin a group causal mapping session. After successfully logging on, individuals identify concepts, define categories from the meanings of the concepts, determine the relative importance of the categories, and
Copyright © 2005, Idea Group Inc. Copying or distributing in print or electronic forms without written permission of Idea Group Inc. is prohibited.

Using Causal Mapping to Uncover Cognitive Diversity 209
Table 2. Causal mapping elicitation procedures
Activity |
Description |
1. Elicit Concepts |
|
Introduction |
Log-in screen and presentation of the framing statement and stall |
|
diagram. |
Concept Identification |
Elicit characteristics, concepts, and/or issues that contribute to strategic |
|
situation of the firm in the case. Comments are shared among all |
|
participants as they are entered. |
2. Identify Categories |
Elicit categories that group concepts by similarity; agree on category |
Category Identification |
|
|
definitions and names. Each participant verbally suggests a category |
|
name and definition. Other participants comment on the name and |
|
definition. The facilitator lists the names and records the definition using |
|
the system. |
3. Classify Concepts |
|
Concept Categorizations |
Each participant classifies the concepts into categories. |
4. Rank Categories |
|
Category Rating Step |
Each participant rates each category on a 9-point scale, from important to |
|
extremely important without knowing the responses of other group |
|
members. |
5. Define |
|
Relationships |
Each individual selects from list uses the system to identify causally |
Identify Relationships |
related categories. Each causal relationship is assigned a direction |
|
(positive + or inverse -) and a strength from 1 to 3 for a scale of -3 to +3, |
|
from strong negative influence to strong positive influence of one |
|
category on another category. |
indicate the influence of each category on other categories (Table 2). Each of the steps is described.
Step 1: Concept Identification
The purpose of this step was to allow the participants to identify and exchange their beliefs about the future direction of their firm. A framing statement was presented to the participants to set the context for the brainstorming of concepts. The framing statement used in this case focused on eliciting ideas about the future direction of the firm. Specifically the statement listed four questions:
1.What do we want to accomplish in the next five years?
2.What is it that we do especially well?
3.What other things should we be doing especially well?
4.What present and future constraints do we face in our operations?
During this activity, the participants occasionally experienced a mental block. A stall diagram also was used to alleviate this situation. The stall diagram allowed the participants to cue themselves by presenting ideas associated with the future direction of their firm (Figure 3).
Copyright © 2005, Idea Group Inc. Copying or distributing in print or electronic forms without written permission of Idea Group Inc. is prohibited.