

Narayanan V.K., Armstrong D.J. - Causal Mapping for Research in Information Technology (2005)(en)
.pdf30 Armstrong
Reliability
To establish the reliability of the identification procedure, interview texts are coded by multiple researchers/raters. The raters are deemed qualified to identify causal statements if they have a familiarity with the technique and the domain under study. If the sample is small, then complete sampling should be conducted. As the total number of pages of transcripts increases, it becomes impossible for each rater to code each text. There are usually two rounds of coding that cover a sample of the texts (5 - 10%). This subset of the texts should be chosen at random. Comparisons are made for agreement and disagreement between the researchers. Where disagreement occurred the discrepancies are resolved through discussion. The reliability between the researchers is calculated by measuring the level of agreement on the identification of causal statements and linkages. The level of agreement between the researchers should be at least 0.75, to have an acceptable level of reliability. For example, in her study of teaching methods, Nadkarni (2003) reported Kendall’s coefficient of concordance (Siegel, 1956) to be 0.75 and argued this was an acceptable level of reliability. A reliability less than 0.75 indicates that the procedure is not robust enough for research purposes, and a modified identification procedure will need to be developed.
Step 2: Construct Raw Causal Maps
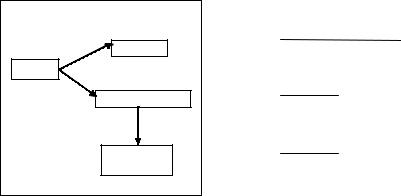
In the second step, the causal statements identified in the first step are then separated into “causes” and “effects” to construct the “raw causal maps.” See Table 4 for sample causal statements.
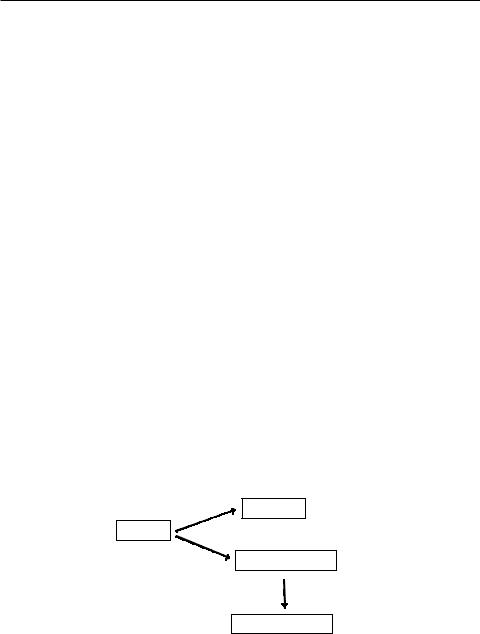
A raw causal map is a map constructed using the language of the participants (See Figure 3).
Step 3: Develop Coding Scheme
In CM research developing a coding scheme is important for several reasons, which include: avoiding misclassification, interpretation and theory building. Carley and Palmquist (1992) argue that aggregating actual raw phrases in the text into generalized concepts can be used to move the coded text beyond explicitly articulated ideas to implied
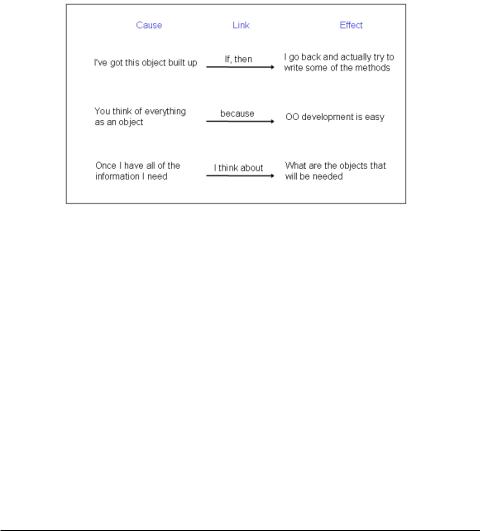
Table 4. Sample causal statements
Cause |
Link |
Effect |
You think of everything as an object |
Because1 |
Object oriented development is easy |
I've got this object built up |
If then |
I go back and actually try to write some of |
|
|
the methods |
Once I have all of the information I need |
I think about |
What are the objects that will be needed |
1 Note: When the keyword “because” is in the sentence the cause comes after the keyword. Refer to the sentences on page 28.
Copyright © 2005, Idea Group Inc. Copying or distributing in print or electronic forms without written permission of Idea Group Inc. is prohibited.
Causal Mapping 31
Figure 3. Raw causal map
or tacit ideas and to avoid misclassification of concepts due to peculiar wording on the part of individuals. In terms of interpretation, the coding scheme provides a mechanism to reduce the cognitive load for both the researcher and the end user of the causal map. For the researcher, a coding scheme is used to simplify the texts. Often the texts are numerous pages in length and can be cumbersome to work with. By developing a coding scheme, like terms can be combined and simplified into a standard format. This aids analysis and interpretation of the maps. For the end user, the readability of the maps is much improved when a word or short phrase can be substituted for a sentence. Again, this provides consistency and clarity for the end user. From a theory building perspective a coding scheme aids understanding of how the concepts (constructs) fit together into a cohesive unit.
The steps involved in developing a coding scheme are dependent on the research context of the study. Two different approaches have been employed to recast the content of causal maps into a common scheme: benchmarking and theory-driven (Nadkarni & Narayanan, in press). Each approach is described and associated with the appropriate research context.
Benchmarking
With the discovery and evocative approaches, the relevant concepts are identified from the participants’ statements (Nadkarni & Narayanan, in press; Nelson et al., 2000). This process is referred to as benchmarking. In the benchmarking approach a list of ideal concepts and links between concepts emerges from the causal maps of one or a group of experts. This list is then used to compare the causal maps of other individuals. The benchmarking approach has been widely used in expert-novice comparison studies (e.g., Hong & O’Neil, 1992). In these studies a causal map is developed based on the concepts evoked from domain experts, with the expert map serving as the standard to which the novice maps are compared. The benchmarking approach is useful in discovery and evocative contexts and in particular studies linking causal maps to performance and learning.
Copyright © 2005, Idea Group Inc. Copying or distributing in print or electronic forms without written permission of Idea Group Inc. is prohibited.

32 Armstrong
Theory-Driven
With the hypothesis testing and intervention approaches, the relevant concepts are defined independent of, and prior to, coding from relevant literature. In the theory-driven approach, the content in the individual causal maps is recast into theoretical categories salient in the domain represented by the maps (e.g., Carley & Palmquist, 1992; Fahey & Narayanan, 1989). In taking this approach, the researchers should first review the relevant literature to determine if there are any theoretical classification schemes that would be appropriate. If no single classification scheme is available, a composite classification scheme encompassing the favorable aspects of the multiple schemes can be used. Tying emergent categories to extant theory has been recommended to develop standard categories (Carley & Palmquist, 1992) and build theory. See Table 5 for a summary of the decision process.
The coding process begins with grouping frequently mentioned words in the statements. A word or word group is created that captured the essence of the statement. For example, the sentence fragment “You group the requirements document items based on functions” could be labeled “Functions” or the fragment “bias on the part of management” could be labeled “Management Bias.” Multiple researchers should review the statements and independently place them into conceptual categories. Comparisons are made for agreement and disagreement in the categorization of concepts. Where disagreement occurs the discrepancies are resolved through discussion. The level of agreement between the raters should be measured with the average no lower than 0.75. Once the conceptual level scheme is developed, all of the statements are placed into the appropriate concept category.
Once the concept-level coding is completed, a construct-level classification scheme can then developed. Again, the benchmarking or theory-driven process should be used.
Table 5. Coding scheme development
Research Context |
Concepts |
Theory Guidance |
Discovery |
Benchmarking from |
No |
|
participants |
|
Evocative |
Benchmarking from |
Minimal |
|
participants |
|
Hypothesis Testing |
From theory |
Yes |
Intervention |
From theory |
Yes |
Table 6. Concept/construct level coding scheme
Raw Phrase |
Coded Concept |
Construct |
You think of everything as an object |
Object |
Structure |
Object-oriented development is easy |
OO Development |
Object-Oriented |
|
|
Development Systems |
I've got this object built up |
Object |
Structure |
I go back and actually try to write some methods |
Method |
Behavior |
Once I have all of the information I need |
OO Development |
Object-Oriented |
|
|
Development Systems |
What are the objects that will be needed |
Identifying Objects |
Object-Oriented Modeling / |
|
|
Analysis |
Copyright © 2005, Idea Group Inc. Copying or distributing in print or electronic forms without written permission of Idea Group Inc. is prohibited.
Causal Mapping 33
Once the construct-level scheme is complete, the concepts can be aggregated into higher level (construct) categories. While some loss of information will be experienced, the ease of interpretation is greatly increased. Table 6 lists a sample of raw statements, the corresponding concept and construct-level categorization.
Validation of Concepts
Once the coding scheme has been developed the concepts should be validated to ensure reliability of the scheme. The coding scheme approach (benchmarking or theory-driven) will determine the most appropriate method of validation. When using the benchmarking approach validation of the coding scheme with individuals who have domain expertise but are not involved in a prior portion of the study is helpful. Validation can be accomplished in multiple ways (e.g., card sort, electronic card sort). With a card sort, the participants are provided the constructs and index cards with each concept. The reliability between the participants is calculated by measuring the level of agreement on the card sort. With the electronic card sort, participants are given an electronic spreadsheet with all of the concepts listed on one sheet and the statements on another sheet. The expert raters sort the concepts into the constructs. The results of each card sort are compared to determine reliability of the coding scheme.
When using the theory-driven approach, the coding scheme should be validated against the existing theoretical framework. When using the theory-driven approach validation of the coding scheme can be accomplished using researchers who have knowledge of the theoretical framework but are not involved in a prior portion of the study. The researchers can validate the scheme by comparing the coding scheme with the theoretical framework. Any discrepancies should be resolved through discussion.
Step 4: Recast “Raw” Maps into Revealed Causal Maps
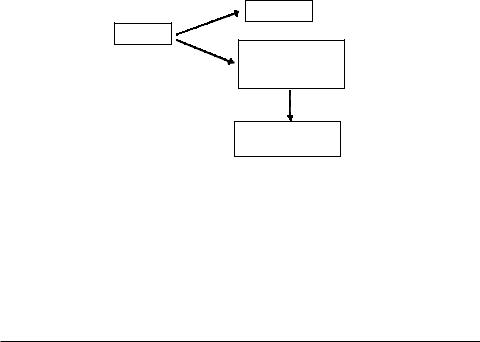
Once the classification scheme is completed, the causal statements for each participant are placed into the appropriate concept (and construct level) categories. The result is a concept (and construct level) causal map for each participant. See Figures 4 and 5 for concept and construct level maps respectively.
Figure 4. Concept level causal map
Method
Object
OO Development
Identifying Objects
Copyright © 2005, Idea Group Inc. Copying or distributing in print or electronic forms without written permission of Idea Group Inc. is prohibited.
34 Armstrong
Figure 5.Construct level causal map
Behavior
Structure
Object Oriented
Development
Systems
Object Oriented
Modeling
The individual maps are then aggregated (Axelrod, 1976; Bougon et al., 1977). The aggregation is performed at both the concept level and the construct level. The aggregation process consists of combining the causal maps of each participant into a single aggregate map.1
Validation of Maps
Once the maps have been created, they should be validated. The validation method is determined by the data collection method (IECM or TBCM). As a source of validation for an IECM a member check may then be performed using the aggregated maps to ensure accurate and comprehensive representation (Lincoln & Guba, 1985). Each participant (or as many as you have access to) is shown the aggregated maps and asked if the maps accurately reflect the concepts, linkages and constructs. It should not be unexpected that as the participant walks through the map he or she will be surprised. The map reflects multiple causal relationships and most individuals do not consciously perceive the causality of concepts in terms of a network. The key is to engage the participant so he or she can reflect on the map you constructed based on the interviews. After a thorough discussion of the map with the participant, any discrepancies should be reported. For example, Nelson et al. (2000) fed the maps back to the organization to get feedback on maps.
When using TBCMs (e.g., archival data) validation becomes a more complicated process because there is no one to confirm your results. With TBCMs one commonly used method of validation is triangulation with other sources. For example, if the researcher is using change request data to track software development productivity, additional data may be gathered from departmental annual reports or individual annual reviews. In another example, Nadkarni and Narayanan (in press) validated the causal maps they constructed from annual reports of firms with the firms K-10 statements. Both internal and external sources can be used if available.
Copyright © 2005, Idea Group Inc. Copying or distributing in print or electronic forms without written permission of Idea Group Inc. is prohibited.

Causal Mapping 35
Representation of Maps
Causal maps may be represented in two main forms: via diagram or matrix. With the diagram method the concepts (constructs) are usually represented as a word or words enclosed in a box. The linkages are represented as lines with arrowheads. The lines originate from the cause concept (construct) with the arrowhead pointing to the effect concept (construct). Whenever possible, the map should be drawn so that the arrows flow from left to right with little or no crossing of the lines (Axelrod, 1976). In some instances there are mutually connected concepts. When two concepts are mutually connected the concepts are causally connected in both directions (the two concepts are both causes and effects of each other) (Knoke & Kuklinski, 1982). Mutually connected concepts are represented as a two-headed arrow.
With the matrix representation the two primary matrices utilized are the adjacency and reachability. An adjacency matrix is a matrix representing the association of direct linkages between two constructs (Knoke & Kuklinski, 1982). If you are interested in the presence or absence of a causal relationship between concepts, the adjacency matrix contains only “0’s” and “1’s” (Carley & Palmquist, 1992). In the matrix the in-degrees is the sum of all of the linkages flowing into the concept. Stated another way, it is the number of times that the concept is an effect concept in a causal statement. The out-degrees is the sum of all of the linkages flowing out of the concept. Again, stated another way, it is the number of times that the concept is a cause concept in a causal statement. Table 7 provides a sample adjacency matrix.
If you are interested in not only the presence or absence of a causal relationship between concepts but also the strength of the relationships, then the adjacency matrix contains “0” for no relationship and a whole number (e.g., “4”) for the number of times that relationship is recorded (Carley & Palmquist, 1992). The method for calculating the frequency of linkages between two constructs is a percentage of the total linkages between all constructs (Ford & Hegarty, 1983).
The reachability matrix indicates both the direct and indirect effects of a variable on all other variables (Nelson, et al., 2000) and is calculated by the formula:
R = A + A2 + A3 + … + A n-1
where R is the reachability matrix, A is the adjacency matrix and n is the number of variables. Table 8 provides a sample reachability matrix.
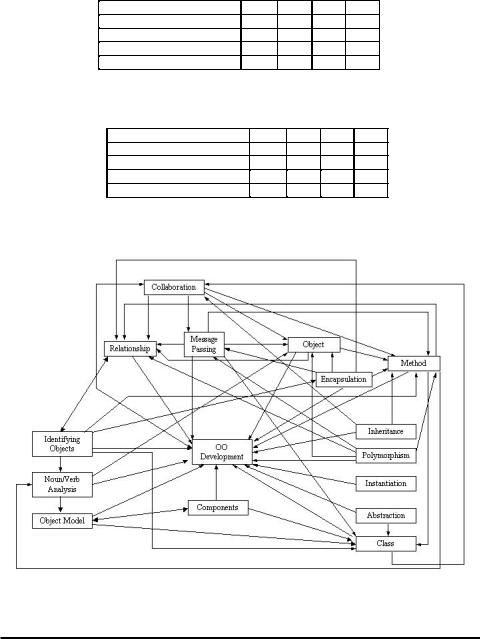
It is important to note that while the diagram and matrix methods are both appropriate for causal mapping representation, as the maps become more complex researchers should carefully consider their choice. For example, in Figure 6 you can see that this is an extremely complex causal map (many concepts with many linkages). While possible, it may be easier to derive the structural properties using the matrix method (aided by computer analysis).
Copyright © 2005, Idea Group Inc. Copying or distributing in print or electronic forms without written permission of Idea Group Inc. is prohibited.
36 Armstrong
Table 7. Sample adjacency matrix from Figure 4 map
Object |
1 |
2 |
3 |
4 |
- |
1 |
1 |
0 |
|
Method |
0 |
- |
0 |
0 |
OO Development |
0 |
0 |
- |
1 |
Identifying Objects |
0 |
0 |
0 |
- |
Table 8. Sample reachability matrix from Figure 4 map
Object |
1 |
2 |
3 |
4 |
- |
1 |
1 |
1 |
|
Method |
0 |
- |
0 |
0 |
OO Development |
0 |
0 |
- |
1 |
Identifying Objects |
0 |
0 |
0 |
- |
Figure 6. Complex causal map
Analysis of Causal Maps
There are two aspects of causal mapping that have been consistently addressed in the literature on analysis: content and structure (Nadkarni & Narayanan, in press). The content refers to the meaning of specific concepts embedded in a causal map, and the structure reflects the organization of the concepts in a map. In addition to these two
Copyright © 2005, Idea Group Inc. Copying or distributing in print or electronic forms without written permission of Idea Group Inc. is prohibited.

Causal Mapping 37
aspects, some researchers have begun to address the behavioral aspects of causal maps. Behavior (as defined in Chapter I) asks the question, once we understand what the map is telling us, can we use the map to make predictions? Toward the end of the book we propose approaches to study the behavior of causal maps. In this chapter I focus on the content and structural aspects only.
Content
The content of a causal map captures the meaning of specific concepts embedded in a causal map, and provides rich insights into the meaning embedded in the map. For example from Figure 4 we can see there are four concepts in the map. I could say that object-oriented software development is constituted by four concepts: objects, methods, object-oriented development and identifying objects. The definition of each of these concepts would be discussed in detail along with the implications of the causal connections. For example, the connection between object and method could be informed by quotes from the interviews and compared against existing theory (if applicable). In the discovery and evocative contexts, description of the content is of primary importance. In hypothesis testing and intervention, the content analysis plays a lesser role, because the analysis is strongly informed by existing theory.
Structure
The structure of a causal map reflects the organization of the concepts in a map. Since most techniques used to analyze content lack a quantitative mechanism for comparing causal maps, researchers have used structural measures of causal maps in comparative studies linking causal maps to other relevant constructs. Most of the measures focus on some aspect of the complexity of the map drawing on the assumption that the higher the complexity of the map, the higher the level of cognition of the individual.
From the map in Figure 4 you can see that there are four concepts (represented as a term enclosed in a box) and three linkages (lines with arrowheads) in the map. The three causal linkages are from object to method, object to object-oriented development and from object-oriented development to identifying objects. The concepts that have all arrows terminating into the concept are effect-only concepts (e.g., method), whereas the concepts with all arrows originating from the concept are cause-only concepts (e.g., object).
As mentioned previously, in some instances there are mutually connected concepts. When two concepts are mutually connected, the concepts are causally connected in both directions (the two concepts are both causes and effects of each other). Mutually connected concepts are represented as a two-headed arrow. This reciprocal relationship indicates that these concepts are closely intertwined and form a system within the map.
In addition to the concepts and linkages, measures are utilized to operationalize the structural properties of the causal maps. Many of the measures are adapted from the social network field (Knoke & Kulkinski, 1982) and the applicability of each measure is
Copyright © 2005, Idea Group Inc. Copying or distributing in print or electronic forms without written permission of Idea Group Inc. is prohibited.

38 Armstrong
based on the research context used. The measures listed here are not exhaustive, but exemplars for researchers to contemplate using in their causal mapping endeavors. Table 9 lists the measures and a brief description.
Comprehensiveness is a characteristic of the overall map and is a measure of the number of concepts in the map (Carley & Palmquist, 1992). This measure can be used for comparisons between maps. The more comprehensive the map, the more complex the cognition (Nelson et al., 2000). Density is a characteristic of the overall maps and is a measure of how connected the concepts in the map are. Density is a proportion that is calculated as the number of linkages between the concepts divided by the number of
Table 9. Sample causal mapping measures
Measure |
Definition |
Comprehensiveness |
Number of concepts included in the map (Carley and Palmquist, 1992); applicable |
|
at the overall map level |
Density |
Ratio of links between a concept and the total concepts in the map (Carley and |
|
Palmquist, 1992); applicable at the overall map level |
Centrality |
Reflects how central or involved the concept/construct is to the map; a ratio of the |
|
aggregate of linkages involving the concept/construct divided by the total linkages |
|
in the map (Knoke and Kuklinski, 1982); applicable at the concept/construct level |
Note: These measures can be used at both the concept and construct level
Figure 7. Sample density measure |
|
|
|
Participant A |
|
|
|
Method |
Density = |
number of links in map |
|
|
number of concepts in map |
||
|
|
||
Object |
|
|
|
OO Development |
|
|
3 |
|
Density-1A = |
|
= .75 |
|
|
|
4 |
Identifying |
|
|
|
Objects |
|
|
|
Participant B |
|
|
|
Method |
Density-1B = |
6 |
|
Object |
= 1.50 |
||
|
|
4 |
|
OO Development |
|
|
|
Identifying |
|
|
|
Objects |
|
|
|
Copyright © 2005, Idea Group Inc. Copying or distributing in print or electronic forms without written permission of Idea Group Inc. is prohibited.
Causal Mapping 39
concepts in the map. There is another density measure that has been used which is a proportion that is calculated as the number of all linkages occurring in the matrix divided by the number of all possible linkages (Knoke & Kuklinski, 1982). In both cases, the higher the ratio, the denser the map and the higher level of cognitive complexity (Nadkarni, 2003). Figure 7 provides a sample density calculation.
Centrality is a measure used for the individual concepts/constructs within a map. It is a measure of how central or involved the concept/construct is to the map, and reflects the degree of hierarchy characterizing the map. Centrality is a ratio of the aggregate of linkages involving the concept/construct divided by the total linkages in the matrix (Knoke & Kuklinski, 1982). Figure 8 provides a sample centrality calculation.
As stated previously, the structural analysis of causal maps differs for each of the research contexts. In the discovery context, the purpose of causal mapping is to identify patterns and describe aspects of the phenomenon. In an evocative setting, the goal is to develop domain specific theory. In theory testing the goal is to confirm/dispute/ expand existing theory. Lastly, in an intervention setting, the goal is to create consensus around a course of action or issue at hand. With each research setting a different analysis protocol is appropriate. In a discovery setting, the analysis would take on the form of description, relying heavily on the content aspects and identifying which concepts are linked. In an evocative setting, the analysis would be concerned with both the content and the structural aspects. It is through understanding the linkages between the
Figure 8. Sample concept centrality measure
Participant A |
|
|
|
|
|
Centrality (C) = |
In-degree + Out-degree |
||
Method |
|
|
||
|
Total Number of Linkages |
|||
Object |
|
|
|
|
OO Development |
CObject = |
0 + 2 |
= .66 |
|
|
3 |
|||
|
|
|||
Identifying |
CMethod = |
0 + 1 |
= .33 |
|
3 |
||||
Objects |
|
|
||
|
1 |
2 |
3 |
4 |
Out-degree |
|||
|
|
|
|
|
|
|
|
|
Object |
- |
1 |
1 |
0 |
|
|
|
|
|
2 |
|
||||||
|
|
|
|
|
|
|
|
|
Method |
0 |
- |
0 |
0 |
0 |
|
||
|
|
|
|
|
|
|
|
|
OO Development |
0 |
0 |
- |
1 |
1 |
|
||
|
|
|
|
|
|
|
|
|
Identifying Objects |
0 |
0 |
0 |
- |
0 |
|
||
|
|
|
|
|
|
|
|
|
In-degree |
|
|
1 |
1 |
1 |
|
|
|
|
0 |
|
3 |
|
||||
|
|
|
|
|
|
|
|
|
Copyright © 2005, Idea Group Inc. Copying or distributing in print or electronic forms without written permission of Idea Group Inc. is prohibited.