

Narayanan V.K., Armstrong D.J. - Causal Mapping for Research in Information Technology (2005)(en)
.pdf20 Armstrong
Chapter II
Causal Mapping:
A Discussion and
Demonstration
Deborah J. Armstrong
University of Arkansas, USA
Abstract
Causal mapping is a technique that can be used to represent cognition because it captures the structure of the causal assertions of an individual or group. As causal mapping becomes more prominent in the IS field, it is important that we understand the method, its strengths and limitations and its place within the spectrum of available research methods. Many researchers have made assumptions (both explicit and implicit) regarding causal mapping, without explicating the steps involved. This chapter details the causal mapping (CM) process and decisions that must be addressed so that researchers and practitioners can utilize this method to understand IS issues from a cognitive perspective, as well as provoke interest in expanding the boundaries of the CM method within the IS field.
Introduction
The growing interest in the cognitive foundations of behavior within the information systems (IS) field has led to a focus on representing and analyzing the cognitions of individuals and groups. Cognitive representations are created by eliciting the relevant
Copyright © 2005, Idea Group Inc. Copying or distributing in print or electronic forms without written permission of Idea Group Inc. is prohibited.

Causal Mapping 21
cognitions of the participants and casting their cognitions into appropriate structural representations. Over the years there have been numerous methods of representing cognition that have been used, such as: argument mapping (Fletcher & Huff, 1990), context analysis (e.g., Birnhaum-More & Weiss, 1990), repertory grid (e.g., Tan & Hunter, 2002), and the Self-Q technique (e.g., Bougon, Weick & Binkhorst, 1977) to name a few.
Causal mapping is an additional technique that can be used to represent cognition. Causal mapping captures the structure of the causal assertions of an individual or group. Many believe that causal mapping holds great promise in addressing phenomena from a cognitive perspective, which is an under-utilized lens in the IS field. As we move causal mapping into the IS field, it is important that we understand the method, its strengths and limitations and place it within the spectrum of research methods. Many researchers have made assumptions (both explicit and implicit) regarding causal mapping, without explicating the steps involved. Thus buried in many of the studies found in the literature are the steps used to develop the cognitive representations of participants.
This chapter seeks to explicate the causal mapping (CM) process so that researchers and practitioners can utilize this method to address IS issues within organizations using a cognitive lens. The objectives of the chapter are two-fold:
•To demonstrate in detail how CM can be used to understand IS issues from a cognitive perspective
•To provoke interest in expanding the boundaries of the CM method within the IS field as we present advances and issues related to CM
In the remainder of the chapter, I provide the motivation behind causal mapping research and detail the causal mapping approach for both capturing individual maps and deriving collective causal maps. Next, I detail the representation and analysis of the maps, and discuss some key issues to address when reporting the results. I conclude the chapter with a summary of the key decision points researchers will face when conducting causal mapping research.
Selecting a Causal Mapping Approach
What are Causal Maps?
As Axelrod (1976) tells us, a cognitive map is a way of representing a person’s assertions regarding a domain. A cognitive map is designed to capture the structure of the causal assertions of a person with respect to a particular domain. Over the years the concept of a cognitive map has been refined and is used here as a general class of representations of thoughts or beliefs. These maps can represent individual assertions, or those elicited from a group (Huff, 1990; Montazemi & Conrath, 1986).
Copyright © 2005, Idea Group Inc. Copying or distributing in print or electronic forms without written permission of Idea Group Inc. is prohibited.

22 Armstrong
A causal map is a sub-class of cognitive maps that focuses on the representation of causal beliefs; a network of causal relations embedded in an individual’s statements, which is used to create an explicit cognitive representation (Huff, 1990; Nelson, Nadkarni, Narayanan & Ghods, 2000). A causal map is a collection of techniques used to explicate and assess the structure and content of mental models (Axelrod, 1976; Fiol & Huff, 1992). This allows the researcher to capture the cognitive structure of an individual by representing how domain knowledge is linked in his or her mind (Carley & Palmquist, 1992; Eden, Ackerman & Cropper, 1992).
A revealed causal map is the assertions of causality the participant chooses to reveal to the world (Narayanan & Fahey, 1990). With revealed causal mapping you are not assuming or implying that the representation elicited is in fact the “true” cognition of the individual. With revealed causal mapping you are explicitly stating that there is some gap between the representation evoked and the true cognition of the individual, because what has been captured is only what the participant was willing to reveal.
Why Use Causal Mapping?
Causal mapping (CM) is used to study cognition and the cognitive structure of individuals in a specific domain. Researchers employ CM to elicit a cognitive representation of interlinked concepts embedded in the knowledge and/or expertise of the participants around a domain. CM promotes understanding of the complexity of individuals’ (and groups’) knowledge base and belief structure (Kemmerer, Buche & Narayanan, 2001). The maps provide a frame of reference for understanding both what the participant knows and exhibits and the reasoning behind his or her actions.
As stated previously, there are several research contexts in which causal mapping can be utilized (see Chapter 1 for detailed discussion). In a discovery setting, the goal of using causal mapping is to discover commonalities in participants in search of possible patterns in the data elicited. In an evocative setting the goal is to develop mid-range theory to capture the cognitive aspects of expertise in the domain of interest. In a theory testing setting, the goal is to confirm, dispute, or expand existing theory. Lastly, in an intervention setting, the goal is often to create consensus around a course of action or issue at hand.
Types of Causal Maps
Mohammed, Klimoski and Rentsch (2000) have recently looked at four techniques for measuring mental models: Pathfinder Associative Networks, Multidimensional Scaling, Interactively Elicited Causal Maps and Text Based Causal Maps. The Pathfinder Associative Network (PAN) is a technique intended to produce a network structure in which the map nodes are the concepts and the linkages are the relatedness of the concepts (Schvaneveldt, 1990). Multidimensional Scaling (MDS) is a set of models that represents proximity data spatially (Carroll & Arabie, 1980, found in Mohammed et al., 2000). MDS uses geometric distance to identify the underlying dimensions of cognitive
Copyright © 2005, Idea Group Inc. Copying or distributing in print or electronic forms without written permission of Idea Group Inc. is prohibited.

Causal Mapping 23
structure (Mohammed, et al., 2000). See Table 1 for a comparative summary of these methods.
Prior to creating revealed causal maps, a data source is selected and narratives are gathered. Although Mohammed et al. (2000) sees Interactively Elicited Causal Maps and Text Based Causal Maps as different techniques for measuring mental models, I see them as variants of the same technique. I argue that they are two data collection methods under the causal mapping technique. Data collection (elicitation of maps) can be accomplished in one of two ways: interviews (interactively elicited causal maps) or through archival texts such as annual reports (text-based causal maps). Interactively elicited causal maps (IECM) are developed from direct interaction with the participants to collect the data. Text-based causal maps (TBCM) are developed from documents or transcripts created for another purpose. The causal mapping data collection methods (IECM and TBCM) are detailed below.
Interview Method (IECM)
The researcher’s goal is to gather participants’ knowledge or beliefs and cast it into cognitive structures pertaining to a specific domain. The task is to access relevant participants and assist them in articulating their sometimes tacit knowledge or beliefs. Individuals serve as the data source and the narratives are gathered through interviews (ranging from unstructured to structured), which are discussed later in this section.
Sampling
One option is to use random sampling, which is particularly useful when engaging in studies from a social constructionist perspective. From this perspective, expertise is
Table 1. Mental model measurement techniques
Dimension |
PAN |
MDS |
IECM |
TBCM |
Content |
Fixed and supplied |
Fixed and supplied |
Variable and |
Variable and |
|
by the researcher, |
by the researcher, |
supplied by |
supplied by |
|
low emphasis |
low emphasis |
participant, high |
participant, high |
|
|
|
emphasis |
emphasis |
Structure |
Associative explicit |
Associative explicit |
Causal explicit |
Causal inferred |
|
linkages, high |
linkages, high |
linkages, high |
linkages, high |
|
emphasis |
emphasis |
emphasis |
emphasis |
Researcher |
Low |
Moderate |
High |
High |
Skill |
|
|
|
|
Participant |
Moderate |
Moderate |
High |
None |
Demands |
|
|
|
|
Model |
Easy |
Easy |
Difficult |
Difficult |
Comparisons |
|
|
|
|
Adapted from Mohammed, Klimoski and Rentsch (2000)
PAN = Pathfinder Associative Network; MDS = Multidimensional Scaling; IECM = Interactively Elicited Causal Map; TBCM = Text-Based Causal Map
Copyright © 2005, Idea Group Inc. Copying or distributing in print or electronic forms without written permission of Idea Group Inc. is prohibited.

24 Armstrong
uniformly distributed and therefore random sampling is an appropriate method of identifying participants in a study. In expert-anchored studies a snowball technique (Shanteau, 1987, 1992) with convenience sampling (Stone, 1978) is often used. Snowball sampling becomes necessary when experts of a domain cannot easily be located by random sampling or by screening, where domain knowledge (expertise) is important, and where the members of a domain are known to one another (Simon & Burstein, 1985). The snowball technique asserts that those individuals closest to a domain are appropriate to define the experts of that domain (Shanteau, 1987, 1992). An initial participant is chosen and additional participants are obtained from information provided by the initial participant. One expert identifies another and that expert identifies another, and so on. Once identified, each expert is interviewed (Axelrod, 1976; Huff, 1990).
Interview Protocol
The interview process may consist of fairly structured interviews (Bougon, 1983), semistructured interviews, unstructured interviews depending on the research context. See Table 2 for a listing of appropriate data collection methods for each research context. An interview guide is developed by the researcher to facilitate the interview process. When developing the interview guide the researcher should be cognizant of several factors, such as the research context, the specific domain under study and the respondent pool. Readers wishing guidance in developing an interview guide may wish to see: Bradburn (1979); Kvale (1996); Payne (1951); and Rubin and Rubin (2004). Based on the participant’s answer to the question, follow-up probes may be asked to elicit further details regarding the participants’ thought process. The interviews are then transcribed verbatim into a document format (e.g., Microsoft Word).
Point of Redundancy
Within the CM method, the researcher should interview to the point of redundancy, which determines the adequacy of the sample size (Axelrod, 1976). In causal mapping research the point of redundancy, or saturation, represents the point at which further data collection would not lead to the identification of additional concepts. As the concepts emerge from the participants rather than being imposed by the researchers, this point serves as a way of establishing the adequacy of the sample. The point of redundancy
Table 2. IECM data collection methods
Research Context |
Data Collection Methods |
Discovery |
Unstructured interviews |
Evocative |
Unstructured or semi-structured interviews |
Hypothesis Testing |
Semi-structured or structured interviews |
Intervention |
Structured interviews |
Copyright © 2005, Idea Group Inc. Copying or distributing in print or electronic forms without written permission of Idea Group Inc. is prohibited.

Causal Mapping 25
is operationalized by aggregating the concepts mentioned by each participant (Nelson et al., 2000).
The participant’s text (interview transcript) is reviewed and the number of concepts elicited is graphed (the X axis is the participant number and the Y axis is the running total of the number of concepts). The next participant text is reviewed, the number of additional concepts identified is added to the number from the first text, and the result is graphed. This process continues until all of the texts have been reviewed and the concepts elicited are identified. The difficulty is that the point of redundancy is not calculated until after the interviews have been completed and the classification scheme has been developed. If redundancy is not reached, additional interviews would have to be conducted. The same process would be used until redundancy is reached.
For example, if you identify ten concepts for the first participant, a point would be plotted on the graph at (1,10). If you identify an additional eight concepts for the second participant a point would be plotted on the graph at (2, 18), and so on. No additional concepts are elicited from participants 19 and 20, so the point of redundancy is reached by the 18th participant. See Figure 1 for a graphical representation.
Figure 1. Point of redundancy
|
|
|
|
|
|
|
|
|
|
|
|
|
|
Point of Redundancy |
|
|||||
Concepts |
80 |
|
|
|
|
|
|
|
|
|
|
|
|
|
|
|
|
|
|
|
70 |
|
|
|
|
|
|
|
|
|
|
|
|
|
|
|
|
|
|
|
|
60 |
|
|
|
|
|
|
|
|
|
|
|
|
|
|
|
|
|
|
|
|
50 |
|
|
|
|
|
|
|
|
|
|
|
|
|
|
|
|
|
|
|
|
of |
|
|
|
|
|
|
|
|
|
|
|
|
|
|
|
|
|
|
|
|
40 |
|
|
|
|
|
|
|
|
|
|
|
|
|
|
|
|
|
|
|
|
Number |
|
|
|
|
|
|
|
|
|
|
|
|
|
|
|
|
|
|
|
|
30 |
|
|
|
|
|
|
|
|
|
|
|
|
|
|
|
|
|
|
|
|
20 |
|
|
|
|
|
|
|
|
|
|
|
|
|
|
|
|
|
|
|
|
Total |
|
|
|
|
|
|
|
|
|
|
|
|
|
|
|
|
|
|
|
|
10 |
|
|
|
|
|
|
|
|
|
|
|
|
|
|
|
|
|
|
|
|
|
0 |
|
|
|
|
|
|
|
|
|
|
|
|
|
|
|
|
|
|
|
|
1 |
2 |
3 |
4 |
5 |
6 |
7 |
8 |
9 |
10 |
11 |
12 |
13 |
14 |
15 |
16 |
17 |
18 |
19 |
20 |
|
|
|
|
|
|
|
|
|
|
Participant |
|
|
|
|
|
|
|
|
||
Data for Figure 1
Participant |
Unique Concepts Identified |
Total Concepts |
1 |
10 |
10 |
2 |
8 |
18 |
3 |
7 |
25 |
4 |
7 |
32 |
5 |
5 |
37 |
… |
… |
… |
15 |
1 |
63 |
16 |
2 |
65 |
17 |
1 |
66 |
18 |
1 |
67 |
19 |
0 |
67 |
20 |
0 |
67 |
Copyright © 2005, Idea Group Inc. Copying or distributing in print or electronic forms without written permission of Idea Group Inc. is prohibited.

26 Armstrong
Text-Based Method (TBCM)
Text-Based Causal Maps rely on non-invasive data collection techniques that avoid the recall biases of interviews (Axelrod, 1976). The researcher’s goal is still to gather knowledge or beliefs and cast it into cognitive structure pertaining to a specific domain. The task with TBCMs is to determine the appropriate source of information and gather the data from that source. TBCMs have been found to be more economical in terms of time and effort required of researchers and subjects (Brown, 1992). Data sources for textbased causal mapping include any complex text (e.g., annual reports, case analysis, IS change request documentation, and legal decisions). TBCMs are particularly appropriate for longitudinal studies because they do not depend upon participants who may not be accessible, or whose memories may have faded with regard to the event under study (Narayanan & Fahey, 1990).
Sampling
The major challenge of using TBCM lies in defining the sample. There are several different sampling frames that may be used with TBCMs, including: (1) convenience, (2) random and (3) exhaustive.
1.The first type of sampling frame is the convenience sample. With a convenience sample, the researcher utilizes the statements/texts that are readily available to the researcher. For example, a researcher may be interested in the impact of a new product release, so he or she may use the press releases associated with the new product.
2.A second type of sampling frame is the random sample. Random sampling is useful when using public statements (e.g., annual reports), or when the universe of statements is quite vast and is difficult to specify with any degree of certainty. The researcher often must adopt some rules to determine which statements to sample. Although random sampling of statements may insure greater representativeness, problems of defining the universe render such sampling difficult. When using this method the researcher should try to explicate a priori decision rules regarding the choice of data sources. Examples of these decision rules include outlining a time unit to sample (e.g., month, year), number of data sources to utilize (if multiple sources are available).
3.A third type of sampling is exhaustive, in which the entire universe can be captured. This sampling frame is often used in a tightly controlled environment, such as a case study with a specified respondent pool (e.g., Nadkarni, 2003).
Point of Redundancy
The point of redundancy is only applicable to TBCM projects when using a convenience sample. If a convenience sample is used the point of redundancy should be calculated as previously indicated.
Copyright © 2005, Idea Group Inc. Copying or distributing in print or electronic forms without written permission of Idea Group Inc. is prohibited.

Causal Mapping 27
Deriving Causal Maps
There are several terms used in the causal mapping process that require explication and will help set the context for the following discussions. See Table 3 for a listing of the basic causal mapping terms and corresponding definitions.
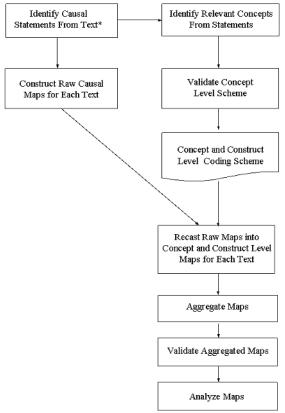
Figure 2 provides a flow chart of a revealed causal mapping process based on the process developed by Narayanan and Fahey (1990) and Nelson et al. (2000). Each phase in the process is described in the following text.
Step 1: Identify Causal Statements
The first task is to identify the causal statements from the documents (e.g., interview transcripts or annual reports) (Axelrod, 1976). This process involves identifying the cause and effect phrases and the linkage between them. Causal statements are statements that imply a cause-effect relationship. Some of the key words used in identifying explicit causal statements are “if-then,” “because,” and “so” (Axelrod, 1976). In addition to explicit causal statements, according to Axelrod (1976), there are also implicit relationships found in causal statements. The phrase may not contain the traditional key words used to identify causal statements, but the causality of the sentence is clear within the context of the text. Some “key words” that have been used in identifying implicit causal statements are “think,” “know,” “use,” and “believe”. For example, the sentence “If I want to get beyond where I am today, then am I going to have to go outside of the business?” could be coded as an explicit statement since it contains the words “if” and “then.” Additionally, the sentence “I don’t think gender should be an issue, I would promote whoever is smartest” can be coded as an implicit statement. The statements in the form of concepts and cause-effect relationships are captured in the language of the
Table 3. Causal mapping definitions
Term |
Definition |
Causal Map |
A network of causal assertions (cause/link/effect) that can be |
|
expressed in a matrix or diagram form. |
Causal Statement |
A statement (phrase or sentence) that contains a casual assertion, most |
|
generally of the form cause/link/effect. |
Coding Scheme |
A dictionary of terms (concepts or constructs) and definitions of those |
|
terms (concepts or constructs). The coding scheme is used to simplify |
|
the causal statements and corresponding maps. |
Concept |
A word or phrase that captures the meaning or essence of a |
|
participant’s phrase. |
Construct |
A word or phrase that captures the meaning or essence of a group of |
|
concepts. |
Link |
The relationship or causal belief between two concepts (or constructs). |
Raw Causal Map |
A causal map in which the concepts (constructs) are represented in the |
|
language of the participant. |
Raw Causal Statement |
A causal statement that is captured in the language of the participant. |
Revealed Causal Map |
The assertions of causality the participant chooses to reveal to the |
|
world. |
Copyright © 2005, Idea Group Inc. Copying or distributing in print or electronic forms without written permission of Idea Group Inc. is prohibited.
28 Armstrong
Figure 2. Revealed causal mapping process
*The term “text” is used to represent both IECM transcripts and TBCM texts.
participants (Narayanan & Fahey, 1990). Other examples of causal statements would include:
1.Object-oriented development is easy because you think of everything as an object.
2.If I’ve got this object built up then I go back and actually try to write some of the methods.
3.Once I have all of the information I need I think about what are the objects that will be needed.
Depending on the type of data collection, IECM or TBCM, the coding process will differ. If you are using TBCM, generally you are using public documents (e.g., annual reports), which have been carefully crafted. The author of the document has (most likely) placed emphasis on the sentence construction, grammar and intended meaning of each sentence. In this context, the causal statements should be relatively clear and straightforward.
Copyright © 2005, Idea Group Inc. Copying or distributing in print or electronic forms without written permission of Idea Group Inc. is prohibited.

Causal Mapping 29
In contrast, if you are using IECM, the causal statements are often difficult to discern (Kemmerer, Buche & Narayanan, 2001). In this case the participant sample plays a large role in the ease (or difficulty) of coding. For example, if you are speaking to IS personnel regarding their current project, they are usually quite articulate. In contrast, if your research sample consists of IS students discussing a very technical topic, or respondents discussing a sensitive topic (e.g., layoffs) the participants may have difficulty expressing themselves. In addition, you will probably have several “starts and stops” within the transcript. By this I mean an individual will begin to speak, stop and then restart with the thought. This can present challenges when coding the transcript. In this case, it is up to the researcher to discern the causal statement (if any) in the text. It is often helpful to have an audio recording (if possible) to listen to the tone of the participant in addition to the words.
Identification Rules
The guidelines, which have been adapted from Axelrod (1976), are provided to show researchers how causal maps can be derived from texts. The coder must scrutinize the text to record all cause-effect relationships within the text. The sentences or phrases that are of interest to the coder are those that assert a causal relationship (A affects B). To appropriately identify the causal statements the researcher needs a set of decision rules to help guide the process. The rules are:
1.Some relationships are implicit in the phrase or sentence and a cause/effect relationship cannot be found in the structure of the phrase. In this case the coder should ask herself if the phrase implies a relationship between variables. If yes, then the phrase should be coded as a causal statement (be careful not to insert bias into coding implicit statements to create assertions).
2.It is important to maintain the original language of the participants as faithfully as possible.
3.It is important to reflect the speaker’s statement in kind and number. If a speaker states a relationship more than once, the coder should note the relationship each time it is mentioned.
4.If a speaker agrees with an assertion made by someone else the coder should pay close attention to the speaker’s wording. If the speaker is agreeing with the assertion then it is recorded as a causal statement. If the speaker is merely acknowledging the statement then it is not coded.
5.Assertions should be made within a sentence or two at most. Do not look for assertions by linking paragraphs.
In addition to these basic guidelines, Wrightson (1976) has provided a listing of the structural relationships that may be found within a text and how they should be coded. See Appendix A for an adapted (and abbreviated) sample of these structures.
Copyright © 2005, Idea Group Inc. Copying or distributing in print or electronic forms without written permission of Idea Group Inc. is prohibited.