

Kleiber - Applied econometrics in R
.pdf923 Linear Regression
5.Use the PSID1982 data and consider the following two nonnested models (compare with Baltagi 2002, p. 230):
M1 : log(wage) = β0 + β1education + β2experience + β3experience2 +β4weeks + β5married + β6gender
+β7ethnicity + β8union + "
M2 : log(wage) = β0 + β1education + β2experience + β3experience2 +β4weeks + β5occupation + β6south
+β7smsa + β8industry +
(a)Compute the J tests for M1 vs. M2 and M2 vs. M1, respectively.
(b)Both M1 and M2 can be artificially nested within a larger model. Use an F test for M1 versus this augmented model. Repeat for M2 versus the augmented model. What do you conclude?
6.The estimator of Hausman and Taylor (1981) is appropriate when only some of the individual e ects in a panel regression are endogenous. Employ this estimator on a wage equation for the PSID1982 data using all 12 regressors appearing in the preceding exercise. Note that you will have to enter all exogenous variables as instruments for themselves.
(a)Consider the regressors experience, experience^2, occupation, industry, union, and education as endogenous (as do Cornwell and Rupert 1988).
(b)Consider the regressors experience, experience^2, weeks, married, union, and education as endogenous (as do Baltagi and Khanti-Akom 1990; Baltagi 2005, Table 7.4).
(c)Which estimates do you consider more plausible?
7.The function gls() from the package nlme will fit one of the classical
econometric regression models, the linear regression model yi = x>i β + "i with AR(1) disturbances, "i = φ"i−1 + i, where i (0, σ2) i.i.d. and |φ| < 1, albeit by maximum likelihood, not by least-squares techniques. Select one of the firms from the Grunfeld data and estimate this model. What is the amount of first-order autocorrelation?
8.Find a way of estimating the SUR model from Section 3.7 using the plm package.
9.The function ivreg() from package AER will fit instrumental variable (IV) regressions. Using the USConsump1993 data taken from Baltagi (2002), estimate the simple Keynesian consumption function
expendituret = β0 + β1incomet + "t
(a)by OLS.
(b)by IV. The only available instrument is investment, given by the identity expenditure + investment = income.
(c)Compare both sets of estimates using a Hausman test, thus replicating Baltagi (2002, Section 11.7). What do you conclude?

4
Diagnostics and Alternative Methods of
Regression
The techniques presented in the preceding chapter tell only part of the story of regression analysis. On the one hand, all of the estimates, tests, and other summaries are computed as if the model and its assumptions were correct, but on the other, there exist various regression methods apart from OLS, some of which are more appropriate in certain applications.
Here, we discuss several approaches to validating linear regression models:
•A popular approach (on occasion somewhat misleading) compares various statistics computed for the full data set with those obtained from deleting single observations. This is known as regression diagnostics.
•In econometrics, diagnostic tests have played a prominent role since about 1980. The most important alternative hypotheses are heteroskedasticity, autocorrelation, and misspecification of the functional form.
•Also, the impenetrable disturbance structures typically present in observational data have led to the development of “robust” covariance matrix estimators, a number of which have become available during the last 20 years.
This chapter provides a brief introduction to all three approaches. It turns out that graphical techniques are often quite e ective at revealing structure that one may not have suspected.
Furthermore, resistant (in the sense of resistance to outliers and unusual observations) regression techniques are often quite helpful, although such methods do not appear to be as widely known among econometricians as they deserve to be. We also include a brief introduction to quantile regression, a method that has been receiving increasing interest in applied econometrics, especially in labor economics.
C. Kleiber, A. Zeileis, Applied Econometrics with R,
DOI: 10.1007/978-0-387-77318-6 4, © Springer Science+Business Media, LLC 2008
94 4 Diagnostics and Alternative Methods of Regression
4.1 Regression Diagnostics
There is extensive literature on examining the fit of linear regression models, mostly under the label “regression diagnostics”. The goal is to find points that are not fitted as well as they should be or have undue influence on the fitting of the model. The techniques associated with Belsley, Kuh, and Welsch (1980) based on deletion of observations are widely available in statistical software packages, and R is no exception.
This topic provides an excellent opportunity to further illustrate some basic aspects of R programming, showing that variations on available functions or plots are easily constructed with just a few lines of code. For illustration, we consider the PublicSchools data from the sandwich package, taken from Greene (1993). They provide, for the 50 states of the United States of America and for Washington, DC, per capita Expenditure on public schools and per capita Income by state, all for the year 1979:
R> data("PublicSchools")
R> summary(PublicSchools)
Expenditure |
|
Income |
|
Min. |
:259 |
Min. |
: 5736 |
1st Qu.:315 |
1st Qu.: 6670 |
||
Median :354 |
Median : 7597 |
||
Mean |
:373 |
Mean |
: 7608 |
3rd Qu.:426 |
3rd Qu.: 8286 |
||
Max. |
:821 |
Max. |
:10851 |
NA's |
: 1 |
|
|
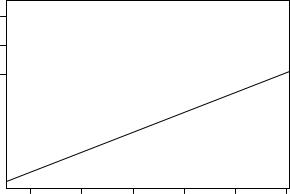
We first omit the incomplete observations using na.omit()—this a ects only Wisconsin, where Expenditure is not available. Subsequently, we generate a scatterplot with a fitted linear model, in which three observations are highlighted:
R> ps <- na.omit(PublicSchools) R> ps$Income <- ps$Income / 10000
R> plot(Expenditure ~ Income, data = ps, ylim = c(230, 830)) R> ps_lm <- lm(Expenditure ~ Income, data = ps)
R> abline(ps_lm)
R> id <- c(2, 24, 48)
R> text(ps[id, 2:1], rownames(ps)[id], pos = 1, xpd = TRUE)
The resulting plot in Figure 4.1 shows that there is a positive relationship between expenditure and income; however, Alaska seems to be a dominant observation in that it is far away from the bulk of the data. Two further observations, Washington, DC, and Mississippi, also appear to deserve a closer look. Visual inspection suggests that the OLS regression line is somewhat tilted. We will pursue this issue below.
4.1 Regression Diagnostics |
95 |
|
800 |
|
700 |
Expenditure |
500 600 |
|
400 |
|
300 |
●
Alaska
|
|
|
|
|
|
|
|
|
● |
|
|
|
|
|
|
|
|
● |
● |
|
● |
|
|
|
|
|
|
|
|
|||
|
|
|
|
|
|
|
|
|
||
|
|
|
|
|
|
|
● |
|
|
|
|
|
|
|
|
● |
|
● |
|
|
|
|
|
|
|
● |
|
● ● |
● ● ●● |
● |
||
|
|
|
|
|
● |
● |
●● |
|
Washington DC |
|
|
|
|
● |
|
|
|
● |
|||
|
|
|
|
|
|
|
||||
|
|
|
● |
|
● |
● |
|
|
● |
|
|
|
●● ● |
● |
|
● ● ● |
|
|
|
|
|
|
|
● |
●● |
●● ●● |
|
|
|
|||
|
|
|
|
|
● |
● |
|
|
|
|
|
|
|
|
|
|
|
|
|
||
|
|
●● |
● |
● |
|
●● |
|
|
|
|
|
|
● |
|
● |
|
|
|
|
|
|
Mississippi |
|
|
|
|
|
|
|
|
||
0.6 |
0.7 |
0.8 |
0.9 |
1.0 |
1.1 |
Income
Fig. 4.1. Per capita expenditure on public schools versus per capita income.
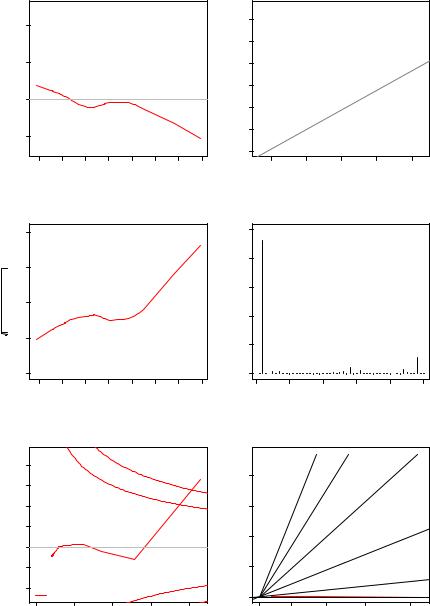
The basic tool for examining the fit is the residuals, and we have already seen that plot() applied to an “lm” object yields several diagnostic plots. Figure 4.2, resulting from
R> plot(ps_lm, which = 1:6)
depicts all six types (currently) available. The default is which = c(1:3,5); i.e., only four are shown.
Specifically, the first plot depicts residuals versus fitted values. It is useful for checking the assumption E("|X) = 0, and it brings out systematic variations in the residuals that suggest that the model is incomplete. The tests and confidence intervals used in summary(ps_lm) are based on the assumption of i.i.d. normal errors. The residuals can be assessed for normality using a QQ plot comparing the residuals to “ideal” normal observations. It plots the ordered residuals against Φ−1 (i/(n + 1)), i = 1, . . . , n, where Φ−1 is the quantile function of the standard normal distribution. The third plot, a scale-location plot, depicts p|rˆi| (for the standardized residuals ri; see below for details) against yˆi. It is useful for checking the assumption that errors are identically distributed, in particular that the variance is homogeneous, Var("|X) = σ2I. The remaining three plots display several combinations of standardized residuals, leverage, and Cook’s distance—these diagnostic measures will be discussed in more detail below.
Thus, Figure 4.2 demonstrates that Alaska stands out in all plots: it has a large residual (top left), and it therefore appears in the upper tail of the
96 4 Diagnostics and Alternative Methods of Regression
Residuals vs Fitted |
Normal Q−Q |
|
200 |
|
|
|
|
|
|
|
|
|
|
Alaska● |
|
4 |
|
|
|
|
Alaska● |
|
|
|
|
|
|
|
|
|
|
|
|
|
|
|
|
|
|
||
Residuals |
0 100 |
|
|
|
|
|
|
|
|
|
|
|
Standardizedresiduals |
3 |
|
|
|
|
|
● |
● |
● |
|
● |
●● |
|
●● ● ● |
|
|
|
10 2 |
|
|
●●●●●● |
|
||||
|
|
|
●Utah |
|
|
|
|
|
|
|
|
|
|
|
|
|
|
|
|
|
|
|
● |
|
● |
|
|
|
|
|
|
|
|
|
|
|
|
|
● |
|
|
|
|
|
|
|
● |
|
|
|
|
|
|
|
|
|
|
||
|
|
|
● |
|
|
|
|
|
● |
|
|
|
|
|
|
|
|
|
● ● ● |
|
|
|
|
|
|
|
● |
|
|
|
|
|
|
|
|
|
|
● |
|
|
|
●● ● ● |
|
|
|
|
● |
● ● |
|
|
|
|
|
|
|
|
|
||
|
|
|
|
|
● |
● |
|
|
|
|
|
|
|
●● |
|
||||
|
|
● |
● |
|
|
|
|
● |
● |
|
|
|
|
|
|
|
|
●●●● |
|
|
|
● |
● |
|
|
|
|
● |
|
|
|
|
|
|
|
|
●●● |
|
|
|
|
|
|
|
|
|
|
|
|
|
|
|
|
|
|
●●● |
|
||
|
|
|
● |
|
|
|
● |
|
● |
|
|
|
|
|
|
|
●●● |
|
|
|
|
|
●● |
|
|
|
● |
● |
|
|
|
|
|
|
|
|
●●●●● |
|
|
|
|
|
|
|
|
|
|
|
|
|
|
|
|
●●● |
|
|
|||
|
|
|
|
|
|
● |
|
|
|
|
|
|
|
|
|
●● |
|
|
|
|
|
|
|
|
● |
● |
●● |
● |
|
|
|
|
|
|
|
●●● |
|
|
|
|
|
|
|
|
|
|
|
|
|
|
|
−1 |
|
●● |
|
|
|||
|
100− |
|
|
|
● |
|
|
Nevada● |
● |
|
|
|
●●● |
|
|
|
|||
|
|
|
|
|
|
|
|
|
|
● ● |
|
|
|
||||||
|
|
|
|
|
|
|
|
|
|
|
|
|
|
|
● |
|
|
|
|
|
|
|
|
|
|
|
|
|
|
|
|
|
|
−2 |
●Nevada |
|
|
|
|
|
|
|
|
|
|
|
|
|
|
|
|
|
|
●Washington DC |
|
|
|
|
|
|
|
250 |
300 |
|
350 |
|
400 |
450 |
500 |
550 |
600 |
|
|
−2 |
−1 |
0 |
1 |
2 |
|
Fitted values |
Theoretical Quantiles |
|
2.0 |
|
|
Scale−Location |
|
|
2.5 |
||||
|
|
|
|
|
|
|
|
|
Alaska● |
||
Standardizedresiduals |
1.0 1.5 |
|
|
|
|
|
|
|
|
distanceCook's |
2.0 |
|
|
● |
● |
● |
|
● |
|
1.0 1.5 |
|||
|
|
|
● |
|
|
|
|
Washington DC● |
|
|
|
|
|
|
|
|
|
|
●Nevada |
|
|
|
|
|
|
|
● |
● |
|
|
|
|
|
|
|
|
|
|
|
● |
● |
|
|
|
|
|
|
|
|
|
|
● |
●● |
|
●● |
|
|
|
|
|
|
|
|
● |
|
|
|
|
|
|
|
|
|
|
● |
● |
● |
|
|
|
|
|
|
|
|
|
●● |
● |
|
|
|
|
|
|
|
|
|
● |
|
● |
|
|
|
|
|
|
|
|
|
● |
|
|
● |
● |
|
|
|
|
|
|
|
● ● |
|
● |
● |
|
|
|
|
||
|
|
|
|
● |
● |
|
|
|
|
|
|
|
|
|
● |
|
|
|
|
|
|
|
|
|
0.5 |
● |
|
● |
● |
● ● |
|
|
|
0.5 |
|
|
|
● |
● |
|
● |
|
|
|
|||
|
|
|
● |
|
|
|
|
|
|
||
|
|
|
● |
|
|
|
|
|
|
|
|
|
|
● |
|
|
|
● |
|
|
|
|
|
|
|
|
|
|
|
|
|
|
|
|
|
|
0.0 |
|
|
● |
|
|
|
|
|
|
0.0 |
|
● |
|
|
|
|
|
|
|
|
||
|
|
250 |
300 |
350 |
400 |
|
450 |
500 |
550 |
600 |
|
Cook's distance
Alaska
Washington DC
Nevada
0 |
10 |
20 |
30 |
40 |
50 |
Fitted values |
Obs. number |
Residuals vs Leverage
|
4 |
|
|
|
|
|
|
|
Alaska● |
|
|
|
|
|
|
|
|
|
|
|
|
|
|
|
|
|
|
|
|
|
|
2.0 |
|
3 |
|
|
|
|
|
|
|
|
|
Standardized residuals |
|
|
|
|
|
|
|
|
1 |
|
|
|
|
|
● |
|
|
|
0.5 |
1.0 1.5 |
|
0 1 2 |
● |
|
● |
|
|
|
Cook'sdistance |
|||
● |
|
|
|
|
|
|||||
|
|
|
|
|
|
|||||
|
|
|
|
● |
|
|
||||
● |
|
|
● |
●● |
|
|
||||
● |
● |
● |
● ● |
|
|
|||||
● |
|
● |
|
|
||||||
● |
|
|
|
● |
|
|||||
● |
● |
● |
|
|
||||||
●● |
|
|
||||||||
|
●● |
|
|
|
||||||
● |
●● ● ● |
|
|
|
||||||
● |
● |
● |
|
|
|
|||||
|
|
● |
|
|
● |
|
|
|
|
|
|
−1 |
●●● |
|
●● |
|
|
|
|
0.5 |
|
|
● |
|
|
|
● |
|
|
|
||
|
|
● |
|
|
|
|
|
|
|
|
|
|
● |
|
|
|
|
|
|
|
|
|
−2 |
|
|
|
|
●Nevada |
|
●Washington DC |
0.5 |
0.0 |
|
|
Cook's distance |
|
|
1 |
|||||
|
|
|
|
|
|
|
|
|
||
|
|
|
|
|
|
|
|
|
|
|
|
|
0.00 |
|
|
0.05 |
0.10 |
0.15 |
0.20 |
|
|
|
|
|
|
|
|
|
Leverage |
|
|
|
Cook's distance vs Leverage
|
|
5 |
|
4 |
3 |
|
|
|
|
|
Alaska● |
|
|
|
|
|
2 |
|
|
|
|
●Washington DC |
1 |
|
●Nevada |
|
|
|
|
● |
●● ●● |
● |
|
|
0 |
●●●●●●●●●●●●●● |
|
|
|||
0 |
0.05 |
|
0.1 |
0.15 |
0.2 |
|
|
|
Leverage |
|
|
Fig. 4.2. Diagnostic plots for the public schools regression.

4.1 Regression Diagnostics |
97 |
empirical distribution of the residuals (top right), it casts doubt on the assumption of homogeneous variances (middle left), it corresponds to an extraordinarily large Cook’s distance (middle and bottom right), and it has the highest leverage (bottom left and right). There are further observations singled out, but none of these are as dominant as Alaska. Clearly, these observations deserve a closer look. To further explore the fit of our model, we briefly review regression diagnostics for linear models.
Leverage and standardized residuals
Recall that least-squares residuals are not independent and that they do not have the same variance. Specifically, if Var("|X) = σ2I, their variancecovariance matrix is Var(ˆ"|X) = σ2(I −H), where H = X(X>X)−1X> is the “hat matrix”.
Basic diagnostics are the diagonal elements hii of H, which in R are provided by the generic function hatvalues(). Since Var(ˆ"i|X) = σ2(1 − hii), observations with large values of hii will have small values of Var(ˆ"i|X), and hence residuals for such observations tend to be close to zero. Therefore, hii is said to measure the leverage of the observation i. The trace of H is k (the number of regressors), and “large” is commonly taken to mean greater than two or three times the average element on the diagonal of H, k/n. Note that the value of hii depends only on X and not on y, and hence leverages contain only partial information about a point. This implies that there are two kinds of high-leverage points: “bad leverage points” and “good leverage points”. The former correspond to observations with large hii and unusual yi; such observations can have a dramatic impact on the fit of a model. The latter correspond to observations with large hii and typical yi; such observations are beneficial because they improve the precision of the estimates.
Figure 4.3, obtained via
R> ps_hat <- hatvalues(ps_lm) R> plot(ps_hat)
R> abline(h = c(1, 3) * mean(ps_hat), col = 2) R> id <- which(ps_hat > 3 * mean(ps_hat))
R> text(id, ps_hat[id], rownames(ps)[id], pos = 1, xpd = TRUE)
depicts the diagonal elements of the hat matrix for the PublicSchools data. Var(ˆ"i|X) = σ2(1 − hii) also suggests the use of
ri = |
σˆp |
"ˆi |
|
|
. |
||
1 − hii |
|||
The ri are the standardized residuals, available via rstandard() in R. (They are referred to as internally studentized residuals by some authors. This should not be confused with the (externally) studentized residuals defined below.) If the model assumptions are correct, Var(ri|X) = 1 and Cor(ri, rj |X) tends to be small.

98 4 Diagnostics and Alternative Methods of Regression
|
0.20 |
|
0.15 |
ps hat |
0.10 |
|
0.05 |
●
Alaska
|
|
|
|
|
|
|
|
|
|
|
|
|
|
|
|
● |
||
|
|
|
|
|
|
|
|
|
|
● |
|
|
|
Washington |
DC |
|||
|
|
|
|
|
|
|
|
|
|
|
|
|
|
|
|
|
||
|
● |
● |
|
|
|
|
|
|
|
● |
|
● |
|
● |
||||
|
● |
|
|
|
|
|
|
|
|
|
|
|||||||
|
● |
|
|
● |
|
● |
|
|
|
|
|
|||||||
|
|
|
● |
|
● |
|
|
● ●● |
● |
|||||||||
|
|
|
|
|
|
|
|
|
|
|
||||||||
|
|
|
● ● |
●● |
●● |
● |
|
|
● |
|
● |
● |
||||||
|
|
|
|
|
●●● ●● |
● ●●● ● ● |
|
|
||||||||||
|
|
● ● |
● |
|
|
|
●●●●●● |
● |
● |
|||||||||
|
|
|
|
|
|
|
|
|
|
|
|
|
|
|
|
|
||
0 |
|
10 |
|
20 |
|
30 |
40 |
|
50 |
|
||||||||
|
|
|
|
|
|
|
|
|
|
Index |
|
|
|
|
|
|
|
|
Fig. 4.3. Diagonal elements of the hat matrix for the public schools data, with their mean and three times their mean as horizontal lines.
Deletion diagnostics
To detect unusual observations, Belsley et al. (1980) propose to compute various leave-one-out (or deletion) diagnostics. Thus, one excludes point i and
ˆ |
and σˆ(i), where the subscript (i) de- |
computes, for example, the estimates β(i) |
|
|
ˆ |
notes that observation i has been excluded. Similarly, yˆ(i) = Xβ(i) denotes the |
|
ˆ |
|
vector of predictions of the yi utilizing β(i). Any observation whose removal |
|
from the data would cause a large change in the fit is considered “influential”. It may or may not have large leverage and may or may not be an outlier, but it will tend to have at least one of these properties.
Following Belsley et al. (1980), basic quantities are
DFFIT i |
= yi − yˆi,(i), |
|||||
DFBETA = |
|
ˆ |
ˆ |
|||
β |
− β(i), |
|||||
COVRATIOi |
= |
det(ˆσ(2i)(X(>i)X(i))−1) |
||||
|
|
|
|
, |
||
|
|
det(ˆσ2(X>X)−1) |
||||
D2 |
= (ˆy − yˆ(i))>(ˆy − yˆ(i)). |
|||||
i |
|
|
|
kσˆ2 |
|
|
|
|
|
|
|||
Here, DFFIT measures the change in the fitted values, while DFBETA measures the changes in the coe cients. COVRATIO considers the change in the

4.1 Regression Diagnostics |
99 |
estimate of the OLS covariance matrix, while the Di2, the Cook’s distances (already encountered in the diagnostic plots in Figure 4.2), are especially popular because they reduce the information to a single value for each observation. Appropriately scaled versions of the first two quantities are called DFFITS and DFBETAS.
All these objects are available in the corresponding R functions dffit(),
dffits(), dfbeta(), dfbetas(), covratio(), and cooks.distance(). In addition, the function rstudent() provides the (externally) studentized residuals
ti = ˆ
σ(i)
alluded to above.
The function influence.measures()
Fortunately, it is not necessary to compute all the preceding quantities separately (although this is possible). R provides the convenience function influence.measures(), which simultaneously calls dfbetas(), dffits(), covratio(), and cooks.distance(), returning a rectangular array of these diagnostics. In addition, it highlights observations that are unusual for at least one of the influence measures. Since the common influence measures are functions of ri and/or hii, which ones to choose is often a matter of taste. Since
R> influence.measures(ps_lm)
provides a rectangular array of size 50 6, we do not show the result. Instead we briefly consider selected aspects.
With two regressors and 50 observations, the average diagonal element of the hat matrix is 0.04. The points with leverage higher than three times the mean leverage can be obtained via
R> which(ps_hat > 3 * mean(ps_hat))
Alaska Washington DC
2 48
This highlights Alaska and Washington, DC; for Alaska, the leverage is even larger than five times the mean (see Figure 4.3).
If the observations that are (potentially) influential according to at least one criterion are desired, use
R> summary(influence.measures(ps_lm))
Potentially influential observations of
lm(formula = Expenditure ~ Income, data = ps) :
100 4 Diagnostics and Alternative Methods of Regression
|
800 |
|
700 |
Expenditure |
500 600 |
|
400 |
|
300 |
●
Alaska
|
|
|
|
|
|
|
|
|
● |
|
|
|
|
|
|
|
|
● |
● |
|
● |
|
|
|
|
|
|
|
|
|||
|
|
|
|
|
|
|
|
|
||
|
|
|
|
|
|
|
● |
|
|
|
|
|
|
|
|
● |
|
● |
|
|
|
|
|
|
|
● |
|
● ● |
● ● ●● |
● |
||
|
|
|
|
|
● |
● |
●● |
|
Washington DC |
|
|
|
|
● |
|
|
|
● |
|||
|
|
|
|
|
|
|
||||
|
|
|
● |
|
● |
● |
|
|
● |
|
|
|
●● ● |
● |
|
● ● ● |
|
|
|
|
|
|
|
● |
●● |
●● ●● |
|
|
|
|||
|
|
|
|
|
● |
● |
|
|
|
|
|
|
|
|
|
|
|
|
|
||
|
|
●● |
● |
● |
|
●● |
|
|
|
|
|
|
● |
|
● |
|
|
|
|
|
|
Mississippi |
|
|
|
|
|
|
|
|
||
0.6 |
0.7 |
0.8 |
0.9 |
1.0 |
1.1 |
Income
Fig. 4.4. Least-squares line with (solid) and without (dashed) Alaska, Mississippi, and Washington, DC.
|
dfb.1_ |
dfb.Incm |
dffit |
cov.r |
cook.d |
hat |
Alaska |
-2.39_* |
2.52_* |
2.65_* |
0.55_* 2.31_* 0.21_* |
||
Mississippi |
0.07 |
-0.07 |
0.08 |
1.14_* |
0.00 |
0.08 |
Washington DC |
0.66 |
-0.71 |
-0.77_* |
1.01 |
0.28 |
0.13_* |
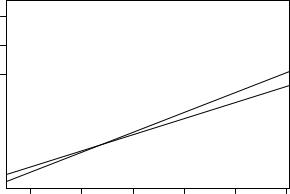
This again points us to Alaska and Washington, DC, and in addition Mississippi, which had been highlighted in Figure 4.1. It is noteworthy that Alaska stands out by any measure of influence. From Figure 4.4, resulting from
R> plot(Expenditure ~ Income, data = ps, ylim = c(230, 830)) R> abline(ps_lm)
R> id <- which(apply(influence.measures(ps_lm)$is.inf, 1, any)) R> text(ps[id, 2:1], rownames(ps)[id], pos = 1, xpd = TRUE)
R> ps_noinf <- lm(Expenditure ~ Income, data = ps[-id,]) R> abline(ps_noinf, lty = 2)
it is clear that this observation is a bad leverage point. To some extent, this is also true for Washington, DC, but here the situation is not nearly as bad as in the case of Alaska. The plot also depicts the least-squares line excluding the three influential points, and it is obvious that it provides a much better summary of the data.
4.2 Diagnostic Tests |
101 |
4.2 Diagnostic Tests
A more formal approach to validating regression models is diagnostic testing. Many cross-section regressions are plagued by heteroskedasticity. Similarly, regression models for time series data should be tested for residual autocorrelation. The package lmtest (Zeileis and Hothorn 2002), originally inspired by the methods discussed in Kramer¨ and Sonnberger (1986), provides a number of tests for both alternatives plus further tests for misspecification of the functional form. A discussion of the underlying theory is provided in Baltagi (2002), Davidson and MacKinnon (2004), and Greene (2003), to mention a few sources. We proceed to the practical aspects of these procedures and refer the reader to these sources for the background formalities.
Almost all of the tests discussed below return an object of class “htest” (standing for hypothesis test), containing the value of the test statistic, the corresponding p value, additional parameters such as degrees of freedom (where appropriate), the name of the tested model, and perhaps the method used if there are several variants of the test.
For cross-section regressions, we return to the Journals data used in the preceding chapter. As before, we set up a reduced data set journals that also contains the age of the journals (for the year 2000, when the data were collected).
R> data("Journals")
R> journals <- Journals[, c("subs", "price")]
R> journals$citeprice <- Journals$price/Journals$citations R> journals$age <- 2000 - Journals$foundingyear
As before, we consider a simple model that explains the logarithm of the number of library subscriptions for a journal by the logarithm of the price per citation.
R> jour_lm <- lm(log(subs) ~ log(citeprice), data = journals)
For a scatterplot of the data and the fitted model, we refer to Figure 3.1.
Testing for heteroskedasticity
For cross-section regressions, the assumption Var("i|xi) = σ2 is typically in doubt. A popular test for checking this assumption is the Breusch-Pagan test (Breusch and Pagan 1979). It fits a linear regression model to the squared residuals "ˆ2i of the model under investigation and rejects if too much of the variance is explained by the additional explanatory variables. For this auxiliary regression, the same explanatory variables X are taken as in the main model. Other strategies could be to use the fitted values yˆi or the original regressors plus squared terms and interactions (White 1980). For our model fitted to the journals data, stored in jour_lm, the diagnostic plots in Figure 3.3 suggest that the variance decreases with the fitted values or, equivalently, it increases