

|
|
N |
H |
|
|
|
|
C |
|
|
|
|
|
C |
|
N |
|
|
|
H |
|
|
|
|
|
N |
H |
N |
|
|
N |
C |
|
|
|
|
|
N |
|
||
|
|
C |
|
|
|
|
|
H |
|
|
|
|
|
N |
H |
|
|
|
|
C |
|
|
|
|
|
C |
N |
|
|
|
|
|
|
||
|
|
H |
|
|
|
|
|
(91) |
|
|
|
|
|
|
|
8′ |
|
|
9 |
|
|
H |
|
N |
8 |
|
|
9′ C |
N |
|
C |
|
|
|
|
|
H |
|
|
|
|
N |
|
|
|
H |
N |
N |
|
|
|
C |
N |
|
C |
|
|
|
|
|
H |
|
|
|
|
N |
|
|
|
H |
|
|
|
|
C |
|
|
|
|
|
|
N |
|
|
C |
|
|
|
|
|
H |
|
|
|
|
|
|
(92) (carotenoid numbering) |
|
|
|
139

140 |
Yoshito Takeuchi and Toshio Takayama |
CHO
OHC
(93)
CHO
OHC
(94)
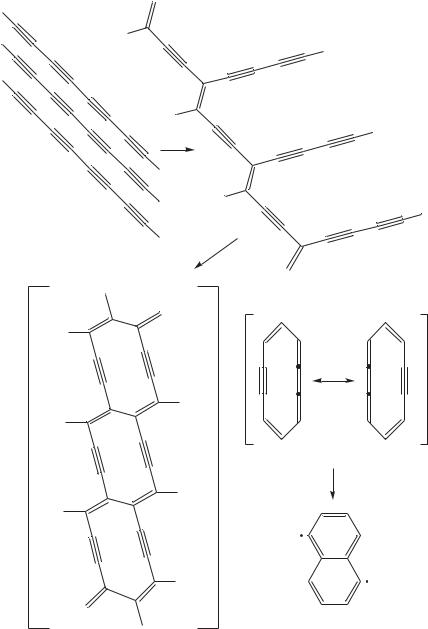
89 and 90 form dinuclear cryptates by complexation of two Cu(I) ions. The crystal structure of the tris-carotenoid 90 confirms that it contains three parallel polyolefinic strands. These substances may formally be considered as prototypes of molecular ‘cables’ formed by three electron-conducting molecular wires. The 1H NMR spectra of the free ligands 89 and 90 and of their complexes 91 and 92 (the darkened circle represents the Cu atom) show notable differences (Figures 33 and 34).
In particular, the CH2CH2 unit of the free ligands 89 and 90 presents signals of the ABCD type, all four protons being different; this indicates an unsymmetrical structure which is also sufficiently rigid so as not to undergo conformational averaging by a twisting motion around the N,N-bridgehead axis. This agrees with the conformation found in the crystal structure when it is motionally frozen on the NMR time scale. High-temperature NMR measurements of 89 in C2D2Cl4 indeed show coalescence of the four CH2CH2 signals at 2.33 and 2.92 ppm and at 3.23 ppm into two broad resonances at ca 2.7 and 3.5 ppm, respectively, with a coalescence temperature of ca 340 K. The corresponding
free energy of activation G6Dc is calculated to be ca 16 kcal mol 1.
In contrast, the CH2CH2 resonances of the corresponding complexes 91 and 92 are of A2X2 type indicating a highly symmetrical averaging by rapid torsional oscillation around the N,N-bridgehead axis. The olefinic protons display a compression of signals into a narrower ppm range, and the CHDN signal undergoes a downfield shift of ca 0.5 ppm on complexation.
In comparison, both the free ligand and the dinuclear Cu(I) cryptate of an analogous macrobicyclic structure possessing a diphenylmethane group as a central unit display only two resonances for the CH2CH2 fragment, as is the case here only for the complexes 91 and 92. This points to the special conformation features of the free macrobicycles 89 and 90.
B. Solid State NMR
1. 13C CP/MAS NMR
Polydiacetylenes are obtained as single crystals by topochemical solid-state polymerization of the monomer single crystal. These compounds have received considerable attention because of their one-dimensionally -conjugated structure. Their unique -electron structures, and therefore superior third-order nonlinear optical properties, have been extensively investigated.

2. NMR spectroscopy of dienes and polyenes |
141 |
(a)
s
7.0 |
6.0 |
5.0 |
4.0 |
3.0 |
2.0 |
|
|
ppm |
|
|
|
s
(b)
8.0 |
7.0 |
6.0 |
5.0 |
4.0 |
3.0 |
2.0 |
|
|
|
ppm |
|
|
|
FIGURE 33. 1H NMR spectra (200 MHz): (a) of cryptand 89 in C2D2Cl4 and (b) of its dinuclear Cu1 complex 91 in CD3CN (s D solvent). Reproduced by permission of Neue Schweizerische Chemische Gesellschaft from Reference 52
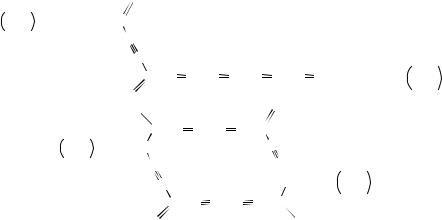
Hayamizu and coworkers53 reported the polymerization of the octatetrayne monomer 15,17,19,21-hexatriacontatetrayne (HTY) (95) to the polydiacetylene 96 with butadiynyl substituents (R D H) as presented in Figure 35 as an example.
It was found that solid-state polymerization of these monomers always proceeds by 1,4- addition. Furthermore, polydiacetylene 96 could be thermally reacted and the structure of the final polymer was proposed to be that of the ladder polymer 97 where the repeating unit is 1,6-didehydro[10]annulene (98), i.e. two conjugated polydiacetylenes. However, the annulene 98 is expected to be unstable. In fact, its cycloaromatization reaction to the 1,5-dehydronaphthalene diradical 99 was recently reported. The instability is considered to be due to in-plane repulsion of the face to face -orbitals at sp-hybridized carbon in the annulene ring. Thus, the final structure of the polymers from octatetrayne derivatives after the thermal reaction may be either a planar cycloaromatized polymer and/or a threedimensional polymer, which would be obtained if the polymerization proceeded in a different direction from that of the same column of the polymer side chain. To obtain the ladder polymer where two polydiacetylenes are conjugated in each repeating unit, it is necessary to keep the polydiacetylene backbones separated by conjugated divalent groups.
In this study, a dodecahexayne derivative with long alkyl substituents, i.e. 15,17,19,21, 23,25-tetracontahexayne (THY), was also synthesized as an extension of the study of the octatetrayne system. Its solid-state polymerization behavior was investigated using

142 |
Yoshito Takeuchi and Toshio Takayama |
(a)
s
|
|
s |
s |
|
|
|
8.0 |
7.0 |
6.0 |
5.0 |
4.0 |
3.0 |
2.0 |
|
ppm |
(b) |
s |
|
s s
8.0 |
7.0 |
6.0 |
5.0 |
4.0 |
3.0 |
2.0 |
|
|
|
ppm |
|
|
|
FIGURE 34. 1H NMR spectra (200 MHz): (a) of cryptand 90 and (b) of its dinuclear Cu1 complex 92 in C2D2Cl4. (s D solvent). Reproduced by permission of Neue Schweizerische Chemische Gesellschaft from Reference 52
IR and visible near-IR absorption, NMR, ESR and X-ray diffraction. It was emphasized that solid-state high-resolution 13C NMR spectroscopy is a powerful tool for the structure analysis of polydiacetylenes. THY is particularly attractive because of its potential for forming the polydiacetylene ladder polymer.
The 13C CP/MAS NMR spectrum taken 30 min after recrystallization of THY is shown in Figure 36A, and the 13C chemical shift values of this spectrum together with those of the THY monomer in CDCl3 solution are summarized in Table 35.
The assignment of the monomer solution spectrum was performed by using an NMR spectral database system (SDBS-NMR)54. The signals of the six acetylene carbons from 60.34 to 81.91 ppm in the solution spectrum indicated the monomer structure of a dodecahexyne derivative substituted symmetrically by alkyl groups. Since the spectral patterns in Figure 36A are almost the same as those of the monomer, only a small extent of polymerization had occurred during the 30 min after recrystallization. The signal at about
|
2. NMR spectroscopy of dienes and polyenes |
143 |
R |
|
|
R |
R |
|
R |
|
|
|
|
|
R |
|
|
|
R |
|
|
|
R |
|
R |
|
|
R |
|
|
R |
R |
|
(95) |
|
|
|
|
|
R |
|
|
(96) |
|
R
 R
R
R
(98)
 R
R
R
 R
R
|
n |
(97) |
(99) |
FIGURE 35. Polymerization schemes of octatetrayne derivatives and cycloaromatization of 1,6- didehydro[10]annulene (98). Reprinted with permission from Reference 53. Copyright (1994) American Chemical Society

144 |
Yoshito Takeuchi and Toshio Takayama |
(a)
200 |
150 |
100 |
50 |
0 |
|
|
d (ppm) |
|
|
(b)
200 |
150 |
100 |
50 |
0 |
|
|
d (ppm) |
|
|
FIGURE 36. (a) 13C CP/MAS spectrum of THY 30 min after recrystallization. Asterisks indicate spinning sidebands. The signals can be assigned to the THY monomer. (b) The spectrum after 22 h. The signals can be assigned to structure 100 shown in Figure 37. Reprinted with permission from Reference 53. Copyright (1994) American Chemical Society
82 ppm is assigned to the acetylene carbons at position 15 next to the alkyl chain, which splits into two peaks with a separation of 3.3 ppm. Similarly, the signal of the acetylene carbons at position 16 splits with a smaller separation of 2.2 ppm.
Although the signals of other acetylene carbons are split, they overlap in a very small range between 62 and 64 ppm and are too complicated to be distinguished from each other.

2. NMR spectroscopy of dienes and polyenes |
145 |
TABLE 35. 13C chemical shifts of the THY monomer in solution and THY in the solid state after 30 min
In solutiona (υsn) |
|
In the solid stateb (υsd) |
|
|
υsd υsn |
|
|
Assignmentc |
||||||||||||||||
81.91 |
|
|
|
|
|
|
85.2 |
|
|
|
|
|
|
3.3 |
|
|
|
15 |
||||||
|
|
|
|
|
|
|
81.9 |
|
|
|
|
|
|
0 |
|
|
|
|
|
|
|
|
||
|
|
|
|
|
|
|
69.2 |
|
|
|
|
|
|
3.6 |
|
|
|
16 |
||||||
65.61 |
|
|
|
|
|
|
67.0 |
|
|
|
|
|
|
1.4 |
|
|
|
|
|
|
|
|||
62.70 |
|
|
|
|
|
|
62 – 64d |
|
|
|
|
|
1 – 2 |
|
|
|
17 |
|||||||
62.36 |
|
|
|
|
|
|
|
d |
|
|
|
|
|
|
|
|
|
|
|
18 |
||||
61.46 |
|
|
|
|
|
|
|
d |
|
|
|
|
|
|
|
|
|
|
|
19 |
||||
60.34 |
|
|
|
|
|
|
|
d |
|
|
|
|
|
|
|
|
|
|
|
20 |
||||
31.92 |
|
|
|
|
|
|
35.4 |
|
|
|
|
|
|
3.5 |
|
|
|
3 |
||||||
28.82 – 29.64e |
|
|
|
33.8f |
|
|
|
|
|
4 |
|
|
|
|
|
|
4 – 12 |
|||||||
27.83 |
|
|
|
|
|
|
32.5 |
|
|
|
|
|
|
4.7 |
|
|
|
13 |
||||||
22.69 |
|
|
|
|
|
|
25.6 |
|
|
|
|
|
|
2.9 |
|
|
|
2 |
||||||
19.52 |
|
|
|
|
|
|
21.8 |
|
|
|
|
|
|
2.3 |
|
|
|
14 |
||||||
14.14 |
|
|
|
|
|
|
15.4 |
|
|
|
|
|
|
1.3 |
|
|
|
1 |
||||||
|
|
|
|
|
|
|
|
|
|
|
|
|
|
|
|
|
|
|
|
|
|
|
|
|
aCDCl3 solution. |
|
|
|
|
|
|
|
|
|
|
|
|
|
|
|
|
|
|
|
|
|
|||
bCP/MAS. |
|
|
|
|
|
|
|
|
|
|
|
|
|
|
|
|
|
|
|
|
|
|||
cLabeling: |
|
|
|
|
|
|
|
|
|
|
|
|
|
|
|
|
|
|
|
|
|
|||
(H3C |
|
CH2 |
|
CH2 |
|
(CH2)9 |
|
CH2 |
|
CH2 |
|
C |
|
C |
|
C |
|
C |
|
C |
|
C |
|
|
|
|
|
|
|
|
|
|
|
||||||||||||||||
|
|
|
|
|
|
|
|
|
|
|
|
|||||||||||||
1 |
2 |
|
3 |
|
4−12 |
13 |
|
14 |
|
15 |
16 |
17 |
|
18 |
19 |
20 |
|
|
||||||
dOverlap each other.
eSeparated seven peaks for nine carbons. fMany peaks overlap.
The splitting of the resonances from carbons in the same position is due to polymorphism of the monomer in the solid state. A similar 13C signal splitting was found in monomers of octatetrayne derivatives containing urethane groups. It was not observed, however, in the corresponding alkyl-substituted octatetrayne monomer of HTY (95). In the THY monomer spectrum, the 13C chemical shifts in the solid state (υsd) move to the low-field side from those in solution (υsn), and these differences (υsd υsn) are shown in Table 35. Large low-field shifts are generally observed when the packing of alkyl chains is tight. In the case of the corresponding alkyl-substituted octatetrayne derivative of HTY, a signal of the carbons originating from the mobile chains was observed as a sharp line with a 13C chemical shift similar to that found in the solution spectrum. Since the THY monomer did not show such mobile carbon signals, it is suggested that the stacking of the alkyl chains of the THY monomer is more rigid than in the HTY monomer.
After about 3 h, additional peaks at 146, 111 and 106 ppm appeared and their intensities gradually increased. These three peaks were assigned to the unsaturated carbons in the asymmetrically-substituted polydiacetylene backbone with acetylene substituents. A 13C spectrum obtained after 22 h, when those three peaks were clearly observed, is shown in Figure 36B.
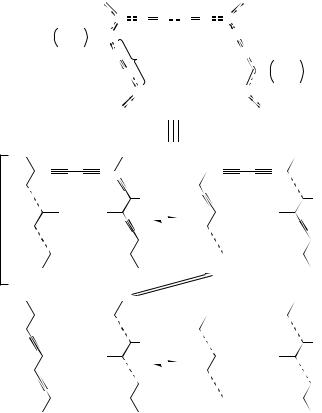
The structure of the polymer in the first step of polymerization is presented in Figure 37. The symbols defining the carbons are given in this figure. In the spectrum in Figure 36B, the peak at 73 ppm was assigned to the acetylene carbon ˛ of the side chain. These assignments were based on the 13C spectra of the polymer obtained from HTY. Spectral changes also occurred in the alkyl carbon region. The peak at 38 ppm was assigned to the methylene carbon (140 ) next to the olefin carbon in the polymer backbone. The intensity of the signal increased gradually concomitantly with those of the peaks for the polymer-backbone carbons. Simultaneously, the peak of the methylene carbon attached
146
H3C |
|
CH2 |
|
CH2 |
|
CH2 |
|
CH2 |
|
CH2 |
|
C A |
|
|
|
9 |
|
|
|||||||
2 |
3 |
4-12 |
13 |
14 |
|
CB |
||||||
|
|
|||||||||||
|
|
|
|
|
|
|
|
|
|
|
|
|
C C
(100)
D |
C |
|
|
C C |
|
|
C C |
|
|
C C |
|
C C |
|
CH2 |
|
CH2 |
|
CH2 |
|
CH2 |
|
CH2 |
|
CH3 |
|||||||
|
|
|
|
|
|
|
|
|
|
|
|
|
|||||||||||||||||||
|
|
|
|
a |
b |
|
|
|
g |
d |
e z h |
q |
14 |
13 |
4-12 |
9 |
3 |
2 |
1 |
||||||||||||
|
|
|
|
|
|
|
|
|
|
|
|
|
|
|
|
|
|
|
|||||||||||||
|
|
|
|
|
|
|
|
|
|
|
|
|
|
|
|
|
|
|
|
|
|
|
|
|
|
|
|
|
|
||
|
C |
|
|
C |
C |
|
|
C C |
|
|
C |
|
|
|
|
|
|
|
|
|
|
|
|
|
|||||||
|
|
|
|
|
|
|
|
|
|
|
|
|
|
|
|
|
|
||||||||||||||
|
|
|
|
|
|
|
|
|
|
|
|
|
|
|
|
|
|
|
|||||||||||||
CH3 |
|
CH2 |
|
CH2 |
|
CH2 |
|
CH2 |
|
CA |
C |
|
|
|
10 |
|
|||||||
1 |
2 |
3 |
4-13 |
14 |
|
C B |
C |
||||
|
|
|
|
|
|
|
|
|
|
||
C C |
C |
|
CH2 |
|
CH2 |
|
CH2 |
|
CH2 |
|
CH3 |
|
|
|
|
|
|||||||
|
10 |
|
|
|
|
|
|||||
(101) |
D C |
|
C |
C |
|
C C |
|
C |
|
|
|
||||||
|
|
a |
b |
|||||
|
|
|
||||||
FIGURE 37. Proposed polymer structures from THY obtained by solid-state polymerization at ambient temperature without irradiation. Reprinted with permission from Reference 53. Copyright (1994) American Chemical Society
|
|
|
|
|
|
|
|
C |
|
C |
C |
|
C C |
|
C |
|
|
|
|
|
|
|
|
|
|
|
|||||
CH3 |
|
CH2 |
|
CH2 |
|
CH2 |
|
C |
|
|
|
|
|
|
C |
|
|
|
11 |
|
|
||||||||||
1 |
2 |
3 |
4-13 |
|
|
|
|
|
|
|
C |
||||
|
C |
|
|
|
|
|
|
||||||||
|
|
|
|
|
|
|
A |
|
|
|
|
||||
|
|
|
|
|
|
|
|
|
|
|
|
|
|||
C |
|
CH2 |
|
CH2 |
|
CH2 |
|
CH3 |
|
|
|
|
|||||
|
11 |
|
|
|
|
|
||
C  C
C C
C 
 C
C C
C  C
C
(102) |
a |
b |
|
|
R |
|
|
R |
||||||||||||||||||
|
|
|
|
|
|
|
|
R |
|
|
|
|
|
|
|
|
|
|
|
R |
|
|
|
|
|
|
|
|
|
|
|
|
|
|
|
|
|
|
|
|
|
||
|
|
|
|
|
|
|
|
|
|
|
|
|
|
|
|
|
|
|
|
|
|
|
|
|
|
|
|
|
|
|
|
|
|
|
|
|
|
|
|
|
|
|
|
|
|
|
|
|
|
|
|
|
|
|
|
|
|
||||||||
R |
|
|
R |
||||||||||||||||||
|
|
||||||||||||||||||||
|
|
|
|
|
|
|
|
R |
|
|
|
|
|
|
|
|
|
|
|
R |
|
|
|
|
|
|
|
|
|
|
|
|
|
|
|
|
|
|
|
|
|
|
|
|
|
|
|
|
|
|
|
|
|
|
|
|
|
|
|
|
|
|
|
|
|
|
|
|
|
|
|
|
|
|
|
|
|
|
|
|
|
|
|
|
|
|
|
|
|
|
|
|
|
|
|
|
|
|
|
|
|
|
|
|
|
|
|
|
|
|
|
|
|
|
|
|
|
|
|
|
|
|
|
|
|
|
|
|
|
|
|
|
|
|
|
|
|
|
|
|
|
|
|
|
|
|
|
|
|
|
|
|
|
|
|
|
|
|
|
|
|
|
|
|
|
R |
|
|
R |
||||||||||||||||||||||
|
|
|
|
|
|
|
|
|
|
R |
|
|
|
|
|
|
|
|
|
|
|
|
R |
||
|
|
|
|
|
|
|
|
|
|
|
|
|
|
|
|
|
|
|
|
|
|
|
|
||
|
|
|
|
|
|
|
|
|
|
|
|
|
|
|
|
|
|
|
|
|
|
|
|
|
|
|
|
|
|
|
|
|
|
|
|
|
|
|
|
|
|
|
|
|
|
|
|
|
|
|
|
|
|
|
|
|
|
|
|
|
|
|
|
|
|
|
|
|
|||||||||
R |
|
|
R |
||||||||||||||||||||||
|
|
||||||||||||||||||||||||
|
|
|
|
|
|
|
|
|
|
R |
|
|
|
|
|
|
|
|
|
|
|
|
R |
||
|
|
|
|
|
|
|
|
|
|
|
|
|
|
|
|
|
|
|
|
|
|
|
|
|
|
|
|
|
|
|
|
|
|
|
|
|
|
|
|
|
|
|
|
|
|
|
|
|
|
|
|
|
|
|
|
|
|
|
|
|
|
|
|
|
|
|
|
|
|
|
|
|
|
|
|
|
|
|
|
|
|
|
|
|
|
|
|
|
|
|
|
|
|
|
|
|
|
|
|
|
|
|
|
FIGURE 37. (continued)
147

148 |
Yoshito Takeuchi and Toshio Takayama |
to the acetylene moiety at 22 ppm decreased in intensity, and the relative intensities of the two peaks at 22 and 38 ppm became almost the same, as shown in Figure 36(b). The methyl carbon signal at 15.4 ppm came to have a shoulder on the higher field side and eventually separated to form a new peak at 14.6 ppm. After 22 h, the relative intensities of these two methyl carbon peaks became almost equivalent.
At this stage the main part of the crystals had changed from that of the monomer to 100 by the 1,4-addition. The 13C chemical shifts of 100 are summarized in Table 36 together with those of the polydiacetylene with butadiynyl substituents (96) obtained from HTY.
The only difference between 100 and 96 is the acetylene carbon numbers in the side chains, i.e. six for 100 and four for 96. However, the alkyl signals of 100 have a more complicated pattern than those of 96. The signal positions of alkyl carbons attached to the acetylene side chain are assumed to be near those of the monomer, and those attached directly to the backbone may move to the higher field near those of the monomer in solution. The alkyl carbons bound to the polymer backbone and the acetylene group in 96 may be in similar situations since the 13C peaks of the alkyl chain carbons in 96 do not split.
The 13C spectral pattern for both the alkyl and the unsaturated carbon signals changed continuously. The 13C spectrum measured after 56 h is shown in Figure 38(a).
The terminal methyl and methylene signals for the CH2 CH3 moiety have become single lines, and the decreasing signals adjacent to the acetylene carbon around 22 ppm have disappeared, while the intensities of the signals at about 38 ppm from the newly formed methylene groups have increased. At the same time, the signal intensities of the main chain acetylene and olefin carbons in the region of 100 – 150 ppm have increased
TABLE 36. 13C chemical shifts (CP/MAS) of 100 from THY and 96 from HTY
100 |
96 |
Assignmenta |
146 |
146.3 |
A |
111.0 |
110.2 |
D |
105.7 |
105 |
B, C |
84 |
|
|
82.1 |
80.7 |
ˇ |
73.2 |
72.6 |
˛ |
67.0 |
|
|
67.0 |
|
|
65 |
|
ε |
63.6 |
65.4 |
|
63.6 |
88.7 |
υ |
37.7 |
37.3 |
140 |
35.2 |
b |
3 |
33.8c |
33.7c , 31.3c,d |
4 – 12 |
32.5 |
b |
13 |
25.4 |
24.4 |
2 |
23.5 |
|
|
21.9 |
22.3 |
14 |
15.4 |
14.8 |
1 |
14.6 |
|
|
aFor labeling of 100 see Figure 37. bBroad signal,
c Many overlapping peaks. dMobile methylene carbons.