

|
|
2. NMR spectroscopy of dienes and polyenes |
|
|
99 |
||||||||||
TABLE 17. |
1H NMR data for the vacidin A and NOE effectsa |
|
|
|
|
|
|
|
|
|
|||||
No. of |
υ (ppm) |
|
J(HH) (Hz) |
|
|
|
|
|
|
NOE to protons |
|||||
proton |
|
|
(coupling partner) |
|
|
|
|
|
|
(intensity) |
|||||
|
|
|
|
|
|
|
|
|
|
|
|
|
|
||
2a |
2.80 |
15.1 |
(2b), 3.7 (3) |
|
|
|
3 (m) |
|
|
|
|
|
|
||
2b |
2.45 |
15.1 |
(2a), 9.3 (3) |
|
|
|
3 (w) |
|
|
|
|
|
|
||
3 |
4.78 |
9.3 (2b), 8.1 (4b), 5.6 (4a), 3.7 |
38-CH3 (w), 2a (m), 4a (m), |
||||||||||||
|
|
(2a) |
|
|
|
|
4b |
(m), 2b |
(w), 34 (m) |
||||||
4a |
2.96 |
17.5 |
(4b), 5.6 (3) |
|
|
|
3 (m), 4b (s) |
|
|
||||||
4b |
2.68 |
17.5 |
(4a), 8.1 (3) |
|
|
|
3 (m), 4a (s) |
|
|
||||||
6a |
2.68 |
16.8 |
(6b), 9.6 (7) |
|
|
|
6b |
(s), 8a (w) |
|
||||||
6b |
2.44 |
16.8 |
(6a), ¾2 (7) |
|
|
|
6a (s), 8b (w), 7 (m) |
||||||||
7 |
4.54 |
9.6 (6a), 9.6 (8a), ¾2 (6b), |
8b |
(m), 6b |
(m), 9 (s), 28(m), |
||||||||||
|
|
¾2 (8b) |
|
|
|
29(m) |
|
|
|
|
|
||||
8a |
1.62 |
¾ 13 (8b), 9.6 (7), 10.0 (9) |
6a (w) c |
(m),c6b (w) |
|||||||||||
8b |
1.30 |
¾ 13 (8a), ¾2 (7), ¾2 (9) |
7 (m), |
|
|||||||||||
9 |
4.06 |
10.0 |
(8a), 10.0 (10a), ¾2 (8b), |
[10b or 8b] |
|
(m), 7 (s), 28 (m) |
|||||||||
|
|
¾2 (10b) |
|
|
|
|
|
|
|
|
|
|
|
|
|
10a |
1.51 |
¾13 (10b), 10.0 (9), 10.3 (11) |
c |
(m), |
d |
(m) |
|
|
|
||||||
10b |
1.27 |
¾13 (10a), ¾2 (9), ¾2 (11) |
|
|
|
d |
(m), 13 (s), 26 |
||||||||
11 |
4.11 |
10.3 |
(10a), 10.3 (12a), |
|
[12b or 10b] |
|
|||||||||
|
|
¾2 (10b), ¾2 (12b) |
|
|
(m) |
|
|
|
|
|
|
||||
12a |
1.51 |
10.3 |
(11), 10.5 (13), 13.5 (12b), |
|
|
|
|
|
d(m) |
|
|
||||
12b |
1.21 |
¾2 (11), ¾2 (13), |
13.5 (12a) |
13 |
(m), |
|
|
||||||||
|
b |
, |
|
|
|
|
|||||||||
13 |
4.59 |
10.5 |
(12a), 10.5 (14a) |
|
12b (m), 14b (w), 11 (s), 23 (w), |
||||||||||
|
|
2 (12b), 2 (14b)b |
|
|
|
22 |
(m), 24 |
(m) |
|||||||
14a |
1.78 |
10.5 |
(13) |
|
|
|
16a (w) |
|
|
|
|
||||
14b |
1.54 |
2 (13) |
|
|
|
13 |
(m) |
|
|
|
|
|
|||
16a |
2.35 |
12.2 |
(16b), 4.7 (17) |
|
|
16b (m), 14a (w), 17 (m) |
|||||||||
16b |
1.56 |
12.2 |
(16a), 10.3 (17) |
|
|
18 |
(m), 16a (m) |
||||||||
17 |
4.82 |
10.3 |
(16b), 10.3 (18) |
|
|
16a (m), 18 (m), 19 (m) |
|||||||||
18 |
2.56 |
10.3 |
(17), 10.1 (19) |
|
|
16b (m), 20b (w), |
|||||||||
|
|
|
(18), 10.1 (20b)b |
|
|
19 |
(m), 17(m) |
|
|||||||
19 |
5.00 |
10.1 |
|
|
18 |
(m), 20 |
(m), 20 (m), 10 (m), |
||||||||
|
|
¾9 (21) |
|
|
|
17 |
(m), 23 |
(w), 22 (m) |
|||||||
20a |
2.90 |
|
|
|
20b (m), 21 (w), 19 (m), 10 (m) |
||||||||||
20b |
1.82 |
10.1 |
(19) |
|
|
|
18 |
(w), 21 (w), 20 (m) |
|||||||
21 |
4.83 |
9 (22), ¾9 (20a)b |
|
|
|
20a (w), 20b (w), 10 (s), 23 (s), |
|||||||||
|
|
|
|
|
|
|
22 |
(m) |
|
|
|
|
|
||
22 |
6.36 |
9 (21), 15 (23) |
|
|
|
19 |
(m), 21 |
(m), 24 (w), 13 (m) |
|||||||
23 |
6.24 |
11 (24), 15 (22) |
|
|
|
19 |
(w), 21 (s), 13 (w), |
||||||||
|
|
|
|
|
|
|
[24 or 30 or none] e(w) |
||||||||
24 |
6.64 |
11 (25), 15 (23) |
|
|
|
13 |
(m), 22 |
(w), e(w) |
|||||||
25 |
6.37 |
11 (26), 15 (24) |
|
|
|
27 |
(m) |
|
|
|
|
|
|||
26 |
6.68 |
11 (25), 15 (27) |
|
|
|
11 |
(m), 28 |
(m) |
|||||||
27 |
6.95 |
11.5 |
(28), 15(26) |
|
|
|
30 |
(m), 25 |
(m) |
||||||
28 |
6.51 |
11.5 |
(27), 11.5 (29) |
|
|
7 (m), 9(m), 26 (m), 29 (s) |
|||||||||
29 |
6.97 |
11.5 |
(28), 11.5 (30) |
|
|
7 (m), 28 (s), 32 (s) |
|||||||||
30 |
6.63 |
11.5 |
(29), 11.5 (31) |
|
|
31 |
(s), 27 (m), |
||||||||
|
|
|
|
|
|
|
[33 or 23 or none] e(w) |
||||||||
31 |
6.15 |
11.5 |
(30), 11.5 (32) |
|
|
33 |
(m), 30 |
(s) |
|
||||||
32 |
7.17 |
11.5 |
(31), 15 (33) |
|
|
|
34 |
(m), 33 |
(w), 29 (s) |
||||||
33 |
6.24 |
11 (34), 15 (32) |
|
|
|
35 |
(m), 31 |
(m), 32 (w), e(w) |
|||||||
34 |
6.34 |
11 (33), 15 (35) |
|
|
|
35 |
(m), 3 (m), 36 (s), 32 (m) |
||||||||
(continued overleaf )

100 |
Yoshito Takeuchi and Toshio Takayama |
|||
TABLE 17. |
(continued) |
|
|
|
|
|
|
|
|
No. of |
υ (ppm) |
|
J(HH) (Hz) |
NOE to protons |
proton |
|
(coupling partner) |
(intensity) |
|
|
|
|
|
|
35 |
5.45 |
9 (36), 15 (34) |
36-CH3 (m),37 (m), 33 (m), |
|
|
|
|
|
34 (m) |
36 |
1.81 |
9 (35), 9.8 (37) |
38-CH3 (m), 36-CH3 (m), |
|
|
|
|
|
38(w),37 (m), 34 (s) |
37 |
4.94 |
9.8 |
(36), 2.2 (38) |
36-CH3 (m), 38 (m), |
38 |
1.81 |
6.7 |
(39)g, 2.2 (37)g |
[40 or 39] f(m), 36 (m), 35 (m) |
36-CH3 (m), 38-CH3 (m), |
||||
|
|
|
|
36 (w), 37 (m) |
39a |
1.61 |
|
|
f(m) |
39b |
|
|
|
f(m) |
40a |
1.70 |
|
|
|
40b |
|
|
|
|
41 |
4.37 |
8.1 |
(42a), 4.2 (42b) |
40a/b (m), 42a (m), 42b (m) |
42a |
3.20 |
15.6 (42b), 8.1 (41) |
41 (m), 42b (s) |
|
42b |
3.02 |
15.6 (42a), 4.2 (41) |
41 (m), 42a (s) |
|
36-CH3 |
0.87 |
6.6 |
(36) |
35 (w), 37 (m), 38 (m), 36 (m) |
38-CH3 |
0.94 |
6.8 |
(38) |
3 (w), 38 (m), [39 or 40] f(m), |
|
|
¾0 (20 ) |
36 (m) |
|
10 |
5.14 |
20a (m), 30 (s), 50 (s), 20 (s), |
||
|
|
|
|
21 (s), 19 (m) |
20 |
4.63 |
3.3 |
(30 ), 0 (10 ) |
30 (s), 10 (s), 19 (m) |
30 |
3.55 |
9.7 |
(40 ), 3.3 (30 ) |
10 (s), 20 (s) |
40 |
3.97 |
9.7 |
(30 ), 9.7 (50 ) |
60 (m) |
50 |
3.82 |
9.7 |
(40 ), 5.9 (60 ) |
60 (m), 10 (s) |
60 |
1.45 |
5.9 |
(50 ) |
40 (m), 50 (m) |
Aromatic |
6.81 |
8.6 |
|
|
protons |
7.95 |
8.6 |
|
|
Glycine |
|
|
|
|
methyl |
|
|
|
|
ester |
|
|
|
|
protons |
3.66 (s) |
|
|
|
OCH3 |
|
|
|
|
CH2 |
3.81/4.35 |
17.6 |
|
|
aNOE scale: 100% for CH2CO; 10 – 20% (w), 20 – 75% (m), 75 – 200% (s).
bThe correct values of coupling constants were attributed to the appropriate protons by the analysis of antiphase structures of cross-peaks in DQF-COSY spectrum.
c H10a and H8b have nearly the same chemical shifts. NOE between (H10b or/and H8b) and H9.
dH12b and H10b have nearly the same chemical shifts. NOE between (H12b or/and H10b) and 11-H.
eThe pairs H23, H33 and H24, H30 have nearly the same chemical shifts. NOE between (H23 or H33) and (H24 or H30).
fH39 and H40 have nearly the same chemical shifts. NOE between (H39 or/and H40) and H37. gValues from 1H NMR spectrum in 35% DMSO-d6 in methanol-d4.
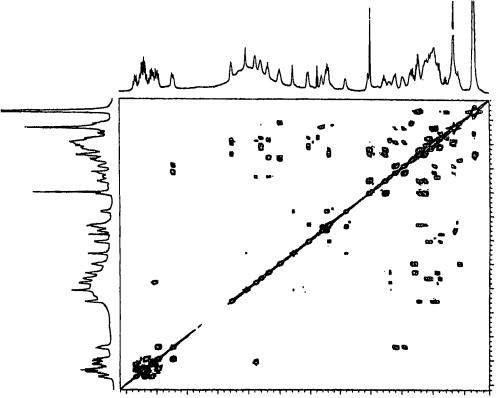
of directly bonded carbons and protons (see Table 18), and the 1H – 1H COSY (see Figure 14) spectrum implied the existence of several partial structures (A, B, C, D and E) as shown in Figure 15). The presence of mycosamine moiety (a partial structure A) was deduced from 1H – 1H COSY correlation peaks [H10 υ4.55 /H20 υ3.80 , H20 /H30 υ2.92 , H30/H40 υ3.22 , H40 /H50 υ3.32 , and H50 /Me60 υ1.17 ], and comparison of its 1H and 13C chemical shifts. One side of the all-trans-tetraene moiety, the presence of which was predicted from the UV spectrum and was confirmed by these NMR spectra, was
|
|
|
2. NMR spectroscopy of dienes and polyenes |
|
|
101 |
|||
TABLE 18. |
13C and 1H NMR data for YS-882A (65) |
|
|
|
|
|
|||
Carbon |
13C |
|
1H |
Carbon |
13C |
|
|
1H |
|
1 |
173.2 |
s |
|
20 |
131.8 |
d |
6.28 |
|
|
2 |
30.7 |
t |
2.38, 2.52 |
21 |
131.5 |
d |
6.15 |
|
|
3 |
28.1 |
t |
1.65, 1.75 |
22 |
130.9 |
d |
5.95 |
|
|
4 |
72.2 |
d |
3.20 |
23 |
133.4 |
d |
5.73 |
|
|
5 |
72.7 |
d |
3.55 |
24 |
29.8 |
t |
1.98, 2.10 |
|
|
6 |
38.9 |
t |
1.42, 1.58 |
25 |
24.4 |
t |
1.20, 1.48 |
|
|
7 |
67.4 |
d |
4.31 |
26 |
29.8 |
t |
1.45, 1.55 |
|
|
8 |
45.8 |
t |
1.55, 1.61 |
27 |
76.0 |
d |
4.78 |
|
|
9 |
97.0 |
s |
|
28 |
31.4 |
d |
1.75 |
(3H, d, J D 7 |
|
10 |
44.3 |
t |
1.10, 1.85 |
29 |
17.7 |
q |
0.84 |
Hz) |
|
11 |
65.6 |
d |
4.00 |
30 |
18.5 |
q |
0.86 (3H, d, J D 7 |
Hz) |
|
12 |
58.8 |
d |
1.82 |
31 |
177.5 |
s |
|
|
|
13 |
65.2 |
d |
4.20 |
10 |
95.4 |
d |
4.55 |
|
|
14 |
36.1 |
t |
1.45, 2.18 |
20 |
67.8 |
d |
3.80 |
|
|
15 |
74.0 |
d |
4.40 |
30 |
56.2 |
d |
2.92 |
|
|
16 |
136.2 |
d |
6.05 |
40 |
69.6 |
d |
3.22 |
|
|
17 |
128.3 |
d |
6.12 |
50 |
72.4 |
d |
3.32 |
|
|
18 |
132.9 |
d |
6.35 |
60 |
17.9 |
q |
1.17 (3H, d, J D 6 |
Hz) |
|
19 |
131.2 |
d |
6.20 |
|
|
|
|
|
|
attached with a methylene (υC 29.8 t, υH 1.98 and 2.10), which was in turn connected with a methylene (υC2 4.4 t, υH 1.20 and 1.48). The other side of the tetraene moiety was connected with a methine (υC7 4.0 d, υH 4.40; adjacent to an oxygen), and it was probable from the 1H – 1H COSY spectrum that this methine was connected with a unit consisting of two methylenes and three methines to compose a partial structure B. The partial structures C and D were also deduced from 1H – 1H COSY correlations, even though there were several severely overlapping signals; for example there were 11 proton signals between υH 1.4 and 1.8. The ambiguity and the poor reliability of the assignments and proposed partial structures C and D were dissolved by homonuclear Hartmann – Hahn (HOHAHA) and heteronuclear multiple-bond connectivity (HMBC) spectra. HOHAHA and HMBC measurements not only confirmed the deductions above but also connected all the remaining fragments and quaternary carbons (Figure 16). That is, the distinct correlation peaks of a carbonyl carbon (C1; υ173.2) with H2 (υ2.38 and 2.52) and H27 (υ4.78) appeared on the HMBC spectrum, which established the connection between partial structures C and D through an ester group. In the HOHAHA spectrum, a methine proton at υ4.78 (H27) showed correlation peaks with protons at υ1.98 and 2.10 (H24) through 1.45 and 1.55 (H26), and 1.20 and 1.48 (H25), and two methyl protons at υ0.84 and 0.86 through 1.75 (H28), which not only confirmed the partial structure D but also established the connection between D and B. Correlation peaks between C15 (υ74.0) and H10 (υ4.55) and between C31 (υ177.5) and H12 (υ1.82) on the HMBC spectrum supported the partial structure E.
YS-822A had nine degrees of unsaturation, all of which have already been assigned to four double bonds, two carbonyls (a lactone and a carboxylic acid) and three rings. Consequently, all the oxygen functional groups at C should be hydroxyls. Thus, the planar structure of YS-822A was determined as 65.
Gebhard and coworkers42 reported a synthesis and spectroscopy of chemically modified spheroidenes. The structure and numbering of the system is shown in 66. The syntheses and spectroscopic properties of the all-E isomers of 110,120 -dihydrospheroidene (67),
|
21 |
18 |
|
30 |
16 |
|
17 22 |
10 |
23 |
22/24
22/24
15/18
22/23
6.0
|
1′ |
|
|
|
|
|
15 |
|
|
4 |
|
|
7 12 |
2′ |
|
||
27 |
4′ |
|
|||
|
|
11 |
5 |
6′ |
2′ |
|
|
|
|||
|
|
|
|
|
|
|
|
10/11 |
|
6′/4′ |
|
|
|
|
|
|
|
26/27 |
6/7 |
13/14 |
5/6 |
|
|
|
14/15 |
|
6/6 |
|
|
|
|
|
|
|
|
27/28 |
6,8/7 |
10,12/11 |
|
3/4 |
|
|
|
|
|||
|
12/13 |
|
|
|
|
|
14/15 13′/14 |
|
|
|
|
3′/4′
2′/3′
4′/5′
4/5
1′/2′
5.0 |
4.0 |
3.0 |
|
|
ppm |
DM80 |
|
|
|
|
|
|
|
|
|
3 |
25 |
5 |
5′(Me) |
|
|
|
6 |
14 |
|
|
|
|
|
3 |
26 26 |
25 |
|
|
|
|
28 |
6 |
|
|
|
|
|
10 |
6 |
|
|
|
|
|
|
|
|
|
2 |
2 |
24 |
12 |
|
|
10 |
|
24 |
|
|
|
||
|
|
14 |
|
|
|
|
|
|
|
28/29,30 |
|
|
|
|
|
|
10/10 |
25/26 |
|
|
|
|
24/25 |
|
|||
14/14 24/25 2/3 2/3
24/24
2/2
2.01.0
29 (Me)
30 (Me)
6.0 5.0 4.0 3.0 2.0 1.0 ppm
FIGURE 14. 1H – 1H COSY spectrum of YS-822A (65) in DMSO-d6(300 K). Reproduced by permission of Japan Antibiotics Research Association from Reference 41
102

2. NMR spectroscopy of dienes and polyenes |
103 |
OH
NH2
OH
O O
O Me
Me
A
O
O
O
B
O |
Me |
O
Me
O O
C D
OH
OH
OH O
|
|
COOH |
|
OH |
NH2 |
|
|
|
O |
|
OH |
O |
Me |
|
|
|
E
FIGURE 15. Partial structures of YS-822A (65). Reproduced by permission of Japan Antibiotics Research Association from Reference 41
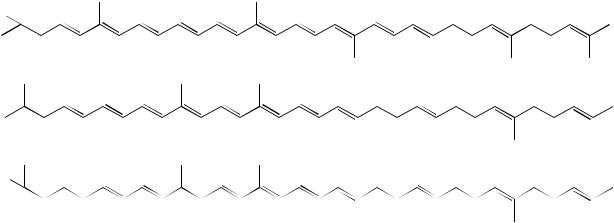
3,4,110 ,120 -tetrahydrospheroidene (68), 3,4-dihydrospheroidene (69), 3,4,5,6-tetrahydro- spheroidene (70), 3,4,7,8-tetrahydrospheroidene (71) and 15,150-didehydrospheroidene (72) are described.
Spheroidenes 67– 71 have the same overall shape as native all-trans spheroidene (66), which is the carotenoid bound in the photosynthetic reaction center of Rhodobacter
104 |
Yoshito Takeuchi and Toshio Takayama |
|
|
||
Me |
OH |
|
|
|
|
|
|
|
OH |
|
|
O |
|
|
|
|
OH |
Me |
|
|
|
|
|
|
OH |
OH |
O |
|
|
|
|
|
|
|
COOH |
|
|
|
|
OH |
|
|
|
|
|
|
NH2 |
|
|
|
O |
O |
OH |
|
|
|
|
Me |
|
|
|
|
|
|
|
FIGURE 16. Results of HMBC and 1H – 1H HOHAHA measurements of YS-822A in DMSO- d6(300 K). Solid arrows denote correlation peaks between carbons (tail) and protons (head) in the HMBC spectrum. Dotted lines indicate 1H – 1H HOHAHA correlations after removal of 1H – 1H COSY ones. Reproduced by permission of Japan Antibiotics Research Association from Reference 41
sphaeroides. They have instead polyene chromophores of nine (69), eight (67, 70) or seven (68, 71) conjugated double bonds. In 72, the central double bond is substituted by a triple bond. A detailed analysis of the 1H and 13C NMR spectra of 66– 72 has been achieved by mutual comparison.
The 300 MHz 1H NMR spectra of the all-E isomers of 67– 72 were measured in CDCl3. The signals were assigned using the COSY technique. The chemical shift values and the values of the coupling constants are completely in agreement with their all-trans structures and are summarized in Tables 19 and 20, respectively, together with the values for 66 which are included for comparison.
As can be seen from Table 19, the saturation between C110 and C120 in 67 causes an upfield shift of H140 (ca 0.2 ppm) and of H15 and H150 (ca 0.1 ppm) compared with 66. The remaining polyene protons in 67 are only slightly affected. Similar features are observed upon comparison of the chemical shift values of the protons of the polyene chains of 68, 69, 70 and 71 with those of 66. Thus, saturation of a double bond in a polyene chain generally leads to an upfield shift of ca 0.2 ppm for the protons connected to the - and the υ-carbons; the upfield shift of the remaining polyene protons is generally less than 0.05 ppm. Comparison of the chemical shift values of 72 with those of 66 shows that the introduction of the 15,150-triple bond in 72 leads to an upfield shift of the signals of H14 and H140 (ca 0.5 ppm), whereas the chemical shift values of the other polyene protons are only slightly affected.
In the 1H-noise-decoupled 75 MHz 13C NMR spectra of the all-trans isomers of 67– 70 and 72, the expected 40 different signals are present. In the spectrum of 3,4,7,8- tetrahydrospheroidene (71), only 29 separated signals are observed due to the almost perfect twofold symmetry of the C7 – C70 part of the molecule. The signals of the protonbearing carbon atoms were assigned using the attached proton test (ATP) and the 13C – 1H correlated technique. The signals of the quaternary carbon atoms were assigned by comparison with the spectrum of 66 and by using chemical shift increments. The 13C chemical shift values of 67– 72 are completely in agreement with the all-E structures of 67– 72 and are collected with their assignments in Table 21. For comparison, the chemical shift values of 66 and the chemical shift differences between 67– 72 and 66 are also given.
In the spectrum of 67, the signals of C110 and C120 (changed to sp3 hybridization from sp2) are shifted to the high-field part of the spectrum, i.e. the saturation of the 110, 120
H3CO |
|
|
15 |
9′ |
5′ |
1′ |
|
|
|
13′ |
|||
1 |
5 |
9 |
13 |
|
|
|
|
|
|
15′ |
|
|
|
|
|
|
(66) |
|
|
|
H3CO |
|
|
15 |
12′ |
|
1′ |
|
|
|
|
|
|
|
1 |
|
|
15′ |
11′ |
|
|
|
|
|
|
|
||
|
|
|
(67) |
|
|
|
H3CO |
3 |
|
15 |
12′ |
|
1′ |
|
|
|
|
|
|
|
1 |
|
|
15′ |
11′ |
|
|
|
4 |
|
|
|
||
|
|
|
|
|
|
(68)
105

H3CO |
3 |
|
|
15 |
1 |
|
15′ |
|
4 |
|
|
(69) |
|
|
|
H3CO |
3 |
|
|
15 |
|
|
|
1 |
|
5 |
|
|
|
|
4 |
6 |
(70) |
15 |
′ |
|
|
|
|||||
|
|
|
|
|||
H3CO |
3 |
|
7 |
15 |
|
|
|
1 |
4 |
8 |
|
15 |
′ |
|
|
(71) |
||||
|
|
|
|
|||
H3CO |
|
|
|
|
15′ |
|
|
|
|
|
|
|
|
|
|
|
|
15 |
|
|
(72)
106
1′
1′
1′
1′

|
|
2. NMR spectroscopy of dienes and polyenes |
|
107 |
|||
TABLE 19. |
1H NMR chemical shift values (ppm) of all-E 66 – 72a |
|
|
||||
H |
66 |
67 |
68 |
69 |
70 |
71 |
72 |
|
|
|
|
|
|
|
|
2 |
2.32 |
2.32 |
1.45 |
1.45 |
1.30 |
1.40 |
2.32 |
3 |
5.72 |
5.71 |
1.45 |
1.45 |
1.30 |
1.40 |
5.73 |
4 |
6.16 |
6.15 |
2.10 |
2.10 |
1.15/1.3 |
1.95 |
6.16 |
5 |
— |
— |
— |
— |
1.54 |
— |
— |
6 |
6.11 |
6.10 |
5.96 |
5.95 |
1.95/2.1 |
5.12 |
6.10 |
|
|
|
0.15 |
0.16 |
|
|
|
7 |
6.60 |
6.58 |
6.47 |
6.50 |
5.69 |
2.10 |
6.63 |
|
|
|
0.13 |
0.10 |
C0.09 |
|
|
8 |
6.35 |
6.34 |
6.24 |
6.24 |
6.12 |
2.10 |
6.33 |
|
|
|
0.09 |
0.09 |
0.23 |
|
|
10 |
6.22 |
6.21 |
6.17 |
6.18 |
6.09 |
5.95 |
6.19 |
|
|
|
|
|
0.13 |
0.27 |
|
11 |
6.63 |
6.59 |
6.59 |
6.62 |
6.59 |
6.48 |
6.38 |
|
|
|
|
|
|
0.15 |
C0.07 |
12 |
6.37 |
6.35 |
6.34 |
6.35 |
6.33 |
6.24 |
6.38 |
|
|
|
|
|
|
0.13 |
|
14 |
6.26 |
6.21 |
6.19 |
6.27 |
6.23 |
6.19 |
5.72 |
|
|
|
0.07 |
|
|
0.07 |
0.54 |
15 |
6.61 |
6.49 |
6.49 |
6.61 |
6.60 |
6.59 |
— |
150 |
|
0.12 |
0.12 |
|
|
|
|
6.62 |
6.49 |
6.49 |
6.61 |
6.60 |
6.59 |
— |
|
140 |
|
0.13 |
0.13 |
|
|
|
|
6.20 |
5.98 |
5.96 |
6.22 |
6.19 |
6.19 |
5.68 |
|
120 |
|
0.22 |
0.24 |
|
|
|
0.52 |
6.23 |
2.12 |
2.12 |
6.25 |
6.24 |
6.24 |
6.25 |
|
110 |
6.50 |
2.05 |
2.06 |
6.48 |
6.50 |
6.48 |
6.57 |
100 |
|
|
|
|
|
|
C0.07 |
5.95 |
5.10 |
5.10 |
5.95 |
5.95 |
5.95 |
5.93 |
|
80 |
2.12 |
2.05 |
2.05 |
2.10 |
2.15 |
2.10 |
2.05 |
70 |
2.05 |
2.05 |
2.05 |
2.10 |
2.05 |
2.10 |
2.05 |
60 |
5.12 |
5.10 |
5.10 |
5.10 |
5.12 |
5.12 |
5.12 |
40 |
2.05 |
2.05 |
2.05 |
2.10 |
2.05 |
2.10 |
2.05 |
30 |
2.05 |
2.05 |
2.05 |
2.10 |
2.05 |
2.10 |
2.05 |
20 |
5.10 |
5.10 |
5.10 |
5.10 |
5.10 |
5.10 |
5.10 |
1- CH3 |
1.16 |
1.15 |
1.14 |
1.14 |
1.14 |
1.13 |
1.16 |
5-CH3 |
1.93 |
1.92 |
1.81 |
1.81 |
0.88 |
1.61 |
1.93 |
9-CH3 |
|
|
0.12 |
0.12 |
|
0.32 |
|
1.98 |
1.97 |
1.96 |
1.96 |
1.91 |
1.82 |
1.99 |
|
|
|
|
|
|
0.07 |
0.16 |
|
13-CH3 |
1.95 |
1.93 |
1.94 |
1.96 |
1.94 |
1.94 |
2.10 |
130 -CH3 |
|
|
|
|
|
|
C0.15 |
1.97 |
1.80 |
1.81 |
1.95 |
1.95 |
1.94 |
2.09 |
|
90 -CH3 |
|
0.17 |
0.16 |
|
|
|
C0.12 |
1.82 |
1.60 |
1.60 |
1.82 |
1.82 |
1.82 |
1.83 |
|
50 -CH3 |
|
0.22 |
0.22 |
|
|
|
|
1.61 |
1.60 |
1.60 |
1.60 |
1.61 |
1.61 |
1.62 |
|
10 -CH3E |
1.68 |
1.68 |
1.68 |
1.68 |
1.68 |
1.68 |
1.68 |
10 -CH3Z |
1.60 |
1.60 |
1.60 |
1.60 |
1.60 |
1.60 |
1.61 |
OCH3 |
3.25 |
3.25 |
3.17 |
3.17 |
3.17 |
3.16 |
3.23 |
aIn parentheses relevant chemical shift differences from 66 of more than š0.05 ppm are given.
108 |
|
Yoshito Takeuchi and Toshio Takayama |
|
|
|||
TABLE 20. |
Values of |
the 1H – 1H |
coupling constants |
as |
obtained from |
the spectra of |
66 – 72 |
(Ł , obtained by spectral simulation; nd, not determined, due to overlap of signals) |
|
||||||
3J(HH) |
66 |
67 |
68 |
69 |
70 |
71 |
72 |
H2H1 |
7.5 |
7.4 |
— |
— |
— |
— |
7.4 |
H3H4 |
15.5 |
15.6 |
— |
— |
— |
— |
15.8 |
H6H7 |
11.9 |
11.3 |
10.9 |
11.3 |
6.3 |
— |
11.3 |
H7H8 |
15.0 |
14.9 |
15.2 |
15.0 |
15.3 |
— |
15.0 |
H10H11 |
11.3 |
11.3 |
11.3 |
11.7 |
11.2 |
10.9 |
11.3 |
H11H12 |
14.8 |
14.8 |
15.0 |
14.9 |
15.5 |
15.1 |
14.9 |
H14H15Ł |
10.7 |
11.0 |
11.0 |
nd |
11.5 |
11.5 |
— |
H15H150Ł |
14.0 |
14.6 |
14.6 |
nd |
14.5 |
14.5 |
— |
H150 H140Ł |
11.0 |
11.0 |
11.0 |
nd |
11.5 |
11.5 |
— |
H130 H110 |
15.0 |
— |
— |
15.2 |
15.1 |
15.1 |
15.1 |
4J (HH) |
|
1.1 |
1.1 |
|
0.9 |
0.9 |
|
H140 H15Ł |
nd |
nd |
— |
||||
H14H150Ł |
nd |
1.1 |
1.1 |
nd |
0.9 |
0.9 |
— |
bond in 67 shows a pronounced effect on the carbon atoms of the polyene chain compared with 66. C130 is shifted downfield by 3.7 ppm and an upfield shift of 5.6 ppm is observed for C140 . The chemical shift values of the carbon atoms 10, 12, 14, 150 are not affected, while an upfield shift is observed for C9 (0.4 ppm), C11 (0.5 ppm), C13 (0.6 ppm) and C15 (2.2 ppm). The 110, 120 single bond in 67 also affects the chemical shift of the 130- CH3 group: it is located 4.2 ppm downfield from the 130 -CH3 group in 66. As can be seen in Table 21, similar effects are observed for the chemical shifts of the polyene carbons 3, 4, 5 and 6 upon saturation of the 3, 4 bond, the 5, 6 bond and the 7, 8 bond, respectively. This effect, which has previously been noted for short polyenes, can be generalized as follows: removal of a double bond in a polyene chain leads to a downfield shift of ca 4 ppm of the signal of the ˛-carbon atom. An upfield shift is observed for the chemical shift of the ˇ, υ and olefinic carbon atoms (decreasing with increasing distance), while the chemical shift values of the , and carbon atoms changed only slightly.
In the 1H noise-decoupled 75.5 MHz 13C NMR spectrum of 72, the signals of the sp-hybridized carbon atoms C15 and C150 are found at 98.3 and 97.3 ppm. This is in the expected region for substituted alkynes and the chemical shifts agree very well with those of other didehydrocarotenoids. As can be seen in Table 21, the 15,150 -triple bond leads to an upfield shift of ca 22 ppm for the directly connected C14 and C140 . The chemical shifts of the other carbon atoms of the polyene chain are also affected: a downfield shift is observed for the odd carbon atoms and a (slight) upfield shift for the even carbon atoms, both decreasing with increasing distance from the central part.
Hand and coworkers43 reported an effect of electron-donating and electron-withdrawing substituents on 1H and 13C NMR chemical shifts of novel 70 -aryl-substituted 70 -apo-ˇ- carotenes. Their synthesis, where aryl(Ar) is C6F5, 4-O2NC6H4, 4-(MeO2C)C6H4, 2,4,6- Me3C6H2, Ph and 4-MeOC6H4 (73a–f), was described. NMR chemical shifts of all H- and C-nuclei are presented, together with specific examples of the spectra. In contrast to 1H chemical shifts which, except for HC80 and HC70 , did not differ greatly from those of ˇ,ˇ-carotene, considerable variations in 13C chemical shifts were observed.
In 73a–f, 13 of the 14 olefinic protons give rise to 1H NMR signals within 0.50 ppm of each other; in the spectrum of 73d all olefinic signals fall within this range. Thus, even at relatively high frequency (360 MHz), extensive overlap occurs (Figures 17 – 20).