

2. NMR spectroscopy of dienes and polyenes |
149 |
(a)
200 |
150 |
100 |
50 |
0 |
|
|
δ (ppm) |
|
|
(b)
200 |
150 |
100 |
50 |
0 |
−50 |
|
|
δ (ppm) |
|
|
|
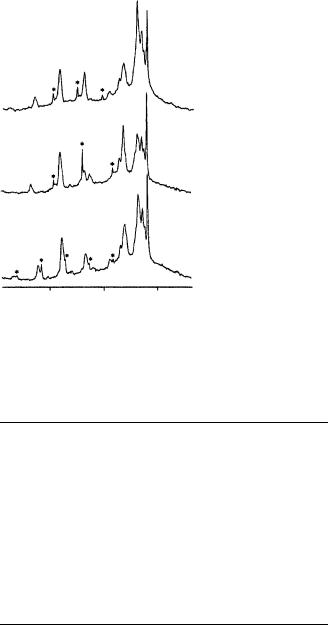
FIGURE 38. (a) 13C CP/MAS spectrum of THY after 56 h. The proposed structure from this spectrum is the ladder polymer 101 shown in Figure 37. (b) The spectrum after 11 days. The proposed structure from this spectrum is the ladder polymer 102 shown in Figure 37. Reprinted with permission from Reference 53. Copyright (1994) American Chemical Society

150 Yoshito Takeuchi and Toshio Takayama
relative to those of the side chain acetylene carbons (60 – 95 ppm), and signal patterns in the region for the unsaturated carbons became simpler than in the spectrum in Figure 36(b). The spectra measured successively during these periods indicate that the second step of polymerization occurred at the - and -positions of 100 in the 1,4-polymerization scheme to produce a new ladder polymer (101), as presented in Figure 37 (the symbols defining the carbons are also indicated). Such a ladder-type structure with an extended -electron system was also supported by the absorption in the >900 nm region described above. The 13C chemical shifts of 101 are summarized in Table 37.
Since polymer 101 has a symmetrical structure, the number of nonequivalent carbons in the conjugated system was expected to be five with an intensity ratio of 1 : 1 : 2 : 1 : 1, which corresponds to the carbon positions A : D : B C C : ˇ : ˛. The 13C chemical shift values are also expected to remain similar to those of 100. Subsequently, five peaks were observed at 147, 110, 105, 82 and 67 ppm having relative intensities of 1 : 1 : 2 : 1 : 1, as shown in Figure 38. The signals at 82 and 67 ppm were assigned to the ladder carbons at the ˇ- and ˛-positions of the polydiacetylene chains, respectively. The three different methylene peaks from 30 to 34 ppm were assigned to the long chain carbons 3 – 13 in different stacked states in the solid state. In Figure 38, broad signals were observed around 120 – 170 and 190 ppm, and their intensity gradually increased. The rate of spectral change slowed down at this stage.
After 11 days, the alkyl carbon signals became simpler and only four peaks were observed, as shown in Figure 38(b). In this spectrum, the backbone acetylene and olefin carbon signals (100 – 150 ppm) were observed. The integrated intensity of the ladder carbon signals between 60 and 90 ppm accounted for 30% of the signals for unsaturated carbons (60 – 220 ppm).
Since the starting monomer of THY is a hydrocarbon and the reactions took place spontaneously in the solid state, the resulting polymer should be a hydrocarbon. No oxidation was confirmed from the IR spectra. The most likely chemical structures giving signals in the region >180 ppm are allenes. It was assumed54 that the predominant structures of the final polymer are allene-type ladder polymers 102, as shown in Figure 37. There are few 13C shift data to examine for these allene structures. It has been confirmed that the solid-state 13C shifts of tetraphenylbutatriene agree well with the solution data for the ˛- and ˇ-cumulene carbons to the phenyl groups, which are at 124.1 and 152.9 ppm,
TABLE 37. 13C chemical shifts (CP/MAS) of 101
101 |
Assignmenta |
147 |
A |
110 |
D |
107 |
B, C |
82 |
ˇ |
67 |
˛ |
37b |
14 |
33.8c , 30.6c,d |
4 – 13 |
32.5 |
3 |
23.4 |
2 |
14.5 |
1 |
aFor labeling of structure 101 see Figure 37. bBroad signal.
cMany overlapping peaks. dMobile methylene carbons.
2. NMR spectroscopy of dienes and polyenes |
151 |
respectively. The effect of the number of double bonds has been studied in solution, and the carbons at the ˇ-position from the substituents in the allenes having an even number of double bonds with an odd number of sp-carbons give peaks between 180 and 210 ppm. From comparison with the data of 2,4-dimethyl-2,3-pentadiene and tetraphenylpropadiene, the 13C chemical shift values of the ˛- and ˇ-carbons of the methyl derivative shift about 20 and 10 ppm to a lower field, respectively. Although model compounds for the proposed structure of 102 could not be found and the substituent effects on the 13C chemical shifts for longer allene systems are uncertain, the 13C chemical shift values observed in Figure 38(a) seem reasonable.
The 13C NMR spectra were measured regularly over 6 months (190 days) and the polymer structure became almost stable after this period. After 6 months, the relative intensities in the unsaturated carbon region were independent of CP time. The alkyl signal positions became constant after 11 days (Figure 38(b)). However, their line width gradually broadened to double the width after 6 months.
Smith and coworkers55 reported a solid-state NMR study of the mechanism of the opsin shift in the visual pigment rhodopsin. They have presented solid-state NMR spectra of rhodopsin and isorhodopsin regenerated with retinal containing 13C labels at each position along the conjugated chain of the chromophore. Comparison of the 13CŁ chemical shifts observed in the pigment with the corresponding chemical shifts of retinal PSB model compounds allowed them to examine the mechanism of the opsin shift in these pigments.
The chemical shifts for 13C5, 13C6, 13C14 and 13C15 correspond closely to the chemical shifts observed in the 9-cis and 11-cis PSB model compounds (shown below), while differences in chemical shifts are observed for C8 through C13, with the largest differences in both pigments localized at C13. These data provide support for the model of the opsin shift, which relies on a protein perturbation in the vicinity of C13. Concurrently, the results argue that the factors regulating the absorption wavelength in another wellstudied retinal protein, bacteriorhodopsin, namely protein perturbations near the ˇ-ionone ring (C5-Ð Ð ÐC7), a 6-s-trans single bond and a weak hydrogen-bonding interaction with the Schiff base counterion, are not important in rhodopsin and isorhodopsin. Finally, in isorhodopsin a substantial shift is observed at C7, and only a small shift is present at C12. Taken together with resonance Raman results, these observations suggest that 9-cis- and 11-cis-retinals reside differently in the opsin binding pocket, in line with their significantly different opsin shifts (ca 1000 cm 1 less for isorhodopsin).
The general strategy for establishing the sites of protein – chromophore interactions in rhodopsin involves introduction of selective 13C labels at each position along the length of the retinal chromophore.
Differences in the 13C chemical shifts between rhodopsin and retinal PSB model compounds reveal the regions of the chromophore where changes occur in the retinal’s structure or environment. Figure 39 presents several solid-state 13C NMR spectra of rhodopsin that illustrate the resolution and sensitivity which can be obtained by using MAS methods.
In these spectra, the protein has been regenerated with retinal specifically 13C labeled at positions 11, 12 and 13, and in each case the retinal resonance exhibits a sharp centerband at the isotropic chemical shift and is flanked by rotational sidebands. Other lines in the spectrum are the natural-abundance 13C resonances of the protein carbonyls (ca 175 ppm) and aliphatic carbons (0 – 100 ppm). Contributions from the Ammonyx-LO detergent in these spectra are seen in the different intensities in the 0 – 100 ppm region. AmmonyxLO does not exhibit NMR resonances above 100 ppm. Spectra of the 9-cis pigment isorhodopsin are similar. Table 38 summarizes the isotropic chemical shifts from the solidstate NMR spectra of rhodopsin regenerated with retinal 13C labeled at each position along

152
H3C |
CH3 |
|
CH3 |
H |
|
|
|
|
|
7 |
|
9 |
11 |
H |
|
|
|
|
|
|
|
|
||||
|
|
6 |
8 |
10 |
|
12 |
|
|
|
|
|
|
|
|
13 |
|
|
|
5 |
|
|
H3C |
|
|
||
|
|
|
|
|
|
|||
|
|
CH3 |
|
|
14 |
|
|
|
|
|
|
|
|
|
|
|
|
|
|
|
|
|
|
15 |
+ |
H |
|
|
|
|
|
|
|
||
|
|
|
|
|
|
H |
N |
|
|
|
|
11-cis PSB |
|
H |
|
protein |
|
|
|
|
|
|
|
|||
H
H3C |
CH3 |
CH3 |
|
|
H |
|
9 |
|
10 |
11 |
H |
CH3 |
12 |
13
H3C 14
15 + H
H N
9-cis PSB
H protein
H
2. NMR spectroscopy of dienes and polyenes |
153 |
(a) 13C-11 Rhodopsin
(b)13C-12
(c)13C-13
200 |
100 |
0 |
Chemical shift (ppm) |
|
|
FIGURE 39. MAS 13C NMR spectra of (a) 13C-11, (b) 13C-12 and (c) 13C-13 rhodopsin. Centerbands and rotational sidebands of the retinal resonances are marked with asterisks. Reprinted with permission from Reference 55. Copyright (1990) American Chemical Society
TABLE 38. 13C chemical shifts (ppm)a for rhodopsin and 11-cis PSB model compounds
Position |
Rhodopsin |
11-cis-PSB |
|
|
|
|
Cl b, n-propylc |
ClO4 |
b, t-butylc |
5 |
130.3 |
131.7 |
|
132.0 |
6 |
137.7 |
137.2 |
|
137.5 |
7 |
132.3 |
132.3 |
|
132.2 |
8 |
139.2 |
137.2 |
|
137.0 |
9 |
148.5 |
146.6 |
|
146.8 |
10 |
127.8 |
126.4 |
|
127.7 |
11 |
141.6 |
137.5 |
|
139.1 |
12 |
132.1 |
129.0 |
|
129.4 |
13 |
168.9 |
162.7 |
|
166.0 |
14 |
121.2 |
121.3 |
|
119.5 |
15 |
165.4 |
163.9 |
|
160.0 |
19 |
12.0 |
12.5 |
|
12.5 |
20 |
168.8 |
18.8 |
|
18.0 |
aChemical shifts are referenced to TMS. bDesignates the counterion to the PSB. c Amine used to form the Schiff base.
154 |
Yoshito Takeuchi and Toshio Takayama |
the conjugated polyene chain. These data are compared with chemical shifts from two 11- cis PSB salts which differ in the amine and acid used to form the protonated Schiff base. The max for the all-trans-retinal PSB perchlorate salt is at ca 470 nm in CCl4 compared to ca 440 nm for the chloride salt. Thus, the bulky ClO4 counterion and t-butyl group may be inducing a weaker hydrogen bond at the Schiff base.
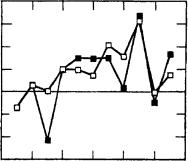
The differences in chemical shift observed between rhodopsin and the 11-cis PSB chloride salt are plotted in Figure 40. The shifts of 13C5 through 13C7, 13C14 and 13C15 in rhodopsin are close to their values in the 11-cis PSB model compound, while larger shift differences are observed at 13C11 (4.1 ppm), 13C12 (3.1 ppm) and 13C13 (6.2 ppm).
Table 39 summarizes the isotropic chemical shifts from the 13C NMR spectra of isorhodopsin along with chemical shift data from the 9-cis PSB chloride salt. The difference in chemical shifts between isorhodopsin and the 9-cis PSB are qualitatively similar to the differences observed between rhodopsin and the 11-cis PSB with the exception of C7, where a 4.3 ppm chemical shift difference is observed, and C12, where the difference, amounting to about 3 ppm in rhodopsin, has now vanished.
Some possible explanations for these differences in isorhodopsin are considered below. In both rhodopsin and isorhodopsin, the largest chemical shift difference is observed at C13. Recently, an analysis of the solid-state NMR spectrum of 13C12 rhodopsin suggested that both the isotropic chemical shift and individual shift tensor elements shifted relatively to their values in bR56. These results were interpreted as indicating a strong protein interaction at C12. The authors have reexamined these shifts and found that, although the isotropic chemical shift moves slightly in comparison to the PSB model compounds129 ! 132 ppm , the principal values of the chemical shift tensor are largely unperturbed ( 11 D 58 ppm, 22 D 133 ppm, 33 D 212 ppm). This is illustrated in Figure 41, where difference spectra between labeled and unlabeled rhodopsin highlight the retinal resonance, and are compared with simulations using the shift tensor values obtained from the all- trans PSB model compound (Figure 41b) and from the previous 13C12 rhodopsin spectra of Mollevanger and coworkers56 (Figure 41c). In these spectra, the centerband (at the isotropic chemical shift) is at ca 130 ppm and is flanked by rotational sidebands spaced at the spinning frequency. The relative intensities of the centerbands and sidebands determine
Chemical shift difference
|
8 |
|
|
6 |
|
(ppm) |
4 |
|
2 |
||
|
||
|
0 |
−2
−4
−6
4 |
6 |
8 |
10 |
12 |
14 |
16 |
Retinal carbon
FIGURE 40. Plot of the differences in chemical shift observed between rhodopsin and the 11-cis- retinal PSB chloride salt (open squares), and between isorhodopsin and the 9-cis-retinal PSB chloride salt (closed squares), for retinal carbons along the polyene chain. Reprinted with permission from Reference 55. Copyright (1990) American Chemical Society

|
2. NMR spectroscopy of dienes and polyenes |
155 |
||
|
TABLE 39. |
13C chemical shifts (ppm)a |
for isorhodopsin |
|
|
and the 9-cis PSB n-butylammonum chloride salt |
|
||
|
|
|
|
|
|
|
Isorhodopsin |
9-cis PSB |
|
|
|
|
|
|
5 |
130.5 |
132.0 |
|
|
6 |
137.0 |
136.4 |
|
|
7 |
128.2 |
132.5b |
|
|
8 |
131.1 |
129.2 |
|
|
9 |
147.5 |
144.5 |
|
|
10 |
130.8 |
127.9 |
|
|
11 |
139.3 |
136.3 |
|
|
12 |
133.9 |
133.6b |
|
|
13 |
169.2 |
162.5 |
|
|
14 |
119.0 |
120.0 |
|
|
15 |
166.5 |
163.2 |
|
|
19 |
19.8 |
20.9 |
|
|
20 |
13.6 |
14.3 |
|
|
|
|
|
|
|
|
aAll chemical shifts are referenced to TMS. |
|
|
|
|
bThe assignments of the C7 and C12 resonances in the 9-cis PSB may |
|
||
|
be reversed since on-resonance decoupling affects both resonances. |
|
||
(a) |
13C−12 Rhodopsin |
|
|
|
|
2.36 kHz |
2.84 kHz |
|
|
(b)
(c)
200 |
150 |
100 |
200 |
150 |
100 |
|
|
Chemical shift (ppm) |
|
|
|
FIGURE 41. Solid-state NMR spectra of the 13C-12 retinal resonance in rhodopsin (a) obtained by taking the difference between 13C-12 rhodopsin and unlabeled rhodopsin spectra. Spectra were obtained at two spinning speeds, 2.36 kHz (left) and 2.84 kHz (right), and are compared with simulations (b and c) based on different chemical shift tensors. The simulations in (b) are for a chemical shift tensor having the principal tensor elements of the all-trans PSB chloride salt ( 11 D 58, 22 D 133,33 D 212), while the simulations in (c) use the shift tensor values ( 11 D 41, 22 D 149, 33 D 209) obtained for 13C12 rhodopsin by Mollevanger and coworkers56. Reprinted with permission from Reference 55. Copyright (1990) American Chemical Society
156 |
Yoshito Takeuchi and Toshio Takayama |
the chemical shift tensor. Comparison of the intensity of the first sideband with the centerband intensity clearly shows the difference between the two simulations.
The experimental data closely resemble the simulation based on the all-trans PSB values. The discrepancy between the two solid-state NMR studies on rhodopsin arises in part from a difference, in signal-to-noise ratio and in part from possible problems associated with a fatty acid resonance which overlaps with the centerband in the previous study. The simulations illustrate the sensitivity of the sideband intensities to changes in the chemical shift tensor, as well as the quality of data necessary to accurately determine the shift tensor values.
2. 2H static NMR
Ulrich and coworkers57 reported a distorted structure analysis of the retinal chromophore in bacteriorhodopsin resolved by 2H NMR. Measuring the orientations of its individual methyl groups reveals structural details about the geometry of the retinal chromophore in the binding pocket of bacteriorhodopsin. Solid-state 2H NMR measurements were performed on macroscopically oriented samples of purple membrane patches, containing retina specifically deuterium-labeled at one of the three methyl groups along the polyene chain (C18, C19, C20). The deuterium quadrupole splitting of each ‘zero-tilt’ spectrum is used to calculate the orientation of the corresponding C CD3 bond vector with respect to the membrane normal; however, two possible solutions may arise. These ambiguities in angle could be resolved by recording a tilt series of spectra at different sample inclinations to the magnetic field and analyzing the resulting complex line shapes with the aid of computer simulations. The angles for the C18, C19 and C20 group are found to be 37 š 1°, 40 š 1° and 32 š 1°, respectively. These highly accurate values imply that the polyene chain of the retinal chromophore is not straight but rather has an in-plane curvature and possibly an out-of-plane twist. Together with the angles of the remaining methyl groups on the cyclohexene ring that have been measured previously, an overall picture has thus emerged of the intramolecular conformation and the three-dimensional orientation of retinal within bacteriorhodopsin. The deduced geometry confirms and refines the known structural information on the chromophore, suggesting that this 2H NMR strategy may serve as a valuable tool for other membrane proteins.
Immobilized proteins in uniaxially oriented membrane samples give rise to highly characteristic 2H NMR spectra, when labeled at one specific position such as an individual methyl group. The deuterium quadrupole splitting and the spectral line shapes contain information about the bond vector that can be used for the structure determination58. Note that, due to the rapid spinning of the methyl group in the otherwise immobilized sample, the orientation of the three deuterium atoms are time-averaged and the effective bond vector corresponds to the methyl-rotor axis. Generally, there exists a simple relationship between the spectral quadrupole splitting Q and the angle of a C CD3 bond vector with respect to the magnetic field direction (equation 3):
Q D 40 3 cos2 1 kHz |
(3) |
The scaling factor of 40 kHz was independently determined at 60 °C from the powder spectrum of a random dispersion of a deuteriated PM sample59. This value was furthermore confirmed in the simulations of the 2H NMR tilt series for each of the three labeled methyl groups, according to the total spectral width and line-shape arguments discussed by Ulrich and Watts58.
Simple 2H NMR spectra that can be readily interpreted are observed when the uniaxially oriented sample is aligned with its normal parallel to the spectrometer magnetic field
2. NMR spectroscopy of dienes and polyenes |
157 |
direction (‘zero-tilt’ spectrum). These spectra consist of a pair of resonances, separated by a certain quadrupole splitting which is determined by the orientation of the methyl group on the protein. In this experimental geometry, all the labeled bond vectors make the same angle with the sample normal and therefore also with the spectrometer field direction. All deuteriomethyl groups thus contribute the same quadrupole splitting Q to the overall spectral line shape. In practice, when the alignment of the membrane fragments in the sample plane is less than perfect, the mosaic spread of the sample gives rise to a certain degree of spectral line broadening.
From the quadrupole splitting in the zero-tilt spectrum of a single labeled methyl group, it should be straightforward to calculate the angle of that group relative to the membrane normal, using equation 3. However, only the absolute value and not the sign of the quadrupole splitting is measured from the spectrum, and positive and negative splittings cannot be discriminated.
Therefore, two solutions to equation 3 are obtained whenever Q < 40 kHz, which corresponds to the range of angles between 35° and 90°. To resolve this ambiguity, Ulrich and Watts58 have recently developed a strategy by which the value of the angle can be extracted uniquely from a series of measurements of the oriented sample at different inclinations to the spectrometer field. The line shapes of such a tilt series are considerably more complex than the simple zero-tilt spectrum described above, because the bond vectors are distributed over a range of different angles. Consider a cone of methyl group bond vectors being progressively tilted with respect to the reference direction of the spectrometer field. Depending on the cone opening angle , at any particular alignment relative to the field, the bond vectors assume a discrete range of angles. They all contribute their respective quadrupole splitting to the overall spectral line shape, which can be computed by summing up these overlapping contributions weighted by their corresponding probability density. A full tilt series can thus be analyzed quantitatively with the aid of computer simulations, or qualitatively by eye, revealing both the value and the sign of the quadrupole splitting, from which the angle is unambiguously defined between 0° and 90° with respect to the membrane normal.
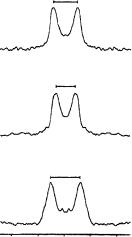
The 2H NMR spectra from three different bR samples (dark adapted) are shown in Figure 42, where the retinal is selectively deuteriated in the C18, C19 or C20 methyl group, respectively. The uniaxially oriented PM patches were measured with the membrane normal parallel to the spectrometer magnetic field, at 60 °C. Measurements at room temperature gave essentially the same spectra but with a poorer signal-to-noise ratio, and the line shapes were obscured by an isotropic resonance from the residual deuterium in the water. In each of the zero-tilt spectra in Figure 42, two broad resonances are seen with a respective quadrupole splitting (absolute value) of 36 kHz (for C18), 30 kHz (for C19) and 46 kHz (for C20). The initial step in the analysis consists of calculating the corresponding value(s) for from equation 3. In the case of the C20-labeled retinal with a46 š 1 -kHz splitting, the angle between the C CD3 vector and the membrane normal is found to be D 32 š 1°. This solution is unambiguous, because the quadrupole splitting is larger than 40 kHz and must therefore be positive. The other two quadrupole splittings of 36 and 30 kHz from the C18 and C19 deuteriomethyl groups, on the other hand, each gives rise to two possible bond angles, depending on the sign of the splitting, which is not known. That is, with a measured Q of 36 kHz, a bond angle of D 37° or 73° is calculated for the C18 group, and a Q of 30 kHz for C19 gives D 40° or 73°, for positive or negative splitting, respectively. The correct bond angle can be distinguished by measuring a tilt series of 2H NMR spectra, as illustrated in Figure 43.
The experimental data from the C19 deuteriomethyl group are given in the middle column, at seven different sample inclinations (˛, angle between sample normal and spectrometer field direction) from 0° to 90° in the spectrometer. For comparison, the line shapes predicted by computer simulation are shown on either side of the experimental
158 |
Yoshito Takeuchi and Toshio Takayama |
36 kHz
C18
30 kHz
C19
46 kHz
C20
−80 −40 0 40 80 kHz
FIGURE 42. 2H NMR spectra from three different bR samples containing retinals with the individually deuterium-labeled methyl groups C18, C19 and C20. Reprinted with permission from Reference 57. Copyright (1994) American Chemical Society
tilt series, with the simulation for D 40° in the left-hand column and for D 73° in the right-hand column. Note that only the zero-tilt simulations at ˛ D 0° in the top row are indistinguishable, regardless of the sign of the 30 kHz quadrupole splitting, which is positive in the left column ( D 40°) and negative in the right column ( D 73°).
Across the whole tilt series in Figure 43, a close resemblance is seen between the experimental spectra in the middle column with the simulated line shapes on the left ( D 40°) but not with those on the right ( D 73°). Therefore, the angle is uniquely identified to be 40 š 1° for the deuteriated C19 group on retinal. A similar analysis for the C18 group ( Q D 36 kHz) yields an angle of 37 š 1° , and the other possible value of 79° is rejected. The experimental spectra of that tilt series plus those of C20 ( Q D 46 kHz,D 32°, see above) are shown in Figure 44, together with the superimposed best-fit line shape simulations.
The analysis of a full tilt series of 2H NMR spectra not only allows the determination of the unique bond angle for a deuteriated methyl group, but also provides an internal check for the consistency of the spectral interpretation. In particular, simulations provide a means for the analysis of line-broadening effects, which arise from the sample mosaic spread as well as the intrinsic line width of the nuclear transition and instrumental factors. When line shapes are fitted to a full tilt series of spectra in a concerted manner and are also compared with the powder spectrum of an unoriented sample, the different contributions can be discerned. In that way an intrinsic line width of around 2 kHz is found for the spectra shown here, together with a mosaic spread between š8° and š10° for the three samples.
From the good fit to the experimental spectra it is thus evident that one characteristic angle describes the whole tilt series and that the underlying cone model for the bond vectors is consistent. The accuracy of the angles determined is estimated to be within