

2. NMR spectroscopy of dienes and polyenes |
169 |
TABLE 41. Complexation shifts ( υa, 300 MHz, CD3OD) induced by TRIMEB on the two enantiomers of allenes 105a – e
Allene |
|
υS |
|
|
υR |
|
T °C |
Molar |
|
H |
Me |
t-Bu |
H |
Me |
t-Bu |
ratio |
|
105a |
9.88 |
3.48 |
3.30 |
7.69 |
2.38 |
2.93 |
25 |
1 : 1 |
105b |
40.55 |
11.16 |
8.20 |
29.88 |
7.93 |
6.55 |
20 |
1 : 1 |
7.05 |
5.14 |
4.12 |
5.43 |
4.18 |
3.68 |
25 |
1 : 1 |
|
105c |
23.83 |
12.52 |
10.27 |
15.59 |
9.22 |
7.89 |
20 |
1 : 1 |
4.86 |
1.72 |
1.62 |
2.21 |
0.47 |
0.59 |
25 |
1 : 1 |
|
105d |
22.75 |
9.02 |
7.78 |
11.58 |
5.01 |
4.49 |
20 |
1 : 1 |
9.15 |
4.40 |
4.40 |
5.67 |
2.20 |
2.57 |
25 |
1 : 2 |
|
105e |
67.41 |
21.70 |
25.35 |
42.05 |
10.99 |
14.55 |
40 |
1 : 2 |
8.23 |
4.03 |
3.66 |
3.94 |
1.83 |
1.47 |
25 |
1 : 1 |
|
|
26.85 |
11.88 |
10.50 |
10.14 |
5.42 |
4.64 |
20 |
1 : 1 |
a υ D υmixture υfree, Hz.
MeO |
|
|
|
|
|
|
EtO |
|
|
|
|
|
|
|
|||
1 |
2 |
|
|
|
3 |
1 |
2 |
|
|
3 |
|
||||||
|
|
|
C |
|
|
CH2 |
|
|
|
|
C |
|
|
C |
|||
|
|
|
|
|
|
|
|
|
|
||||||||
Li |
|
|
|
Li |
|
|
|||||||||||
|
|
|
|
|
|
|
|
|
|
|
|
|
|||||
|
|
(106) |
|
|
|
|
|
|
(107) |
|
|
|
|||||
|
|
|
|
|
|
|
|
|
CH3 |
|
|
|
|
|
|
|
|
MeO |
2 |
|
|
|
H |
|
|
|
|
|
|
|
|
|
H |
||
|
|
|
O |
|
|
|
|
|
|
||||||||
1 |
|
|
3 |
|
|
|
|
|
|
||||||||
|
|
|
|
H |
1 |
2 |
|
|
3 |
|
|||||||
|
|
|
|
|
|
|
|
|
|
||||||||
|
|
|
Li |
|
|
|
|
|
|
|
C |
|
|
|
H |
||
|
|
|
|
|
|
|
|
|
|
|
|
|
|||||
|
|
|
|
|
|
Li |
|
|
|
|
|||||||
|
|
|
|
|
|
|
|
|
|
|
|
||||||
|
|
|
|
|
|
|
|
|
|
|
|
|
|
||||
|
|
|
|
|
|
|
|
|
|
|
|
|
|
|
|||
|
|
(108) |
|
|
|
|
|
|
(109) |
|
|
|
|||||
In 106, the 13C signal of C1 is shifted ca 30 ppm downfield and the C3 signal is shifted ca 20 ppm upfield compared with the parent compound. The essentially unchanged C2 signal at ca 195 ppm proves an allenic structure for 106 both in THF and in diethyl ether. The C1 13C signal of a 6Li-labeled lithiomethoxyallene exhibits scalar 13C6Li coupling, a quintuplet [1J 13C6Li D 6.0 Hz] at 100 °C in THF indicates a dimer and a septuplet [1J 13C6Li D 4.5 Hz] at 93° in diethyl ether indicates a tetrameric aggregate (Figure 50).
In addition, the C3 – H coupling constant (from a gated decoupling NMR experiment) of 161.8 Hz in 106 compared with 162 Hz in allenyllithium vs 167.5 Hz in methoxyallene and 168 Hz in allene is also in agreement with an allenic structure. However, neither the C – H coupling constant nor the NMR chemical shifts distinguish between the alternatives that 106 has a nonclassical 1,3-bridged structure 108 (M D Li) or an O-coordinated allenic structure (109). Hence the 6Li, 1H-HOESY NMR technique which can be used to detect close proximities (ca < 3.5 A)˚ between 1H and 6Li nuclei was applied. The HOESY spectrum of ˛-lithiomethoxyallene in THF solution (in which 106 is dimeric) is shown

170
TABLE 42. NMR data (υ in ppm) of ˛-lithiomethoxyallene (106) and 1-lithio-1-ethoxy-3-tert-butylallene (109) and their neutral parent compounds
|
|
C1 |
C2 |
C3 |
C4 |
C5 |
OCH2/OCH3 |
OCH2CH3 |
Methoxyallene |
1H NMR (26 °C,CDCl3 |
6.77 |
|
5.48 |
|
|
3.41 (s) |
|
|
13C NMR (26 °C,CDCl3 |
(t, 6.1 Hz) |
|
(d, 6.1 Hz) |
|
|
|
|
Methoxyallene |
122.8 |
201.1 |
91.2 |
|
|
55.8 |
|
|
106 |
1H NMR ( 86 °C, 0.71 M |
|
|
3.81 (s) |
|
|
3.31 (s) |
|
|
in THF-d4) |
|
|
|
|
|
|
|
106 |
13C NMR ( 100 °C, |
154.1 |
194.1 |
67.0 |
|
|
57.7 |
|
|
0.82 M in THF-d4) |
|
|
|
|
|
|
|
106 |
13C NMR |
150.4 |
195.4 |
69.8 |
|
|
56.7 |
|
|
( 93 °C, 1.26 M in Et2O) |
|
|
|
|
|
|
|
1-Ethoxy-3-tert- |
1H NMR |
6.7 |
|
5.8 |
|
1.1 (s) |
3.6 |
1.3 |
butylallene |
25 °C, CDCl3 |
(d, 6 Hz) |
|
(d, 6 Hz) |
|
|
(q, 6 Hz) |
(t, 6 Hz) |
1-Ethoxy-3-tert- |
13C NMR |
122.5 |
190.1 |
117.1 |
32.9 |
29.2 |
63.4 |
14.3 |
butylallene |
(25 °C, acetone-d6) |
|
|
|
|
|
|
|
107-TMEDA0.5 |
1H NMR |
|
|
4.34 (s) |
|
0.95 (s) |
3.59 |
1.14 |
|
( 30 °C, 0.44 M |
|
|
|
|
|
(q, 6.0 Hz) |
(t, 6.0 Hz) |
|
in THF-d4) |
|
|
|
|
|
|
|
107-TMEDA0.5 |
13C NMR |
159.3 |
188.1 |
96.8 |
32.7 |
31.6 |
64.6 |
16.1 |
|
( 30 °C, 0.44 M |
|
|
|
|
|
|
|
|
in THF-d4) |
|
|
|
|
|
|
|
107 |
13C NMR ( 92 °C, |
157.9 |
186.5 |
95.4 |
31.8 |
30.5 |
63.7 |
14.6 |
|
1.20 M in THF, ext. |
158.0 |
186.4 |
|
|
|
63.6 |
|
|
acetone-d6) |
|
|
|
|
|
|
|
|
2. NMR spectroscopy of dienes and polyenes |
171 |
||
(a) |
1J(13C6Li) = 6.0 Hz |
(b) |
1J(13C6Li) = 4.5 Hz |
|
154.5 |
154.0 |
150.4 |
150.2 |
150.0 |
149.8 |
149.6 |
|
ppm |
|
|
ppm |
|
|
FIGURE 50. C1 13C NMR signal of 6Li-labeled ˛-lithiomethoxyallene (106) in THF-d8 at 100 °C and (b) in diethyl ether at 93 °C. Reprinted with permission from Reference 64. Copyright (1993) American Chemical Society
H3CO
−4
1 |
2 |
3 |
|
||
|
|
C |
|
CH2 |
−3 |
|
|
|
|||
Li |
|
||||
|
|
|
|||
|
|
|
|
||
|
|
|
|
Li |
2 |
|
|
|
6 |
− |
|
|
|
|
|
|
−1 d (ppm) |
|
|
|
|
|
Li |
|
|
|
|
|
6 |
|
|
|
|
|
0 |
|
|
|
|
|
1 |
|
|
|
|
|
2 |
|
|
|
BuLi |
|
butane |
BuLi |
|
= CH2 |
OCH3 |
|
|
BuLi |
1H |
|
|
THF |
|
|
|
|
|
|
|
THF |
|
|
|
5 |
4 |
3 |
2 |
1 |
0 |
−1 |
|
|
|
1H d (ppm) |
|
|
|
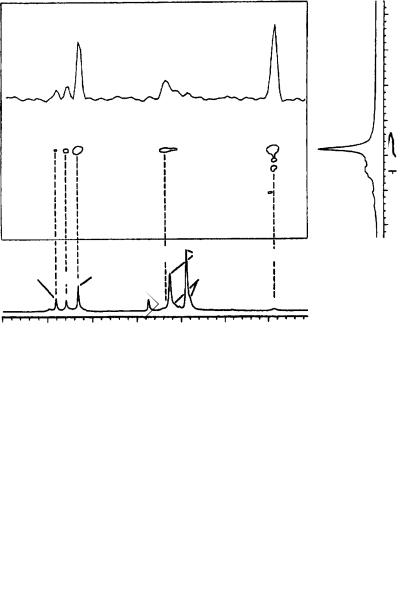
FIGURE 51. 6Li 1H-HOESY spectrum of 6Li-labeled ˛-lithiomethoxyallene (106) (0.71 M) in THF- d8 at 6 °C. Mixing time 2.0 s. Reprinted with permission from Reference 64. Copyright (1993) American Chemical Society
172 |
Yoshito Takeuchi and Toshio Takayama |
in Figure 51. Besides cross peaks between the Li signal and the protons of excessive n- BuLi and of THF, there are two cross peaks involving the lithioallene: one to the methoxy protons at 3.31 ppm and one to the CH2 protons of the allenic moiety at 3.81 ppm.
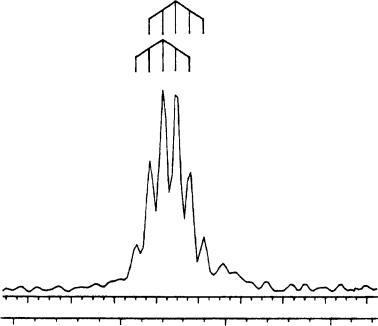
In analogy to 106, significant changes in the 13C NMR spectrum of 107 in THF are only observed for C1 and C3 compared with the neutral parent compound. The C1 13C signal of a 6Li-labeled compound 107 is split into a six-line multiplet (Figure 52).
This is interpreted as the superposition of two quintuplets [1J 13C6Li D 6.5 Hz] which are separated by ca 6.5 Hz.
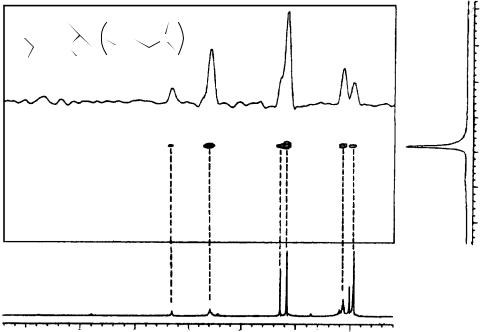
Since 107 is chiral, the two quintuplets are assigned to a pair of enantiomeric dimers (RR-dimer and SS-dimer) and to the diastereomeric meso form of a dimer (RS-dimer). Because both diastereomeric dimers of 107 are formed in approximately equal amounts, the difference in the chemical shift of C1 of both diastereomers is approximately equal to the coupling constant, and a six-line multiplet results. In addition, two equally intense singlets are observed for each C2 and OCH2 carbon atoms of the two diastereomers. A 6Li 1H-HOESY spectrum of 8-TMEDA0.5 in THF (Figure 53; TMEDA D tetramethylethylenediamine) shows 6Li cross peaks to all protons of the lithioallene and the TMEDA molecules. Again, the cross peak due to the H3 proton at 4.34 ppm indicates a 1,3-bridged structure for 107.
1J13C,6Li = 6.5 Hz
158.6 |
158.4 |
158.2 |
158.0 |
157.8 |
157.6 |
157.4 |
157.2 |
157.0 |
|
|
|
|
|
|
|
|
Hz |
15950 |
|
15900 |
|
|
15850 |
|
15800 |
|
|
|
|
|
ppm |
|
|
|
|
FIGURE 52. C1 13C NMR signal of 6Li-labeled 1-lithio-1-ethoxy-t-butylallene (107) in THF-d8 at 92 °C. Reprinted with permission from Reference 64. Copyright (1994) American Chemical Society
EtO 1 2 |
3 |
N |
|||
|
|
C |
|
C |
N |
|
|
|
|||
Li |
|
|
85 |
||
|
|
H |
|||
|
−4 |
|
|
−3 |
|
Li |
|
|
6 |
2 |
|
|
− |
|
|
−1 |
|
|
0 |
ppm |
|
1 |
|
|
2 |
|
|
1 |
H |
|
|
|
|
|
|
|
CH2N |
N(CH3)2 |
|
C(CH3) |
|
|
|
|
|
|
|
|
|
|||||
|
|
|
|
|
|
|
|
|
OCH2CH3 X |
||||
|
|
|
CHBu-t |
OCH2 |
|
|
|
|
|||||
|
|
|
|
|
|
|
|
||||||
|
|
|
|
|
|
|
|
|
|||||
X |
|
X |
|
|
X |
|
X |
|
|||||
|
|
|
|
|
|
|
|
||||||
7 |
|
6 |
5 |
4 |
|
3 |
|
2 |
1 |
|
|||
|
|
|
|
|
|
|
ppm |
|
|
|
|||
FIGURE 53. 6Li 1H -HOESY spectrum of 6Li-labeled 1-lithio-1-ethoxy-t-butylallene (107). TMEDA0.5 in THF-d8 at 60 °C. X denotes signals of the allene. Mixing time 2.0 s. Reprinted with permission from Reference 64. Copyright (1993) American Chemical Society
173

174 |
Yoshito Takeuchi and Toshio Takayama |
Barretta and coworkers63 reported a direct determination of the enantiomeric purity of chiral trisubstituted allenes by using permethylated cyclodextrin as a chiral solvating agent. They found that the heptakis ˇ-cyclodextrin TRIMEB discussed above can be successfully used as a chiral solvating agent (CSA) for the NMR determination of the enantiomeric purity of trisubstituted allenes 110a–f. An accurate analysis of the experimental conditions (molar ratio allene/TRIMEB, temperature and solvent) required to optimize the enantioseparation has been carried out. The 1H NMR spectra of TRIMEB, allenes 110a–f, and the mixtures TRIMEB/allene have been recorded at 300 MHz in CD3OD as solvent.
R1 |
|
|
|
R2 |
C |
|
C |
|
C |
|
|
|||
|
|
|||
Me |
|
|
|
H |
|
(110) |
|
||
(a) R1 = t-Bu, R2 = Br
(b) R1 = Et, R2 = Br
(c) R1 = Pr, R2 = Br
(d) R1 = t-Bu, R2 = Ph
(e) R1 = Et, R2 = Ph
(f) R1 = R2 = t-Bu
The proton spectrum of the permethylated cyclodextrin at room temperature is completely restricted to the region between 3.0 and 4.0 ppm, with the exclusion of the sharp doublet centered at 5.14 ppm. The free allene 110a shows a well-recognizable singlet at 1.09 ppm, due to the absorption of the t-butyl group, and a doublet (J D 2.2 Hz) centered at 1.82 ppm, corresponding to the resonance of the methyl group; in the low-field spectral region, only the quartet centered at 6.01 ppm is present, arising from the proton directly bound to the allene moiety. Similarly, allenes 110b–f show resonances between 0.9 and 2.2 ppm due to the methyl, the alkyl protons R1 (and R2 for 110f) and a well-resolved signal, near 6.0 ppm for 110b–e and near 5.0 ppm for 110f which is due to the allene proton. In the case of allenes 110d and 110e, absorptions between 7.0 and 7.7 ppm are observed, arising from the phenyl protons. Therefore, the absorptions of the allenes and cyclodextrin fall in distinct spectral regions and mutual interference is not observed in the spectra.
By comparing the spectra of the racemic allenes 110a–f in the free state and in the presence of the cyclodextrin, it has been observed that TRIMEB produced duplication of almost all signals of allene. As an example, the well-resolved quartet of the allene proton of free 110a (at 6.01 ppm at 25 °C in CD3OD, Figure 54a) gives two partially superimposed quartets centered at 6.04 and 6.03 ppm (Figure 54b, υ D 3.9 Hz) in the presence of equimolar amounts of TRIMEB. These two absorptions correspond in position to those obtained starting from each enantiomer of allene, respectively, at same allene/TRIMEB molar ratio, total concentration and temperature (Figure 54c,d).
Consequently, the splitting observed is due to the fact that TRIMEB induces nonequivalence in the proton nuclei of the two enantiomers of the allenes, thus enabling one to determine the enantiomeric purities by using a chiral solvating agent. In all cases examined the extent of the nonequivalence, i.e. the difference of the proton chemical shifts of the two enantiomers in the presence of TRIMEB, can be increased by increasing the
2. NMR spectroscopy of dienes and polyenes |
175 |
(a)
(b)
(c)
(d)
6.07 |
6.06 |
6.05 |
6.04 |
6.03 |
6.02 |
6.01 |
6.00 |
5.99 |
|
|
|
|
ppm |
|
|
|
|
FIGURE 54. 1H NMR spectra (300 MHz, CD3OD), ppm referred to TMS as external standard, 25 °C) of (a) free compound 110a (40 mM), (b) equimolar mixture of (R,S)-110a/TRIMEB, (c) equimolar mixture as in (b) starting from a sample of 110a enriched in the (C)-(S)-enantiomer and
(d) equimolar mixture as in (b) starting from a sample of enantiomerically pure ( )-(R)-110a. Reprinted with permission from Reference 63. Copyright (1994) American Chemical Society
TRIMEB/allene molar ratio. Data relative to the allene proton of 110a–f are summarized in Table 43.
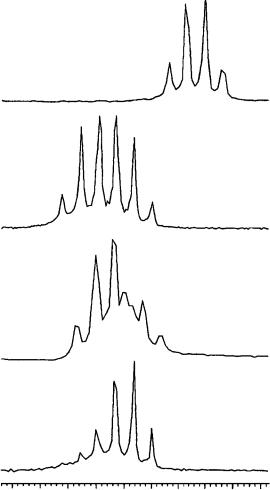
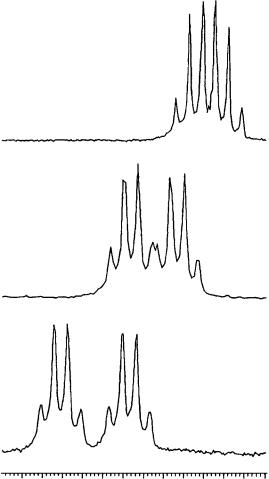
As shown in Figure 55 for the allene proton of 110a, the nonequivalence increases from 3.9 Hz (Figure 55a) in an equimolar solution to 7.0 Hz (Figure 55b) by adding an additional equivalent of TRIMEB and to 10.9 Hz (Figure 55c) in the presence of 3 equivalents of the cyclodextrin, giving rise to two completely separated signals.

176 |
Yoshito Takeuchi and Toshio Takayama |
TABLE 43. Unequivalence ( υa at 300 MHz, CD3OD) induced in the allene proton of trisubstituted allene (40 mM) in the presence of TRIMEB, as a function of the temperature and of the allene/TRIMEB molar ratio
Allene |
25 °C |
|
40 °C |
|
molar ratio 1 : 1 |
molar ratio 1 : 2 |
molar ratio 1 : 1 |
|
|
|
|
110a |
3.9 |
7.0 |
18.1 |
110b |
1.8 |
2.0 |
7.4 |
110c |
1.1 |
4.2 |
5.9 |
110d |
3.3 |
7.0 |
23.4 |
110e |
2.9 |
3.3 |
11.7 |
110f |
0.5 |
2.9 |
4.9 |
a υ D difference between the proton chemical shifts (Hz) of the two enantiomers in the presence of TRIMEB.
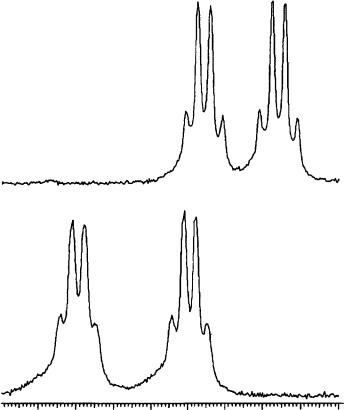
The use of CD3OD as a solvent also allowed one to affect the nonequivalence by temperature variations: the absorptions of the allene proton of 110a in the two enantiomers are separated by 11.9 Hz at 20 °C (Figure 56a) and by 18.1 Hz at 40 °C (Figure 56b). The possibility of increasing the nonequivalence by decreasing the temperature instead of increasing the CSA/allene molar ratio represents a double advantage: the measurement requires a minor amount of TRIMEB, thus becoming less expensive, and better results are obtained taking into account that the non-equivalence is very sensitive to temperature variations.
On the basis of the results above it can be concluded that, at least for the allenes investigated, the complete separation of the two allene absorptions can be achieved both by varying the molar ratio and by lowering the temperature, and hence the enantiomeric composition can be accurately determined by comparing the areas of the two absorptions by integration.
A series of stannylallene derivatives (111) was studied by means of 13C, 29Si and 119Sn NMR spectroscopy by Lukevics and coworkers65. The effects of substituents on chemical shift values and J (SSCC) in 111 are additive. A set of linear correlations between the isotope shifts (IS) and SSCC for 111 demonstrates the interrelation of these values.
Me3Sn |
Y |
|||
Ca |
|
Cb |
|
Cg |
|
|
|||
|
|
|||
X |
Z |
|||
(111) |
|
|||
X = H, SnMe3, SiMe3, GeMe3, SC2H5, Br
Y = H, SnMe3
Z = H, SnMe3, SiMe3, GeMe3, SC2H5
The 13C, 29Si and 119Sn NMR chemical shifts measured for stannylallenes and silylstannylallenes are presented in Tables 44 and 46; nJ119Sn13C), nJ119Sn117Sn , nJ29Si13C) and isotope shifts (IS) are given in Tables 45 and 46.
2. NMR spectroscopy of dienes and polyenes |
177 |
(a)
(b)
(c)
6.13 |
6.11 |
6.09 |
6.07 |
6.05 |
6.03 |
|
|
|
ppm |
|
|
FIGURE 55. 1H NMR spectra (300 MHz, CD3OD, ppm referred to TMS as external standard, 25 °C) of (a) equimolar mixture of (R,S)-110a/TRIMEB, (b) 1 : 2 mixture of (R,S)-110a/TRIMEB and (c) 1 : 3 mixture of (R,S)-110a/TRIMEB. Reprinted with permission from Reference 63. Copyright (1994) American Chemical Society
Analysis of the chemical shifts of 13C and 119Sn for stannylallenes 111 (Table 44) shows that these values are additive and can be described by equations 4 to 6:
υ 13C˛, D 81.2 C X˛ C X |
(4) |
υ 13Cˇ D 219.0 C Xˇ |
(5) |
υ 119Sn D 21.6 C X˛ C X |
(6) |
178 |
Yoshito Takeuchi and Toshio Takayama |
(a)
(b)
6.24 |
6.22 |
6.20 |
6.18 |
6.16 |
6.14 |
6.12 |
6.10 |
ppm
FIGURE 56. 1H NMR spectra (300 MHz, CD3OD, ppm referred to TMS as external standard) of an equimolar mixture of (R,S)-110a/TRIMEB recorded at (a) 20 °C and (b) 40 °C. Reprinted with permission from Reference 63. Copyright (1994) American Chemical Society
where X˛, Xˇ and X are increments of the corresponding substituents in the ˛-, ˇ- and - positions with regard to the nuclei under study. The calculated increments of substituents are presented in Table 47.
The difference between the calculated 13C and 119Sn CS and their experimental values for C˛, Cˇ and C does not exceed 0.6 ppm and for 119Sn CS 0.3 ppm. The relatively small values of these deviations demonstrate that the increments can be used for analytical purposes. The study of increments for 13C (Table 47) provides evidence for a considerably larger influence of the MMe3 group in the -position of the allene system than in the ˛- and ˇ-positions. The negative sign of the -increment results from exponential correlation between the electronegativity of the substituent and the -increment value. A significant increase in the shielding of the -carbon nucleus (owing to the introduction of a MMe3 group into the ˛-position of the allene system) is observed in the sequences CMe3 <