

|
|
2. NMR spectroscopy of dienes and polyenes |
179 |
||||||||||||
TABLE 44. 13C and 119Sn chemical shifts υ (ppm) of stannylallenes in C6D6 |
|
||||||||||||||
|
|
|
|
|
Me3Sn |
|
|
Y |
|
|
|
|
|||
|
|
|
|
|
|
Ca |
|
C |
|
|
C g |
|
|
|
|
|
|
|
|
|
|
|
|
|
|
|
|
|
|||
|
|
|
|
|
|
|
|
b |
|
|
|
|
|
|
|
|
|
|
|
|
|
X |
|
|
Z |
|
|
|
|
||
|
|
|
|
|
|
|
|
|
|
|
|
|
|
||
X |
Y |
Z |
υ |
|
|
|
|
|
|
|
|
υ13C |
|
||
|
|
|
119Sn |
|
|
|
|
|
|
|
|
||||
|
|
|
|
C˛ |
Cˇ |
|
C |
SnCH3 |
XCH3 |
CY,Z |
|||||
SnMe3 |
H |
H |
9.55 |
75.23 |
205.98 |
53.01 |
8.53 |
|
8.53 |
— |
|||||
|
H |
SiMe3 |
3.56 |
65.06 |
202.91 |
55.36 |
8.35 |
|
8.53 |
0.06 |
|||||
|
H |
GeMe3 |
4.94 |
65.96 |
201.76 |
56.70 |
8.38 |
|
8.38 |
0.82 |
|||||
|
H |
SnMe3 |
3.12 |
61.98 |
201.32 |
50.49 |
8.38 |
|
8.38 |
9.03 |
|||||
|
H |
SC2H5 |
5.07 |
79.59 |
204.08 |
65.14 |
8.06 |
|
8.06 |
29.86 CH2 |
|||||
|
|
|
|
|
|
|
|
|
|
|
|
8.29 |
|
8.29 |
15.09 CH3 |
|
SnMe3 |
SiMe3 |
3.40 |
50.78 |
196.08 |
52.69 |
|
8.23 SnMe3 |
|||||||
|
|
|
|
|
|
|
|
|
|
|
|
8.27 |
|
8.27 |
0.67 SiMe3 |
|
SnMe3 |
GeMe3 |
1.87 |
52.06 |
196.13 |
54.20 |
|
8.32 SnMe3 |
|||||||
|
|
|
|
|
|
|
|
|
|
|
|
8.32 |
|
8.32 |
0.01 GeMe3 |
|
SnMe3 |
SnMe3 |
3.73 |
47.36 |
195.58 |
47.36 |
|
8.32 |
|||||||
|
SnMe3 |
SC2H5 |
1.82 |
70.04 |
200.00 |
64.03 |
8.06 |
|
8.06 |
29.04 CH2 |
|||||
|
|
|
|
|
|
|
|
|
|
|
|
|
|
|
15.41 CH3 |
|
|
|
5.95 |
|
|
|
|
|
|
|
|
8.15 |
|
|
8.79 (SnMe3) |
SiMe3 |
H |
SiMe3 |
71.44 |
204.93 |
59.14 |
|
0.32 |
0.09 |
|||||||
|
H |
GeMe3 |
7.73 |
71.92 |
203.32 |
60.05 |
8.21 |
|
0.32 |
0.85 |
|||||
|
H |
SC2H5 |
6.08 |
77.92 |
206.13 |
68.63 |
7.88 |
|
0.53 |
29.74 CH2 |
|||||
|
|
|
|
|
|
|
|
|
|
|
|
8.06 |
|
|
15.21 CH3 |
|
SnMe3 |
SiMe3 |
0.34 |
56.79 |
197.48 |
56.79 |
|
0.76 |
0.23 SnMe3 |
||||||
|
|
|
1.48 |
|
|
|
|
|
|
|
|
8.14 |
|
|
0.18 SiMe3 |
|
SnMe3 |
GeMe3 |
57.64 |
196.97 |
57.73 |
|
0.74 |
8.17 (SnMe3) |
|||||||
|
|
|
|
|
|
|
|
|
|
|
|
8.23 |
|
|
0.04 GeMe3 |
|
SnMe3 |
SnMe3 |
0.02 |
52.69 |
196.08 |
50.78 |
|
0.67 |
8.29 |
||||||
|
SnMe3 |
SC2H5 |
3.68 |
76.40 |
200.59 |
67.52 |
7.88 |
|
0.38 |
8.76 SnMe3 |
|||||
|
|
|
|
|
|
|
|
|
|
|
|
|
|
|
28.81 CH2 |
|
|
|
7.42 |
|
|
|
|
|
|
|
|
8.26 |
|
0.29 |
15.35 CH3 |
GeMe3 |
H |
SiMe3 |
71.59 |
203.58 |
59.69 |
|
0.12 |
||||||||
|
H |
GeMe3 |
9.01 |
72.20 |
202.10 |
60.71 |
8.32 |
|
0.34 |
0.89 |
|||||
|
H |
SC2H5 |
8.49 |
78.71 |
204.36 |
69.30 |
8.00 |
|
0.35 |
29.30 CH2 |
|||||
|
|
|
0.95 |
|
|
|
|
|
|
|
|
8.17 |
|
|
15.21 CH3 |
|
SnMe3 |
SiMe3 |
57.73 |
197.48 |
57.64 |
|
0.04 |
8.14 SnMe3 |
|||||||
|
|
|
2.61 |
|
|
|
|
|
|
|
|
8.21 |
|
0.04 |
0.74 SiMe3 |
|
SnMe3 |
GeMe3 |
58.60 |
196.45 |
58.06 |
|
— |
||||||||
|
SnMe3 |
SnMe3 |
1.03 |
54.20 |
196.13 |
52.06 |
8.21 |
|
0.01 |
8.27 SnMe3 |
|||||
|
SnMe3 |
SC2H5 |
3.96 |
77.33 |
199.54 |
68.66 |
7.97 |
|
0.15 |
8.76 SnMe3 |
|||||
|
|
|
|
|
|
|
|
|
|
|
|
|
|
|
28.78 CH2 |
|
|
|
8.66 |
|
|
|
|
|
|
|
|
9.03 |
|
|
15.41 CH3 |
H |
SnMe3 |
SnMe3 |
50.49 |
201.32 |
61.98 |
|
— |
8.38 |
|||||||
SC2H5 |
SnMe3 |
SiMe3 |
1.88 |
67.52 |
200.59 |
76.40 |
8.76 |
28.81 CH2 |
7.88 SiMe3 |
||||||
|
|
|
3.48 |
|
|
|
|
|
|
|
|
8.76 |
|
15.36 CH2 |
0.38 SiMe3 |
|
SnMe3 |
GeMe3 |
68.66 |
199.54 |
77.33 |
28.78 CH2 |
7.97 SnMe3 |
||||||||
|
|
|
2.94 |
|
|
|
|
|
|
|
|
8.79 |
|
15.41 CH2 0.15 GeMe3 |
|
|
SnMe3 |
SnMe3 |
64.03 |
200.00 |
70.04 |
29.04 CH2 |
8.06 SnMe3 |
||||||||
|
|
|
|
|
|
|
|
|
|
|
|
8.56 |
|
15.41 CH2 |
|
Br |
H |
H |
2.98 |
78.51 |
206.98 |
74.96 |
|
|
|
||||||

180 |
|
|
Yoshito Takeuchi and Toshio Takayama |
|
|
|||||||
TABLE 45. Coupling constants and isotope shifts of stannylallenes in C6D6 |
|
|||||||||||
|
|
|
|
Me3Sn |
|
|
|
Y |
|
|
|
|
|
|
|
|
|
Ca |
|
C |
|
C g |
|
|
|
|
|
|
|
|
|
|
|
|
|
|||
|
|
|
|
|
|
|
b |
|
|
|
||
|
|
|
|
|
X |
|
|
|
Z |
|
|
|
|
|
|
|
|
|
|||||||
X |
Y |
Z |
|
Coupling constants (Hz) |
Isotope shifts (ppb) |
|||||||
|
|
|
|
|
|
|
|
|
|
|
||
|
|
|
SnC˛ |
SnCˇ |
SnC |
|
119Sn – 117Sn |
SnCCH3 |
1 119Sn C˛ |
1 119Sn |
||
|
|
|
|
|
|
|
|
|
|
|
|
CCH3 |
SnMe3 |
H |
H |
261.7 |
30.5 |
60.6 |
|
|
158.5 |
348.2 |
31.8 |
9.0 |
|
|
H |
SiMe3 |
264.4 |
26.3 |
50.1 |
|
|
169.1 |
349.4 |
34.3 |
7.1 |
|
|
H |
GeMe3 |
269.9 |
26.8 |
57.1 |
|
|
190.9 |
347.6 |
33.8 |
7.7 |
|
|
H |
SnMe3 |
274.1 |
26.0 |
58.9 |
|
199.4(2J) |
347.0 |
34.2 |
7.7 |
||
|
H |
SC2H5 |
239.8 |
31.2 |
65.1 |
|
|
166.5 |
348.1 |
37.5 |
6.6 |
|
|
SnMe3 |
SiMe3 |
281.7 |
21.4 |
48.6 |
|
202.6(2J) |
348.0 |
32.2 |
7.5 |
||
|
|
|
|
|
|
|
248.6(4J) |
|
|
|
||
|
SnMe3 |
GeMe3 |
285.1 |
22.7 |
54.5 |
|
226.2(2J) |
345.9 |
31.9 |
9.2 |
||
|
|
|
|
|
|
|
250.5(4J) |
|
|
|
||
|
SnMe3 |
SnMe3 |
292.9 |
22.1 |
54.8 |
|
234.0(2J) |
345.6 |
31.1 |
9.3 |
||
|
|
|
|
|
|
|
254.2(4J) |
|
|
|
||
|
SnMe3 |
SC2H5 |
263.2 |
30.5 |
66.4 |
|
246.3(2J) |
343.0 |
33.2 |
7.5 |
||
|
|
|
|
|
|
|
202.3(4J) |
|
|
|
||
SiMe3 |
H |
SiMe3 |
254.4 |
31.6 |
49.6 |
|
|
— |
348.3 |
35.5 |
8.0 |
|
|
H |
GeMe3 |
261.6 |
a |
56.4 |
|
|
— |
346.7 |
35.0 |
8.0 |
|
|
|
|
|
|||||||||
|
H |
SC2H5 |
233.5 |
36.6 |
64.5 |
|
|
— |
346.5 |
36.5 |
7.4 |
|
|
SnMe3 |
SiMe3 |
270.4 |
27.7 |
47.8 |
|
241.1(4J) |
346.0 |
33.3 |
8.3 |
||
|
SnMe3 |
GeMe3 |
276.8 |
28.8 |
53.9 |
|
244.6(4J) |
344.6 |
32.7 |
8.5 |
||
|
SnMe3 |
SnMe3 |
284.0 |
28.2 |
54.8 |
|
248.7(4J) |
347.2 |
32.2 |
8.6 |
||
|
SnMe3 |
SC2H5 |
257.7 |
28.4 |
65.7 |
|
199.3(4J) |
340.2 |
34.6 |
8.2 |
||
GeMe3 |
H |
SiMe3 |
280.3 |
23.6 |
48.5 |
|
|
— |
349.1 |
33.4 |
8.2 |
|
|
H |
GeMe3 |
286.9 |
23.0 |
54.6 |
|
|
— |
347.4 |
30.5 |
8.5 |
|
|
H |
SC2H5 |
258.9 |
26.7 |
62.6 |
|
|
— |
347.6 |
35.6 |
7.1 |
|
|
SnMe3 |
SiMe3 |
298.1 |
19.2 |
46.3 |
|
244.6(4J) |
347.0 |
31.7 |
9.2 |
||
|
SnMe3 |
GeMe3 |
304.6 |
20.1 |
52.1 |
|
247.3(4J) |
345.7 |
30.7 |
9.3 |
||
|
SnMe3 |
SnMe3 |
310.0 |
19.3 |
53.3 |
|
250.5(4J) |
344.9 |
30.0 |
9.7 |
||
|
SnMe3 |
SC2H5 |
283.7 |
26.2 |
61.6 |
|
198.6(4J) |
341.3 |
33.0 |
7.9 |
||
H |
SnMe3 |
SnMe3 |
423.5 |
6.1 |
44.8 |
|
248.3(4J) |
353.5 |
22.4 |
12.1 |
||
SC2H5 |
SnMe3 |
SiMe3 |
410.6 |
352 |
32.2 |
|
199.3(4J) |
353.2 |
38.4 |
6.3 |
||
|
SnMe3 |
GeMe3 |
417.0 |
26.2 |
35.1 |
|
198.6(4J) |
352.6 |
37.6 |
6.6 |
||
|
SnMe3 |
SnMe3 |
433.7 |
32.1 |
36.4 |
|
202.3(4J) |
350.9 |
36.6 |
7.2 |
||
Br |
H |
H |
360.8 |
32.5 |
27.4 |
|
|
— |
371.5 |
26.4 |
1.1 |
|
aNot measured.
GeMe3 < SiMe3 < SnMe3. This is corrected by the increasing -donating capacity of substituents in this sequence, suggesting that the negative values of the -increment result from the -donating capacity of the MMe3 group.
Generally, inverse relationships are observed between the 119Sn and 13C chemical shifts of the ˇ-carbon atom in 111 (Table 44). This indicates a conjugation between the tin atom and the allene system as a downfield shift of the 13Cˇ signal corresponds to an upfield shift

|
|
|
|
|
2. NMR spectroscopy of dienes and polyenes |
|
|
|
|
181 |
|||||||||
TABLE 46. |
29Si NMR spectra of stannylsilylallenes and related compounds in C6D6 |
|
|||||||||||||||||
|
|
|
|
|
|
Me3Sn |
|
|
|
|
|
Y |
|
|
|
|
|
|
|
|
|
|
|
|
|
X |
C |
|
C |
|
C |
Z |
|
|
|
|
|
|
|
|
|
|
|
|
|
|
|
|
|
|
|
|
|
|
|||||
|
|
|
|
|
|
|
|
|
|
|
|
|
|
|
|||||
|
|
|
|
|
|
|
|
|
|
|
|
|
|
|
|
|
|
||
|
|
|
|
|
|
|
|
|
|
|
|
|
|
|
|||||
X |
|
Y |
|
Z |
υ |
|
|
|
Coupling constants (Hz) |
|
|
1 29Si (C˛) |
|||||||
|
|
|
|
|
|
(29Si) (ppm) |
29Si – CCH3 |
29Si – C˛ 29Si – 119Sn |
|
(ppm) |
|||||||||
SnMe3 |
SiMe3 |
|
H |
5.06 |
52.86 |
|
66.19 |
|
27.74 |
|
|
|
|
9.1 |
|||||
GeMe3 |
SiMe3 |
|
H |
5.12 |
52.91 |
|
65.21 |
|
26.94 |
|
|
|
|
9.5 |
|||||
SiMe3 |
SiMe3 |
|
H |
4.94 |
53.20 |
|
64.61 |
|
26.68 |
|
4 |
|
|
9.6 |
|||||
SiMe3 |
SnMe3 |
|
SnMe3 |
3.59 |
52.75 |
|
58.69 |
|
27.56 |
2J |
9.8 |
||||||||
|
|
|
|
|
|
|
|
|
|
|
|
|
|
23.81 |
|
4 |
J |
|
|
SiMe3 |
SnMe3 |
|
GeMe3 |
3.66 |
52.87 |
|
57.96 |
|
27.16 |
|
|
|
10.0 |
||||||
|
|
|
2J |
||||||||||||||||
|
|
|
|
|
|
|
|
|
|
|
|
|
|
20.28 |
|
4 |
J |
|
|
SiMe3 |
SnMe3 |
|
SiMe3 |
3.98 |
53.31 |
|
57.56 |
|
18.03 |
|
|
|
10.5 |
||||||
|
|
|
2J |
||||||||||||||||
|
|
|
|
|
|
|
|
|
|
|
|
|
|
20.14 |
|
J |
|
||
SiMe3 |
H |
|
|
|
SiMe3 |
3.89 |
52.95 |
|
55.40 |
|
18.49 |
|
4 |
J |
10.4 |
||||
SiMe3 |
H |
|
|
|
GeMe3 |
4.01 |
53.06 |
|
55.58 |
|
26.26 |
|
10.4 |
||||||
SiMe3 |
H |
|
|
|
SC2H5 |
3.41 |
53.31 |
|
52.91 |
|
|
|
|
|
|
11.1 |
|||
SiMe3 |
SnMe3 |
|
SC2H5 |
3.34 |
52.98 |
|
55.61 |
2 |
J |
|
|
|
|
10.3 |
|||||
|
|
|
|
|
|
|
|
|
|
|
|
21.64 |
|
|
|
|
|
|
|
Me3Si |
|
|
|
|
H |
|
|
|
|
|
|
|
|
|
|
|
|
|
|
|
C |
|
C |
|
C |
0.31 |
|
|
|
|
|
|
|
|
|
|
|
|
|
|
|
|
|
|
|
|
|
|
|
|
|
|
|
|
|
||||
|
|
|
|
|
|
|
|
|
|
|
|
|
|
|
|
||||
Br |
|
|
|
|
H |
|
|
|
|
|
|
|
|
|
|
|
|
|
|
|
|
|
|
|
|
|
|
|
|
|
|
|
|
|
|
|
|
|
|
TABLE 47. Values of the calculated increments of substituents in stannylallenes 111 in C6D6
Measured |
|
|
|
|
Increment of group |
|
|
|||||||
value |
|
|
|
|
SnMe3 |
GeMe3 |
SiMe3 |
SC2H5 |
CMe3 |
|||||
|
13 |
|
|
|
|
2.5 |
C3.6 |
C2.6 |
C13.3 |
C28.6 |
||||
υ13C˛ |
|
|
||||||||||||
υ13Cˇ |
|
|
6.1 |
5.0 |
4.4 |
1.6 |
5.6 |
|||||||
|
|
C |
|
|
|
|
14.1 |
10.0 |
10.8 |
C8.3 |
3.5 |
|||
υ119 |
|
|
|
|||||||||||
υ |
Sn |
|
|
C12.4 (˛) |
C7.6 (˛) |
C8.7 (˛) |
C6.0 (˛) |
|
||||||
1 |
J |
119 |
Sn |
13 |
C˛ |
C6.6 ( ) |
C4.6 ( ) |
C6.3 ( ) |
C3.0 ( ) |
|
||||
|
|
|
C130.6 |
(˛) |
113.4 |
(˛) |
C139.4 |
(˛) |
|
|
||||
2 |
J |
119 |
Sn |
13 |
Cˇ |
C15.9 |
( ) |
C9.6 |
( ) |
C5.2 |
( ) |
|
|
|
|
|
|
C16.0 (˛) |
C13.0 (˛) |
C22.1 (˛) |
|
|
|||||||
3 |
J |
119 |
Sn |
13 |
C |
4.4 |
( ) |
3.6 |
( ) |
4.6 |
( ) |
|
|
|
|
|
|
C10.0 (˛) |
C8.0 (˛) |
C9.5 (˛) |
|
|
|||||||
|
|
|
|
|
|
|
2.1 |
( ) |
4.0 |
( ) |
10.7 |
( ) |
|
|
of the 119Sn resonance. In a series of structurally similar compounds, the relative changes in the shielding of nuclei under the influence of substituents are related to corresponding changes in the electron density of these nuclei. Therefore, one can assume that an increase in the negative charge on the tin atom results from a decrease in the charge of Cˇ in the Me3Sn C˛DCˇDC system. This conclusion is in agreement with the correlation found
earlier between the shielding of the central 13Cˇ atom in the allene system and substituent resonance effects. Judging from the ˇ-increments (Table 47), the -acceptor capacity of the MMe3 group increases in the sequence Sn < Ge < Si.
182 |
Yoshito Takeuchi and Toshio Takayama |
B. Solitons
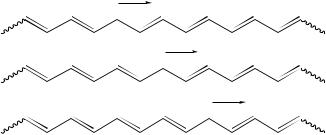
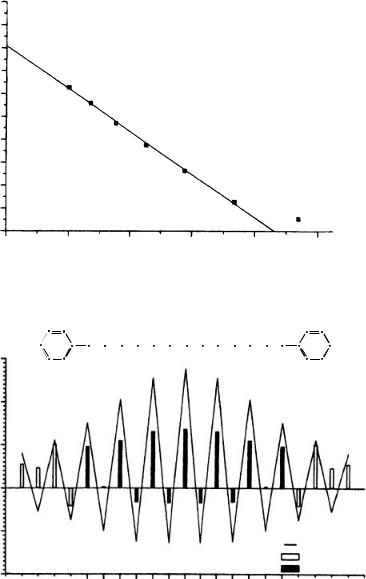
Tolbert and Ogle66 reported a 13C NMR study on soliton model compounds. Although many of the qualitative aspects of charge transport in conductive polymers have their counterparts in classical organic chemistry, the concept of a mobile charge carrier (‘soliton’) is one of the most difficult to reconcile with the conventional understanding of resonance. According to the soliton theory, the charge carrier in reductively (or oxidatively) doped polyacetylene is a resonance-stabilized carbanion (or carbocation) of finite width with maximum charge at the center of the defect and diminishing amplitude away from the center. Charge transport is thus associated with migration of the charge density wave down the polymer chain (Figure 57).
Such migration will be isoergic only if the solitonic charge density wave has finite width relative to the unsaturation length. Although increased charge density at the center of an odd-alternant hydrocarbon anion has been a familiar aspect of the chemistry of polyenyl anions since the pioneering work of Kloosterziel and Werner67, less widely understood is the requirement that what would ordinarily be static resonance forms become only dynamically equivalent at long chain length. Figure 57 thus represents the centers of delocalized finite domains as they migrate down the chain. The relevance of the interchain charge-transport mechanism to the overall mechanism of conductivity in bulk polymers, for which interchain charge migration (‘intersoliton hopping’) is apparently rate-limiting, is still the subject of controversy and is not addressed here.
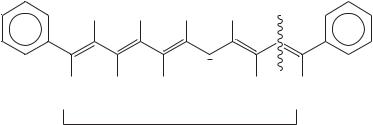
In order to relate this conclusion from solid-state theoretical physics to the organic chemistry of conductive polymers, Tolbert and Ogle undertook an examination of the effect of increasing chain length on the spectral properties of polyenyl anions, using 13C NMR spectroscopy. By using ˛, ω-diphenylpolyenyl anions (DP1, DP3, DP5, etc.), they investigated the chain length at which the properties of these anions and n-doped polyacetylene converge (Scheme 8).
Treatment of the appropriate hydrocarbon precursors DPN-H (D DP1-H, DP2-H, . . .) in Me2SO solution with potassium (methylsulfinyl)methide (‘dimsyl’) resulted in an immediate color formation that varied from orange to deep blue-black to colorless as the chain length increased. The higher homologues were poorly soluble and required filtration under inert atmosphere in order to obtain homogeneous solutions for NMR analysis. In the case of DP17 and higher homologues, anisotropic line broadening prevented acquisition of analyzable spectra. However, anions DP1 – DP13 yield quite satisfactory 13C and 1H spectra for further analysis. Curiously, although DP3 exhibited both E,E and E,Z conformers
−
−
−
L-form |
R-form |
FIGURE 57. Coupled soliton modes in n-doped polyacetylene. Reprinted with permission from Reference 66. Copyright (1990) American Chemical Society
|
2. NMR spectroscopy of dienes and polyenes |
183 |
|||||
|
m |
|
|
|
|
|
|
p |
o |
H |
H |
H |
H |
|
|
|
|
|
|
||||
|
i |
|
|
|
|
|
|
|
α |
|
|
|
|
|
|
|
H |
H |
|
H |
H |
H |
|
DPN, N = 1−17, carbon number
SCHEME 8
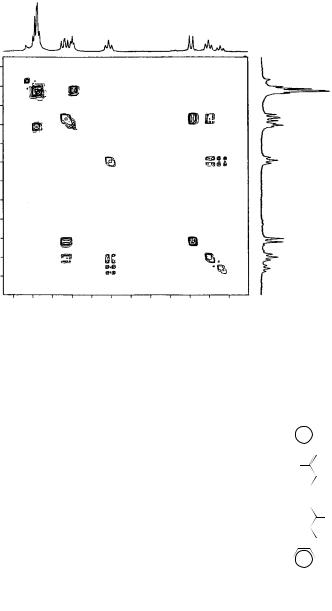
in accordance with literature studies in non-ion pairing solvents, the higher homologues showed little conformational diversity apart from absorbances of < ca 5% intensity that apparently corresponded to Z conformers. By analogy with DP3, for which proton and carbon chemical shifts had similar frequency separation and, therefore, similar exchange kinetics, such conformers in the higher homologues should have been visible in the carbon spectra. It was concluded that the carbon chemical shifts corresponded to the single isomer represented in the proton spectra. Moreover, the coupling constants, which ranged from 11.7 Hz for central protons to 14.8 Hz for the ˛ protons, are consistent only with the all-trans planar conformation in which increased bond localization at the ends of the chain leads to a higher coupling constant. The 13C chemical shifts of the anions were found to be devoid of counterion effects as indicated by employing CH3SOCH2 KC /18-crown-6 in Me2SO-d6 as the base. The chemical shift of C-1 of DP1 was obtained only after addition of Me2SO-d6 to the deprotonated substrate, since facile protium/deuterium exchange led otherwise to line broadening and an isotope effect on the chemical shift. Similarly, DP3 underwent slow exchange with Me2SO-d6 to yield a deuteriated anion which exhibited an isotope effect on the C1 chemical shift. Although the assignment of 13C chemical shifts for anions DP1 – DP7 was straightforward by the use of two-dimensional (HETCOR) spectroscopy (Figure 58a), the higher homologues required more rigorous examination. The HETCOR of DP9 with carbon and proton assignments is shown in Figure 58a.
In particular, DP9 presented ambiguities associated with the proton assignments from which the 13C assignments were derived. Thus, it was necessary to use the COSY method to assign the proton absorptions first. Homonuclear COSY NMR spectroscopy allowed unambiguous assignment of proton chemical shifts in all cases.
Figure 58(b) shows a COSY spectrum of DP9 as a representative example of 1H chemical shifts that were readily assigned from the doublet at υ5.38 (J D 14.4 Hz) corresponding to the C-1 proton. Heteronuclear (HETCOR) 13C – 1H spectroscopy allowed indirect assignment of the 13C chemical shifts. The assignment of all chemical shifts and calculated charge densities for anions DP1 – DP13 is presented in Table 4868.
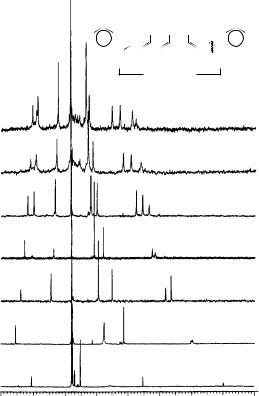
In all cases, the nuclei corresponding to the odd-numbered carbon atoms had upfield chemical shifts (excess charge densities) vs their even-numbered counterparts. More illustrative of this is the plot of the 13C spectra of the linear odd-alternant ˛,ω-diphenylpolyenyl anions [Ph(CH)nPh , n D 1, 3, 5, 7, 9, 11, 13] shown in Figure 59. Linear least-squares treatment of the average charge density av vs 13C chemical shift (see Figure 60), excluding DP1, gave excellent statistics and allowed a calculation of individual charge densities at each site from equation 7:
C D υC 132.7 /187.3 |
7 |
184 |
Yoshito Takeuchi and Toshio Takayama |
(a)
F1 (ppm)
(b)
F1 (ppm)
8.0
7.5
7.0
6.5
6.0
5.5
5.0
4.5
145 |
135 |
125 |
115 |
105 |
95 |
|
|
F2 (ppm) |
|
|
|
7.2
7.0
6.8
6.6
6.4
6.2
6.0
5.8
5.6
5.4
5.2
5.0
7.2 |
7.0 |
6.8 |
6.6 |
6.4 |
6.2 |
6.0 |
5.8 |
5.6 |
5.4 |
5.2 |
5.0 |
|
|
|
|
|
F2 (ppm) |
|
|
|
|
||
FIGURE 58. (a) HETCOR spectrum of DP9. (b) COSY spectrum of DP9. Reprinted with permission from Reference 66. Copyright (1990) American Chemical Society

TABLE 48. Chemical shift and charge densities for anions DP1 – DP13
DPN |
|
|
|
|
Chemical shift υ (in ppm) and charge densities (in parentheses) |
|
|
|
||||
N D |
|
|
|
|
|
|
|
|
|
|
|
|
|
C1 |
C2 |
C3 |
C4 |
C5 |
C6 |
C7 |
ipso |
ortho |
meta |
para |
|
|
|
|
|
|
|
|
|
|
|
|
|
|
1 |
80.4 |
|
|
|
|
|
|
145.2 |
116.2 |
127.7 |
105.9 |
|
|
( 0.279) |
|
|
|
|
|
|
(0.067) |
( 0.091) |
( 0.026) |
( 0.143) |
|
3 |
90.2 |
127.9 |
|
|
|
|
|
145.4 |
117.5 |
128.1 |
111.3 |
|
|
( 0.227) |
( 0.026) |
|
|
|
|
|
(0.068) |
( 0.081) |
( 0.025) |
( 0.114) |
|
5 |
96.5 |
134.6 |
98.2 |
|
|
|
|
143.9 |
119.4 |
128.0 |
115.0 |
|
|
( 0.193) |
(0.010) |
( 0.184) |
|
|
|
|
(0.058) |
( 0.071) |
( 0.025) |
( 0.095) |
|
7 |
102.4 |
133.7 |
101.5 |
140.5 |
|
|
|
142.7 |
120.8 |
128.1 |
117.7 |
|
|
( 0.163) |
(0.005) |
( 0.167) |
(0.042) |
|
|
|
(0.053) |
( 0.064) |
( 0.025) |
( 0.080) |
|
9 |
107.4 |
133.2 |
105.4 |
139.8 |
103.3 |
|
|
141.7 |
121.9 |
128.2 |
119.7 |
|
|
( 0.135) |
(0.003) |
( 0.146) |
(0.038) |
( 0.157) |
|
|
(0.048) |
( 0.058) |
( 0.024) |
( 0.036) |
|
11 |
111.5 |
132.7 |
109.1 |
139.2 |
105.9 |
139.6 |
|
140.9 |
122.8 |
128.3 |
121.3 |
|
|
( 0.113) |
(0.000) |
( 0.126) |
(0.035) |
( 0.143) |
(0.037) |
|
(0.044) |
( 0.053) |
( 0.023) |
( 0.061) |
|
13 |
114.9 |
132.3 |
112.5 |
138.6 |
108.6 |
139.0 |
107.5 |
140.3 |
123.4 |
128.3 |
122.5 |
|
|
( 0.095) |
( 0.002) |
( 0.108) |
(0.032) |
( 0.129) |
(0.034) |
( 0.135) |
(0.041) |
( 0.050) |
( 0.023) |
( 0.054) |
|
|
|
|
|
|
|
|
|
|
|
|
|
|
185
186 |
Yoshito Takeuchi and Toshio Takayama |
|
|||||||
|
|
|
m |
o |
|
|
|
|
|
|
|
|
p |
H |
H H |
H |
H |
|
|
|
|
|
|
i |
|
|
|
|
|
|
|
|
|
α |
|
|
− |
|
|
|
|
|
|
H |
H |
H |
H |
H |
|
|
|
|
|
|
|
DPN, N = 1, 13 |
|
|
|
|
|
|
|
|
|
|
|
|
DP13 |
|
|
|
|
|
|
|
|
|
DP11 |
|
|
|
|
|
|
|
|
|
DP9 |
|
|
|
|
|
|
|
|
|
DP7 |
|
|
|
|
|
|
|
|
|
DP5 |
|
|
|
|
|
|
|
|
|
DP3 |
|
|
|
|
|
|
|
|
|
DP1 |
150 |
140 |
130 |
120 |
110 |
100 |
90 |
80 |
70 |
|
|
|
|
|
13C d/ppm |
|
|
|
||
FIGURE 59. Stacked spectra of diphenylpolyenyl anions (DPN). Reprinted with permission from Reference 66. Copyright (1990) American Chemical Society
More illustrative are these results plotted in histogram form. Figure 61 indicates the results for DP13.
C. Fullerenes
The finding of fullerenes has stimulated chemists belonging to a variety of fields including those who use NMR. In this section, some examples of papers in which NMR plays an important role will be described.
Bellavia-Lund and coworkers69 reported a nitrogen-containing fullerene carbon resonance assignment through 15N – 13C coupling constants and location of the sp3 carbon atoms of (C59N)2. While C60 shows a single line at 143 ppm in its 13C NMR spectrum and is a magnetically deshielded moiety, a detailed assignment of all carbon resonances in a modified fullerene, which could have up to 60 resonances, is very difficult. However, for azafullerene (112), the carbon atoms in positions ˛ and ˇ to the nitrogen, as well as those linking the cage to other substituents, are potentially assignable using 13C – 15N coupling.
2. NMR spectroscopy of dienes and polyenes |
187 |
dc (av); ppm
129 a,w − Diphenylpolyenyl anions
128 |
|
|
|
|
|
127 |
|
|
|
|
|
126 |
|
|
|
|
|
125 |
DP13 |
|
|
|
|
|
DP11 |
|
|
|
|
|
|
|
|
|
|
124 |
|
DP9 |
|
|
|
|
|
|
|
|
|
123 |
|
|
DP7 |
|
|
|
|
|
|
|
|
122 |
|
|
|
DP5 |
|
|
|
|
|
|
|
121 |
|
|
|
|
|
120 |
|
|
|
DP3 |
|
|
|
|
|
|
|
119 |
|
|
|
|
DP1 |
|
|
|
|
|
|
0.03 |
0.04 |
0.05 |
0.06 |
0.07 |
0.08 |
|
|
|
−rav |
|
|
FIGURE 60. Average 13C chemical shift vs average charge density ( av for diphenylpolyenyl anions (DPN). Reprinted with permission from Reference 66. Copyright (1990) American Chemical Society
1 |
2 |
3 |
4 |
5 |
6 |
7 |
8 |
9 |
10 |
11 |
12 |
13 |
||||||||
|
|
|
|
|
|
|
|
|
|
|
|
|
|
|
|
|
|
|
|
|
−.30
−.20
−.10
Charge
0.00
0.10
BCBS model Phenyl carbons
Polyene carbons
0.20
1 2 3 4 5 6 7 8 9 10 11 12 13
Carbon number
FIGURE 61. Histogram of charge density vs carbon number for DP13. Reprinted with permission from Reference 66. Copyright (1990) American Chemical Society
188 |
Yoshito Takeuchi and Toshio Takayama |
If such an experiment were successful, then assignment of carbons ˛ to cage sp3 carbons in any modified fullerene should be possible by extrapolation. The authors report that such a characterization is indeed possible for molecules C59HN (113), (C59N)2 (114) and the recently synthesized C59(CHPh2)N (115). The nitrogen-coupled carbon NMR spectrum of the labeled ketolactam 112 revealed five carbons coupled to nitrogen at 80.8, 128.0, 139.7, 141.8 and 163.8 ppm, as shown for structure 112 (Figure 62). The labeled ketolactam was then converted to both 113 and 114. The former heterofullerene showed five carbons coupled to nitrogen at 71.7, 124.3, 134.9, 147.1 and 155.3 ppm. Assignment of the sp3-hybridized ˛ carbon at 155.3 ppm [1J(CN) D 12.1 Hz] was straightforward. Lowintensity resonances at 124.3, 134.9 and 147.1 must therefore be a result of ˇ-coupling, where the carbon resonance at 134.9 ppm is mostly modified by the 15N coupling. The carbon resonating at 147.1 ppm was shown to also be ˇ-coupled to the proton as depicted in 113 (Figure 62). This leaves the resonances at 124.3 and 134.9 ppm to be assignable to ‘b’ or ‘c’. If resonance arguments apply to spin – spin coupling, then the unusual bond localization sui generis to fullerene bonding (hexagons are cyclohexatrienes and pentagones are 5-radialenes) demands that ‘c’ be assigned to the 134.9 ppm resonance. This would also explain why ‘b’ and ‘d’, two carbons which are not in direct conjugation with the nitrogen, show very minor coupling.
Armed with this information, the authors examined the 15N-coupled 13C NMR spectrum of the dimer in order to finally locate the interdimer carbon ‘a’. Only one carbon resonance was found that split at 156 ppm [1J(CN) D 11.6 Hz], another that broadened was found at 138 ppm, and two more carbons were found that broadened to a lesser extent at 125.1 and 148.8 ppm.
In structure 114 (Figure 67), the assignment of one out of the two possible ˛ sites to ‘e’ as well as the uncertainty in assignment of the crucial ˛ carbon ‘a’ are shown.
As is well known in fullerene chemistry, it is possible that when a fullerene is a substituent it has a strong deshielding effect. If C59N has the same magnetic properties as C60, in (C59N)2 (114), each half of the molecule acts as a deshielding group on the other. Moreover, the interball bonding carbons ‘a’ are pressed against the opposite ball’s nitrogen atom’s lone pair, and this causes further deshielding. An additional complication is that the ‘a’ carbons are ˛ to their own ball’s nitrogen but ˇ to the adjacent ball’s nitrogen. This could cause further splitting and/or broadening of the signal corresponding to the ˛ carbon ‘a’. Quantum mechanical calculations at the LDF (local density functional) level reveal that the hybridization of ‘a’ is between sp2 and sp3; the C – H coupling constant in 113 also supports this theory and allows for the possible assignment of ‘a’ at 138 ppm. However, the magnitude of deshielding suffered by carbon ‘a’ was still in question.
To gain information on the chemical shift variation as a function of substituent, the labeled and unlabeled diphenylmethyl azafullerene derivative 115 was synthesized from the corresponding azafullerene dimer 114. The 13C NMR spectrum of 115 revealed the sp3 carbon ˛ to the nitrogen on the fullerene cage at 86.3 ppm. It seemed unreasonable that the broadened peak at 138 ppm in the spectrum of 114 could be the ˛ carbon resonance that they had been searching for. This reasoning stems from the fact that changing the substituent from diphenylmethyl to C59N should not shift the ‘sp3’ resonance downfield by 51.4 ppm, considering that in going from a proton in C59HN (113) to an alkyl substituent in C59(CHPh2)N (113), the ˛ carbon resonance shifted by only 14.9 ppm.
An 15N-coupled 13C NMR spectrum of 115 showed a pattern similar to that of its precursors: splitting at 86.3 and 155.5 correspond to the sp3-hybridized ˛ carbon ‘a’ and the sp2 ˛ carbon ‘e’, respectively, as illustrated in 115. Broadening was observed for ˇ carbon resonances at 137.6 and to a lesser extent at 65.2, 124.7 and 148.9 ppm. The 1H-coupled 13C NMR spectrum of 115 showed that the resonance at 148.9 ppm was also