

|
|
|
7 |
9 |
11 |
13 |
15 |
2 |
1 |
|
|
|
|
|
|
|
|
6 |
8 |
|
10 |
12 |
14 |
3 |
|
|
|
||||
|
|
|
|
|
|
|
|
|
|
|
|
|
|
|
5
4
b-Carotene (78)
|
2 |
4 |
6 |
8 |
10 |
12 |
1 |
3 |
5 |
|
7 |
9 |
11 |
Squalane (81)
|
2 |
4 |
6 |
8 |
10 |
12 |
1 |
3 |
5 |
|
7 |
9 |
11 |
Squalene (82)
129
130 |
Yoshito Takeuchi and Toshio Takayama |
b-pyrrole |
20 |
N |
N |
Ar2 |
Ar3 |
Zn |
|
5 |
Ar4 |
|
|
||
15 |
|
|
|
N |
N |
Ar6 |
Ar5 |
|
|
||
10 |
|
|
|
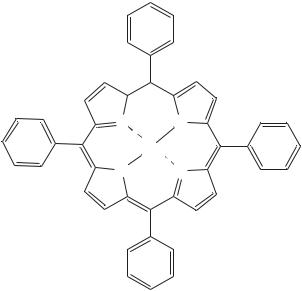
Zinc meso-tetraphenylporphyrin (79)
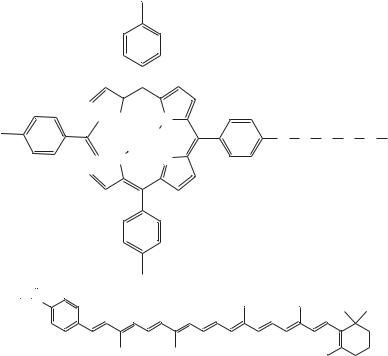
and ball-like porphyrin linked by a flexible chain of single bonds. Internal reorientation about this linkage is approximately 100 times faster than triplet-triplet energy transfer from the porphyrin to the carotenoid, which is mediated by such motions. The chemical shift assignments for the carbon nuclei of interest are given in Tables 29 – 32.
The assignments have been achieved using COSY, NOESY, ROESY, HMQC and
HMBC experiments. |
1 C for relevant |
Spin – lattice relaxation time-T1 and nuclear Overhauser effect |
|
carbon nuclei of 78–82 were determined in deoxygenated CDCl3 |
at 297 š 2 K. Three |
magnetic field strengths (7.0, 9.4, and 11.7 T) were employed. For T1 measurements the inversion recovery technique was used, e.g. for 78 (Figure 31), whereas NOE values were determined by a gated decoupling method. Results for squalane (81) and squalene (82) appear in Table 29, whereas those for 78–80 are given in Tables 30 – 32, respectively. The reported T1 values are averages of at least three separate determinations and are reproducible to within 5%. The NOE values are less reliable (15%), due in part to a less than optimal signal-to-noise ratio.
The T1 and NOE results for the monoprotonated carbon atoms of the ˇ-carotene backbone of 78 at three magnetic field strengths are given in Table 30. An obvious difference from the results for 81 and 82 is that the T1 values do not increase dramatically as one moves along the carbon chain away from the center of mass. In fact, the T1 values for carbons 10, 11, 12, 14 and 15 are identical, within experimental error, while those for carbons 7 and 8 at the end of the chain are only slightly longer. This result indicates that the overall tumbling of the ˇ-carotene molecule about its center of mass is substantially faster than internal rotations about the carbon – carbon bonds in the backbone, so that internal motions no longer affect relaxation significantly. The molecule behaves essentially as a rigid rotor.
Given the fact that ˇ-carotene behaves essentially as a rigid rotor, the linear geometry of the molecule as shown by X-ray studies suggests that it should not tumble
2. NMR spectroscopy of dienes and polyenes |
131 |
b-pyrrole 20 

 N N
N N
H
15 |
H |

 N N
N N
Ar2 |
Ar3 |
|
|
|
|
|
|
5 |
|
21 |
22 |
23 |
|
|
|
O |
C |
C |
C |
O |
R |
||
|
|||||||
|
|
H2 H2 H2 |
|
|
|||
Ar6 |
Ar5 |
|
|
|
|
|
|
10
|
|
O |
|||
R = |
|
|
|
|
4′ |
|
|
|
|||
|
C |
||||
|
|||||
2′ 
1′ |
5′ |
|
|
|
|
|
|
|
|
8′ |
10′ |
12′ |
14′ |
|
15 |
|
11 |
7 |
7′ |
|
11′ |
|
15′ |
14 |
12 |
10 |
8 |
Carotenoporphyrin (80)
isotropically. Indeed, to a first approximation, it might be expected to rotate more like an ellipsoid of rotation, with a major axis lying more or less along the conjugated carbon backbone. The field dependence of the T1 and NOE data shown in Table 30 is consistent with this interpretation. In the first place, it will be noted that the NOE values are not maximal (2.99) and that they decrease with increasing magnetic field. At first glance, this might be taken to mean that a second relaxation mechanism, which becomes more important at higher fields, is contributing. The most likely candidate is chemical shift anisotropy. The chemical shift anisotropy relaxation rate is proportional to the square of the spectrometer magnetic field strength, and the mechanism should therefore be more effective at the higher fields. However, it can be seen in Table 30 that the spin – lattice relaxation times increase with magnetic field. Relaxation is becoming less effective rather than more effective. Any additional relaxation mechanism coming into play at higher field strengths could only decrease relaxation times. Thus chemical shift anisotropy, and indeed any other mechanism competing with dipole – dipole relaxation, may be ruled out.
An alternative explanation, consistent with the data, is that dipole – dipole relaxation dominates for ˇ-carotene, but that molecular reorientation is anisotropic and occurs in a time range where the NOE is less than the maximum of 2.99 that is found in the ‘extreme narrowing’ region. For a rigid isotropic rotor, the correlation times are such that ω2 c2 − 1 and T1 will be independent of magnetic field strength and the NOE will be full (2.99). For the field strengths used in this study, this extreme narrowing region includes diffusion coefficient values greater than about 5 ð 109 s 1. For smaller values

132 |
Yoshito Takeuchi and Toshio Takayama |
TABLE 29. 13C NMR chemical shift values (υ), observed and calculateda spin – lattice relaxation times (T1) and observed nuclear Overhauser effects (NOE) for squalane (81) and squalene (82) in CDCl3 solution at 11.7 T
Carbon |
|
|
81 |
|
|
|
82 |
|
|
υ (ppm)b |
obsd T1 |
calcd T1 |
obsd NOE |
υ (ppm) |
obsd T1 |
calcd T1 |
obsd NOE |
|
|
(s) |
(s) |
1 C |
|
(s) |
(s) |
1 C |
2 |
28.05 |
4.85 |
3.70 |
2.83 |
|
|
|
|
3 |
39.47 |
2.50 |
1.76 |
2.09 |
124.46 |
4.31 |
3.99 |
2.85 |
4 |
24.88 |
1.75 |
1.66 |
2.54 |
26.81 |
1.85 |
1.83 |
3.13 |
|
24.89 |
|
|
|
|
|
|
|
5 |
37.39 |
1.33 |
1.57 |
2.69 |
39.75 |
1.62 |
1.73 |
3.05 |
6 |
32.86 |
1.86 |
2.96 |
2.76 |
|
|
|
|
7 |
37.48 |
1.24 |
1.39 |
2.81 |
124.32 |
2.26 |
3.05 |
2.85 |
|
37.52 |
|
|
|
|
|
|
|
8 |
24.56 |
1.02 |
1.30 |
2.85 |
26.69 |
1.14 |
1.36 |
3.13 |
9 |
37.50 |
1.03 |
1.21 |
2.69 |
39.77 |
1.17 |
1.27 |
3.05 |
|
37.55 |
|
|
|
|
|
|
|
10 |
32.86 |
1.83 |
2.23 |
2.76 |
|
|
|
|
11 |
37.20 |
0.88 |
1.03 |
2.75 |
124.35 |
1.77 |
2.15 |
2.85 |
|
37.21 |
|
|
|
|
|
|
|
|
37.29 |
|
|
|
|
|
|
|
|
37.30 |
|
|
|
|
|
|
|
12 |
27.52 |
0.91 |
0.91 |
2.78 |
28.30 |
0.90 |
0.90 |
3.17 |
|
27.53 |
|
|
|
|
|
|
|
|
27.54 |
|
|
|
|
|
|
|
aThe rotational diffusion coefficients used to calculate the various T1 values are discussed in the text.
bAs discussed in the text, this sample is a mixture of stereoisomers and, as a result, resonances for some carbons appear as clusters of closely spaced peaks with chemical shift values as listed in this column. The reported experimental T1 and NOE values are averages for these clusters.
TABLE 30. 13C NMR chemical shift values (υ), spin – lattice relaxation times T1 and nuclear Overhauser effects (NOE) for ˇ-carotene (78) in CDCl3 at various magnetic field strengths
Carbon |
υ (ppm) |
|
7.0 T |
|
9.4 T |
|
11.7 T |
|
|
|
NOE |
|
NOE |
|
NOE |
|
|
T1 (s) |
1 C |
T1 (s) |
1 C |
T1 (s) |
1 C |
7 |
126.67 |
0.58 |
2.55 |
0.67 |
2.46 |
0.71 |
2.25 |
8 |
137.28 |
0.59 |
2.48 |
0.66 |
2.49 |
0.70 |
2.34 |
10 |
130.85 |
0.54 |
2.49 |
0.61 |
2.38 |
0.67 |
2.29 |
11 |
125.05 |
0.51 |
2.46 |
0.57 |
2.43 |
0.61 |
2.18 |
12 |
137.25 |
0.52 |
2.54 |
0.60 |
2.53 |
0.65 |
2.30 |
14 |
132.43 |
0.54 |
2.53 |
0.59 |
2.42 |
0.63 |
2.37 |
15 |
130.00 |
0.51 |
2.69 |
0.57 |
2.44 |
0.59 |
2.38 |
|
|
|
|
|
|
|
|
of the diffusion coefficient, T1 will increase with increasing magnetic field strength, and NOE will decrease until it reaches a limiting minimum value.
Rochet and Lancelin50 reported revised 1H and 13C NMR assignments of the polyene antibiotic Filipin III (83). This macrolide which was isolated from Streptomyces filipinensis was reinvestigated in DMSO-d6 solution using homonuclear and heteronuclear correlation spectroscopy. In addition to several corrections to previous 1H NMR

2. NMR spectroscopy of dienes and polyenes |
133 |
TABLE 31. 13C NMR chemical shift values (υ), observed and calculated spin – lattice relaxation times T1 and observed nuclear Overhauser effects (NOE) for zinc meso-tetraphenylporphyrin (79) in CDCl3 solution at 9.4 T
Carbon |
υ (ppm) |
Obsd T1 (s) |
Calcd T1 (s) |
NOE 1 C |
ˇ-pyrrole |
131.99 |
0.40 |
0.40 |
2.85 |
Ar 2, 6 |
134.45 |
0.64 |
0.64 |
2.72 |
Ar 3, 5 |
126.55 |
0.63 |
0.64 |
3.10 |
Ar 4 |
127.49 |
0.41 |
0.40 |
2.61 |
|
|
|
|
|
TABLE 32. 13C NMR chemical shift values (υ) and observed and calculateda |
|||
spin – lattice relaxation times T1 for carotenoporphyrin (80) in CDCl3 solution |
|||
at 11.7 T |
|
|
|
Carbon |
υ (ppm) |
Obsd T1 (s) |
Calcd T1 (s) |
|
|
|
|
ˇ-pyrrole |
130.6 – 130.8b |
0.30 |
0.30 |
5-Ar 2, 6 |
135.59 |
0.31 |
0.32 |
5-Ar 3, 5 |
112.70 |
0.32 |
0.32 |
10, 15, 20-Ar 2, 6 |
134.51 |
0.37 |
0.38 |
10, 15, 20-Ar 3, 5 |
127.39 |
0.38 |
0.38 |
21 |
64.78 |
0.26 |
0.26 |
22 |
29.02 |
0.44 |
0.44 |
23 |
61.89 |
0.24 |
0.24 |
10 , 50 |
126.09 |
0.37 |
0.41 |
20 , 40 |
130.06 |
0.34 |
0.41 |
120 |
139.26 |
0.44 |
0.41 |
8 |
137.74 |
0.52 |
0.41 |
12 |
137.14 |
0.45 |
0.41 |
80 |
136.20 |
0.40 |
0.41 |
100 |
134.78 |
0.42 |
0.41 |
140 |
133.74 |
0.40 |
0.41 |
14 |
132.31 |
0.38 |
0.41 |
10 |
130.82 |
0.40 |
0.41 |
15 |
130.78 |
0.32 |
0.41 |
150 |
129.79 |
0.36 |
0.41 |
7 |
126.83 |
0.54 |
0.41 |
70 |
126.09 |
0.37 |
0.41 |
11 |
125.36 |
0.40 |
0.41 |
110 |
124.58 |
0.39 |
0.41 |
aThe rotational diffusion coefficients used to calculate the variations in T1 values are discussed in the text.
bAs discussed in the text, the ˇ-pyrrole resonances for this molecule appeared as a broad singlet. The reported T1 value is therefore an average for all ˇ-pyrrole resonances.
assignments (Figure 32), the nine exchangeable hydroxylic protons were structurespecifically assigned together with 13C NMR lines using proton-detected HSQC spectroscopy (Table 33). The magnitudes of the 3J(HH) indicated a probable constrained geometry of the macrocyclic lactone.
4. Metal bound polyenes
Yasuda and coworkers51 reported a route to niobocene-allyl compounds by hydrometalation of conjugated dienes with niobium hydrido-olefin complexes, NbH(C5H5)2(olefin),
134 |
|
|
|
Yoshito Takeuchi and Toshio Takayama |
|
|||
|
|
5.00 |
|
|
|
|
|
|
|
|
3.50 |
|
|
|
|
|
|
|
|
2.50 |
|
|
|
|
|
|
|
|
1.70 |
|
|
|
|
|
|
|
|
1.30 |
|
|
|
|
|
|
|
(s) |
0.90 |
|
|
|
|
|
|
t |
0.60 |
|
|
|
|
|
|
|
|
0.40 |
|
|
|
|
|
|
|
|
|
|
|
|
|
|
|
|
|
|
0.20 |
|
|
|
|
|
|
0.10 |
|
|
|
|
|
|
||
0.06 |
|
|
|
|
|
|
||
0.03 |
|
|
|
|
|
|
||
0.01 |
|
|
|
|
|
|
|
|
0.005 |
|
|
|
|
|
|
|
|
|
138 |
136 |
134 |
132 |
130 |
128 |
126 |
|
|
|
|
|
|
d (ppm) |
|
|
|
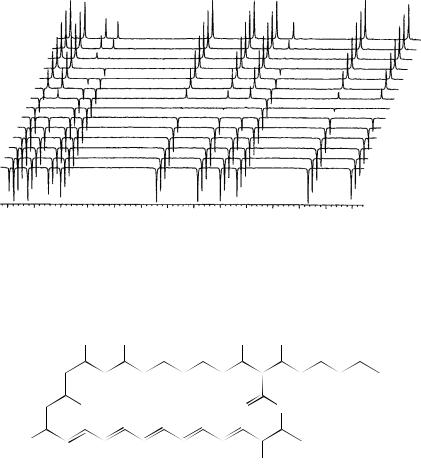
FIGURE 31. Typical data set for measurement of the spin – lattice relaxation times of the sp2- hybridized carbon atoms of ˇ-carotene at 11.7 T. The chemical shift values are shown across the bottom of the figure. The t-value for each spectrum is the delay time in the inversion-recovery pulse sequence. Reprinted with permission from Reference 49. Copyright (1995) American Chemical Society
|
OH |
OH |
OH |
OH |
OH |
OH |
|
|
|
11 |
9 |
7 |
5 |
3 |
1′ |
4′ |
6′ |
|
|
|
|
|
|
2′ |
||
13 |
OH |
|
|
|
O |
O |
|
|
15 |
17 |
19 |
21 |
23 |
25 |
26 |
|
|
|
|
|
|
|
|
|
||
|
|
|
|
|
|
|
|
|
HO |
18 |
20 |
22 |
|
24 |
27 |
28 |
|
16 |
|
|
|
|
OH
(83)
which readily react with conjugated dienes such as butadiene, isoprene and pentadiene, to give Nb(C5H5)2( 3-allyl) derivatives of syn or syn,syn geometry, in 80% – 90% yields with high regioselectivity. All the complexes were isolated as crystals and their structures were determined by NMR spectroscopy (equations 1 and 2).
The coordinated ethylene is readily expelled at 25 °C by the attack of a conjugated diene and the hydride is transferred to the sterically less crowded diene terminus. Thus the niobium hydrido-olefin complexes serve as convenient reagents for the preparation of 1,2- or 1,3-dialkyl-substituted allylniobium compounds starting from butadiene, (E,E)- and (E,Z)-2,4-hexadiene, (E)- and (Z)-1,3-pentadiene (equation 1), 3-methyl-1,3-pentadiene and isoprene (equation 2). All the allyl niobium compounds synthesized were isolated as air-sensitive pale-yellow crystals by crystallization from hexane.
All of the allylniobium compounds are monomeric, as revealed by the mass spectroscopic analysis, and always exist in the thermodynamically more favored syn- or
|
|
|
|
2. NMR spectroscopy of dienes and polyenes |
|
135 |
||||||
|
filipin III DMSO 303K |
|
|
|
|
|
|
|
|
|||
|
|
|
|
|
|
|
|
|
|
|
29 |
|
|
|
|
|
OH11 |
|
|
|
|
|
|
|
|
|
OH26 |
OH3 |
OH5 OH7OH1 OH15 |
H27 |
|
OH13 |
|
|
|
|
28 |
|
|
|
OH3 |
|
|
|
|
|
|
|
|
|
|
|
|
|
|
|
|
|
|
|
|
|
|
8′ |
|
5.2 |
|
5.0 |
4.8 |
4.6 |
|
4.4 |
H2O |
DMSO |
|
|
|
|
20 |
|
|
|
|
|
|
|
|
|
|
|
|
21 |
|
|
|
|
|
26 |
|
2 |
|
|
|
|
22 |
|
|
|
|
|
|
|
12a |
|
||
18 |
23 |
17 |
|
|
|
|
5 7 9 |
|
|
|
|
|
|
|
|
15 |
|
|
|
10a |
|
||||
24 |
25 |
|
|
|
1′ 11 |
|
|
|
|
|||
|
|
|
|
3 |
13 |
|
14a |
14b |
|
|||
6.5 |
|
6.0 |
5.5 |
5.0 |
4.5 |
4.0 |
3.5 |
3.0 |
2.5 |
2.0 |
1.5 |
1.0 |
|
|
|
|
|
|
|
ppm |
|
|
|
|
|
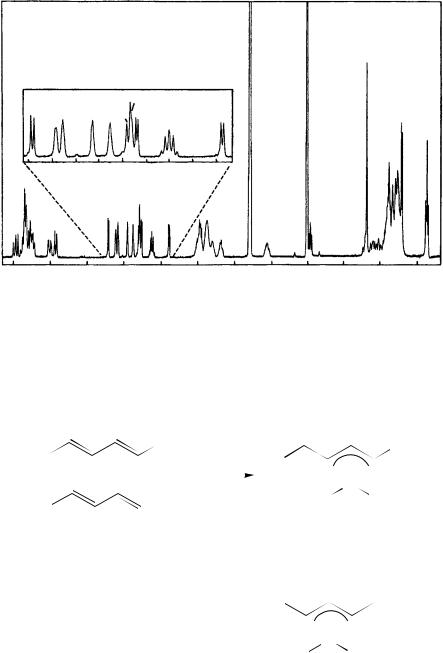
FIGURE 32. 1H NMR spectrum of filipin III, 3 mM in DMSO-d6, recorded at 400 MHz and 25 °C. The expanded region contains nine hydroxylic proton resonances that fully exchange with deuterium oxide and correspond to the nine hydroxyl groups of filipin III. No apodization functions were applied prior to the Fourier transformation. Reproduced by permission of John Wiley & Sons from Reference 50
syn,syn-allyl structure as deduced from one or more 1H NMR parameters, such as J(H1R2) and/or J(R2H3) of 13.5 – 14.2 Hz (Table 34).
R1 |
|
R2 |
1 |
|
|
|
R2 |
|
||
|
|
|
R |
|
|
|
|
|
||
|
|
|
|
|
|
|
|
|||
or |
|
|
Cp2NbH(C2H4) |
|
|
|
|
|
|
|
|
|
|
|
|
|
Nb |
|
|
||
|
|
|
|
|
|
|
|
|
||
R1 |
|
|
|
|
|
Cp |
Cp |
|
||
|
|
|
|
|
|
|
|
|
|
|
R |
2 |
|
|
|
(84) |
R1 = R2 = H |
|
|||
|
|
|
|
(85) |
R1 = R2 = CH3 |
|
||||
|
|
|
|
|
(1) |
|||||
|
|
|
|
|
(86a) |
R1 = H, R2 = CH3 |
||||
|
|
|
|
|
|
|
or |
|
|
|
|
|
|
|
R1 |
|
|
|
R2 |
|
|
|
|
|
|
|
|
|
|
|
|
|
|
|
|
|
|
|
|
|
|
|
|
|
|
|
|
|
|
Nb |
|
|
||
|
|
|
|
|
Cp |
|
Cp |
|
|
|
|
|
|
|
|
(86b) |
R1 = H, R2 = CH3 |
|
|||

136 |
Yoshito Takeuchi and Toshio Takayama |
|
|
|
|
TABLE 33. |
1H and 13C chemical shifts (ppm) |
of fil- |
|
|
ipin III in DMSO-d6 solution at 303 K.a |
|
|
|
|
Position |
υ1H |
υ13C |
|
|
2 |
2.44 |
58.1 |
|
|
3 |
3.98, 5.08 (OH) |
69.9 |
|
|
4 |
1.36, 1.36 |
40.0 |
|
|
5 |
3.87, 4.93 (OH) |
69.4 |
|
|
6 |
1.30, 1.30 |
43.4 |
|
|
7 |
3.85, 5.85 (OH) |
69.4 |
|
|
8 |
1.30, 1.38 |
43.4 |
|
|
9 |
3.84, 5.06 (OH) |
69.9 |
|
|
10 |
1.26, 1.36 |
42.3 |
|
|
11 |
3.77, 4.76 (OH) |
68.3 |
|
|
12 |
1.28, 1.58 |
44.3 |
|
|
13 |
3.04, 4.37 (OH) |
64.7 |
|
|
14 |
1.49, 1.68 |
42.4 |
|
|
15 |
3.94, 4.74 (OH) |
71.0 |
|
|
17 |
5.91 |
125.4 |
|
|
18 |
6.44 |
127.7 |
|
|
19 |
6.22 |
131.0 |
|
|
20 |
6.30 |
128.8Ł |
|
|
21 |
6.30 |
131.0Ł |
|
|
22 |
6.30 |
132.0Ł |
|
|
23 |
6.30 |
132.7Ł |
|
|
24 |
6.30 |
132.8Ł |
|
|
25 |
5.98 |
134.8 |
|
|
26 |
3.94, 5.19 (OH) |
73.0 |
|
|
27 |
4.60 |
72.6 |
|
|
28 |
1.18 |
17.0 |
|
|
29 |
1.67 |
10.0 |
|
|
10 |
3.66, 4.77 (OH) |
69.5 |
|
|
20 |
1.25, 1.34 |
33.6 |
|
|
30 |
1.18, 1.22 |
30.6 |
|
|
40 |
1.24, 1.42 |
24.0 |
|
|
50 |
1.23 |
21.3 |
|
|
60 |
0.83 |
12.9 |
|
aAsterisked resonances can be interchanged. Quaternary C-1 and C-16 are not assigned.
|
|
|
|
|
R |
|
|
|
Cp2NbH(C2H4) |
|
|
|
or |
|
|
|
|
|
|
||||
R |
|
|
|
|
|||
|
|
Nb |
|
|
Nb |
||
|
|
Cp |
|
Cp |
Cp |
|
Cp |
|
|
(87a) |
R |
= H |
|
(87b) |
|
|
|
(88a) |
R |
= CH3 |
|
(88b) |
|
R
(2)
Lehn and coworkers52 reported the synthesis, crystal structure and dinuclear copper(I) complexes of tris-carotenoid macrobicyclic ligands. The macrobicycles 89 and 90 were obtained in good yields in a one-step macrobicyclisation condensation between the tripode N(CH2CH2NH2)3 and the polyolefinic dialdehydes 93 and 94.

TABLE 34. |
1H NMR parameters for niobocene-allyl compoundsa |
|
|
|
|
|
|
|
|||||
Cp2Nb(R1CH1CR2CH3R3 |
Chemical shifts (υ, ppm) |
|
|
|
Coupling constants (Hz)c |
|
|
|
|||||
R1 |
R2 |
R3 |
(H1) |
(R1) |
(R2) |
(H3) |
(R3) |
(Cp) |
JH1, R1 |
JH1, R2 |
JR1, R2 JR2, H3 |
JH3, R3 |
|
H |
H |
CH3 (84) |
0.51 |
2.65 |
2.29 |
1.46 |
2.01 |
4.54 |
4.4 |
13.6 |
9.5 |
11.5 |
5.6 |
|
|
|
|
|
|
|
|
4.14 |
|
|
|
|
|
CH3 |
H |
C2H5 (85) |
1.17 |
1.95 |
2.33 |
1.61 |
2.28 |
4.48 |
5.5 |
13.8 |
|
13.7 |
5.7 |
|
|
|
|
|
|
|
1.33 |
4.11 |
|
|
|
|
|
CH3 |
H |
CH3 (86a) |
1.17 |
1.97 |
2.34 |
1.17 |
1.97 |
4.50 |
5.5 |
13.9 |
|
13.9 |
5.5 |
|
|
|
|
|
|
|
|
4.15 |
|
|
|
|
|
CH3 |
CH3 |
CH3 (87a) |
0.97 |
1.88 |
152 |
0.97 |
1.88 |
4.53 |
5.8 |
|
|
|
5.8 |
|
|
|
|
|
|
|
|
4.04 |
5.0 |
|
|
|
|
H |
CH3 |
CH3 (88a) |
0.62 |
2.73 |
1.59 |
|
1.89 |
4.54 |
|
|
|
5.5 |
|
|
|
Hb |
|
|
|
|
|
4.09 |
4.5 |
|
|
|
4.5 |
H |
H |
0.75 |
2.95 |
2.18 |
0.75 |
2.95 |
4.53 |
14.9 |
9.5 |
14.9 |
|||
|
|
Hb |
|
|
|
|
|
4.08 |
4.8 |
|
|
|
4.8 |
H |
CH3 |
0.86 |
2.90 |
1.60 |
0.86 |
1.60 |
4.49 |
|
|
|
|||
|
|
|
|
|
|
|
|
4.10 |
|
|
|
|
|
|
|
|
|
|
|
|
|
|
|
|
|
|
|
Numbering scheme
|
|
R2 |
|
||
R1 |
|
|
R3 |
||
C |
|||||
C |
|
C |
|
||
|
|
|
|
|
|
H1 |
|
H3 |
|
||
|
|
Nb |
|
||
Cp |
|
Cp |
|
||
aParameters were determined by the computer simulation of the 100 MHz NMR spectra (C6D6 at 30 °C). Chemical shifts are expressed in ppm downfield from TMS with calibration with C6H6 assumed to be at 7.2 ppm as internal standard.
bPrepared by reaction of Cp2NbCl2 with allylmagnesium bromide.
c JH1H3 and JH1R3) (R D H are in the ranges 0.5 to 0.9 and 0.1 to 0.2 Hz, respectively.
137

138
N
C
H
N N
N
C
H
 N
N
C
H
(89)
|
3 |
|
|
N |
|
2 |
|
C |
1 |
|
H |
N 1' |
N |
|
|
|
|
|
2' |
C |
H
1"
 N
N
2" |
C |
|
|
|
H |
(90) (arbitrary numbering)
H
C 
|
N |
H |
N |
C |
N |
|
|
H |
|
C |
N |
|
H |
20 |
21 |
C |
|
N
22
H |
N |
C |
N |
|
H
C
N