Friesner R.A. (ed.) - Advances in chemical physics, computational methods for protein folding (2002)(en)
.pdf326 |
john l. klepeis et al. |
A reference free energy, Gapprox0 , was used to normalize the probabilities at each temperature point. All free energies, Gapprox0 , Gapproxi and Gapproxj , refer to the
harmonic approximation of the free energy as calculated using Eq. (44). The denominator, which represents the total probability at a given temperature, is calculated by summing over the set of all conformers.
The relative free energies for clusters of met-enkephalin structures are given in Table XIII. At each temperature point the Zimmerman code and corresponding data for the top three clusters are listed. The results indicate that the structure exhibiting the individual lowest free energy does not always belong to the cluster with lowest free energy. At 100 and 200 K the DC*B and AAA clusters are consistent with the structures of the FEGM. However, although the FEGM retains the AAA structure at 300 and 400 K, the group of structures possessing the lowest Gcluster at these temperatures exhibits a CD*A Zimmerman code. This is, at least in part, attributable to the large number of structures grouped in this cluster. In contrast to the a-helical-type structure for the FEGM, the CD*A structures possess elements of a b-turn conformation. Specifically the lowest free energy conformer exhibiting a CD*A structure at 300 and 400 K, possesses a type II b-bend along the Gly2–Gly3 backbone.
TABLE XIII
Clustered Relative Free Energies for Isolated Met-enkephalin Using the EDAa
Temperature (K) |
Code |
Number |
Pi piapprox |
Gcluster |
|
DC*B |
113 |
0.636 |
0.0899 |
100 |
CC*B |
136 |
0.0794 |
0.503 |
|
C*DE |
557 |
0.0765 |
0.511 |
|
AAA |
323 |
0.230 |
0.585 |
200 |
DC*A |
1828 |
0.213 |
0.615 |
|
C*DE |
676 |
0.192 |
0.656 |
|
CD*A |
2685 |
0.297 |
0.723 |
300 |
DC*A |
1843 |
0.100 |
1.372 |
|
AAA |
328 |
0.0990 |
1.379 |
|
CD*A |
2654 |
0.219 |
1.209 |
400 |
DC*A |
1799 |
0.0452 |
2.461 |
|
AAA |
329 |
0.0380 |
2.600 |
|
CD*A |
2449 |
0.112 |
2.174 |
500 |
C*C*A |
1361 |
0.0256 |
3.640 |
|
C*AE |
1463 |
0.0229 |
3.752 |
aFrom left to right, the information provided in this table includes temperature, Zimmerman codei, number of individual structures in cluster, total probality ðPi papproxi Þ, and free energy of cluster
ðGclusterÞ.
deterministic global optimization and ab initio approaches |
327 |
|||||||
|
|
|
TABLE XIV |
|
|
|
||
|
|
Input Parameters Used for FEDA Runsa |
|
|
|
|||
|
|
|
|
|
|
|
|
|
Run No. |
a0 |
R |
T (K) |
|
Run No. |
a0 |
R |
T (K) |
1 |
5 |
0.90 |
50 |
|
6 |
5 |
0.90 |
300 |
2 |
5 |
0.90 |
100 |
|
7 |
5 |
0.90 |
350 |
3 |
5 |
0.90 |
150 |
|
8 |
5 |
0.90 |
400 |
4 |
5 |
0.90 |
200 |
|
9 |
5 |
0.90 |
450 |
5 |
5 |
0.90 |
250 |
|
10 |
5 |
0.90 |
500 |
|
|
|
|
|
|
|
|
|
aHere a0 refers to the initial a values used for all global variables. R refers to the reduction rate applied at each level of the branch and bound tree. T refers to the thermodynamic temperature at which the free energy was calculated.
FEDA was also applied to the isolated form of met-enkephalin. For this approach, the thermodynamic temperature appears as an input parameter, and these values had to be specified along with initial a values. Several methods can be envisioned for initializing the FEDA. For example, if the goal is to characterize the low free energy conformers at a single temperature, a full set of FEDA runs could be performed for that temperature. This type of search should efficiently locate the global and many low free energy conformers for that temperature. However, the goal was to effectively characterize the FEGM and low free energy conformers over a range of temperatures. Therefore each of the 10 (FEDA) runs were conducted at a unique temperature point in the range of 50 to 500 K. The details of the conditions for these runs are given in Table XIV.
In total, 87,974 distinct local minima were found after compiling the results from the 10 (FEDA) runs for isolated met-enkephalin. The PEGM and FEGM found using the FEDA are displayed in Table XV. It should be noted that when comparing PEGM for the EDA and FEDA, both structures possess the same potential energies, but a different set of dihedral angles. However, these structures are actually the same. That is, the different values of w2 and w3 for Tyr1 represent a degenerate state for tyrosine, which is generated by rotating both of these dihedral angles by 180 . An important observation is that at 200 K the FEDA method predicts a slightly lower FEGM. The structure possesses a lower potential energy ( 10.547 vs. 9.899 kcal/mol) and exhibits a free energy value that is 0.044 kcal/mol lower than the EDA predicted FEGM. The remaining FEGM predictions are consistent for the two approaches.
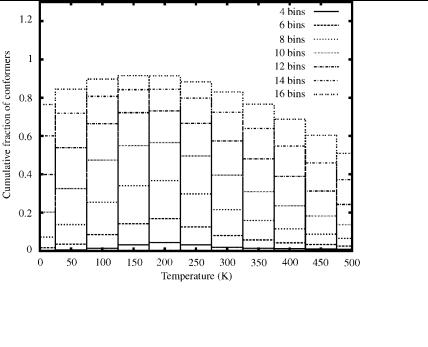
An analysis of the distribution of distinct minima, as given by Table XVI, reveals that the results are qualitatively consistent with those produced by the EDA. It should be noted that in all cases the lowest free energy bin is as densely populated as the corresponding EDA bins, which indicates that each run using the FEDA was able to find a better distribution of low free energy conformers near the FEGM. This is not unexpected, considering that the FEDA runs were

328 john l. klepeis et al.
TABLE XV
Dihedral Angle Values for PEGM and FEGM Structures of Isolated Met-enkephalin Using FEDAa
Residue |
DA |
PEGM |
100 K |
200 K |
300 K |
400 K |
500 K |
|
|
|
|
|
|
|
|
|
|
Tyr1 |
f |
83.4 |
83.4 |
163.1 |
179.8 |
179.8 |
90.2 |
|
|
c |
155.8 |
155.8 |
40.5 |
18.2 |
18.2 |
149.1 |
|
|
o |
177.1 |
177.1 |
177.7 |
178.1 |
178.1 |
177.5 |
|
|
w1 |
173.2 |
173.2 |
172.2 |
178.2 |
178.2 |
169.8 |
|
|
w2 |
100.7 |
100.7 |
93.2 |
81.3 |
81.3 |
71.8 |
|
|
w3 |
13.7 |
13.7 |
177.2 |
177.3 |
177.3 |
2.4 |
|
Gly2 |
f |
154.3 |
154.3 |
65.1 |
59.8 |
59.8 |
66.1 |
|
|
c |
85.8 |
85.8 |
89.7 |
37.6 |
37.6 |
87.5 |
|
|
o |
168.5 |
168.5 |
174.1 |
178.8 |
178.8 |
173.4 |
|
Gly3 |
f |
83.0 |
83.0 |
152.6 |
67.0 |
67.0 |
147.2 |
|
|
c |
75.0 |
75.0 |
34.4 |
40.1 |
40.1 |
36.7 |
|
|
o |
170.0 |
170.0 |
178.9 |
179.7 |
179.7 |
175.1 |
|
Phe4 |
f |
136.8 |
136.8 |
155.4 |
70.9 |
70.9 |
92.5 |
|
|
c |
19.1 |
19.1 |
159.8 |
39.5 |
39.5 |
34.7 |
|
|
o |
174.1 |
174.1 |
179.2 |
179.8 |
179.8 |
179.1 |
|
|
w1 |
58.9 |
58.9 |
52.1 |
173.9 |
173.9 |
179.1 |
|
|
w2 |
85.5 |
85.5 |
82.9 |
102.6 |
102.6 |
74.7 |
|
Met5 |
f |
163.5 |
163.5 |
79.3 |
161.0 |
161.0 |
154.7 |
|
|
c |
160.9 |
160.9 |
130.4 |
122.1 |
122.1 |
135.3 |
|
|
o |
179.8 |
179.8 |
178.7 |
178.0 |
178.0 |
179.9 |
|
|
w1 |
52.9 |
52.9 |
66.8 |
174.7 |
174.7 |
172.6 |
|
|
w2 |
175.3 |
175.3 |
179.8 |
174.0 |
174.0 |
175.1 |
|
|
w3 |
179.9 |
179.9 |
179.9 |
179.0 |
179.0 |
179.9 |
|
|
w4 |
178.6 |
178.6 |
60.0 |
60.1 |
60.1 |
180.0 |
|
G |
|
11.707 |
2.499 |
6.107 |
14.175 |
22.200 |
29.592 |
|
E |
|
11.707 |
11.707 |
10.547 |
9.899 |
9.899 |
6.338 |
|
aThe temperatures are provided in the first row. The last two rows indicate the harmonic free energy (kcal/mol) and the potential energy value (kcal/mol), respectively.
conducted at the same discrete temperature points used in the analysis. However, when comparing the populations of higher energy bins at low temperatures, the number of minima is larger for the EDA. Some of this variation, especially near the 150 to 200 K range, is probably due to the lower FEGM found by the FEDA. In general, the FEDA seems to provide a denser distribution of distinct minima at higher temperatures and large bin number.
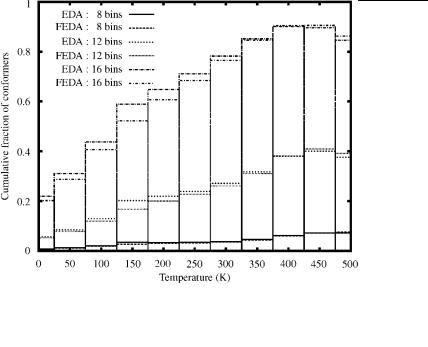
A comparison of the relative efficiencies for the EDA and FEDA to generate low-energy local minima can also be made by examining Fig. 19. In this plot the cumulative fraction of conformers, which is equal to the total number of unique conformers within the first 8, 12, and 16 energy bins over the total number of unique conformers, is given as a function of temperature. It is apparent that both approaches are highly efficient. For example, at 400 K approximately 90% of

330 |
|
john l. klepeis et al. |
|
|
|
|
TABLE XVII |
|
|
Clustered Relative Free Energies for Isolated Met-enkephalin Using the FEDAa |
||||
|
|
|
|
|
Temperature (K) |
Code |
Number |
Pi piapprox |
Gcluster |
|
DC*B |
107 |
0.532 |
0.125 |
100 |
C*DE |
990 |
0.232 |
0.291 |
|
CC*A |
1604 |
0.0636 |
0.547 |
|
C*DE |
1275 |
0.331 |
0.439 |
200 |
AAA |
322 |
0.209 |
0.623 |
|
DC*A |
1729 |
0.174 |
0.694 |
|
CD*A |
2128 |
0.263 |
0.796 |
300 |
C*DE |
1360 |
0.125 |
1.239 |
|
AAA |
327 |
0.111 |
1.309 |
|
CD*A |
2116 |
0.192 |
1.313 |
400 |
C*DE |
1362 |
0.0464 |
2.440 |
|
DC*A |
1714 |
0.0429 |
2.502 |
|
CD*A |
1966 |
0.0922 |
2.368 |
500 |
C*AE |
2088 |
0.0308 |
3.459 |
|
C*C*A |
1900 |
0.0279 |
3.555 |
aFrom left to right, the information provided in this table includes temperature, Zimmerman codei, number of individual structures in cluster, total probability ðPi papproxi Þ, and free energy of cluster
ðGclusterÞ.
the total unique conformations identified are in the top 16 free energy bins, which ranges up to 8 kcal/mol above the FEGM. The lower fractions at lower temperatures indicate that a relatively large number of conformations have high potential energies and that these energetic differences are not offset by entropic effects at low temperatures. A more subtle comparison can be made by observing that the EDA cumulative fractions are generally higher for temperatures lower than 400 K. Although the total number of unique conformations is slightly lower for the EDA, this trend indicates that the EDA is more efficient at filling low-energy bins, especially at lower temperatures.
The results for the cluster analysis of the FEDA met-enkephalin structures are given in Table XVII. There are some differences between the EDA and FEDA cluster free energies, although the overall trend is the same. At all temperatures, excluding 200 K, the cluster exhibiting the lowest cluster free energy is the same as in the EDA analysis. At 200 K, the FEDA predicts the AAA cluster as having a slightly higher free energy than the C*DE cluster, which only appears as the third cluster in Table XIII. In both analyses, the transition from the ground-state DC*B cluster to the CD*A cluster as temperature increases is evident.

deterministic global optimization and ab initio approaches 331
Because both the EDA and FEDA provide large amounts of statistical information for the peptide system, these data were used to perform a simple thermodynamic analysis of the folding process. It is widely accepted that the folding of peptides progresses successively. The first step of this process is typically associated with a structural collapse—that is, a transition from random extended structures to an ensemble of compact structures. This transition should also be associated by significant changes in the description of the ensemble as temperature changes. For example, a peak in the specific heat at the transition temperature indicates a steep decrease in average potential energy of the ensemble. In order to verify that such a transition occurs for met-enkephalin, the specific heat was calculated using the following expression:
C |
¼ |
|
b2ðhE2iT hEiT2 Þ |
ð |
56 |
Þ |
|
N |
|||||||
|
|
|
Here N refers to the number of amino acid residues in the peptide. The average energy and squared energy (hEiT and hE2iT , respectively) were calculated at 10 temperature points using expressions of the form given in Eq. (49). The bin
probabilities were based on an energy width of .015625 kcal/mol. In addition, a reference free energy, Gapprox0 (the lowest free energy), was used to normalize the
probabilities at each temperature point.
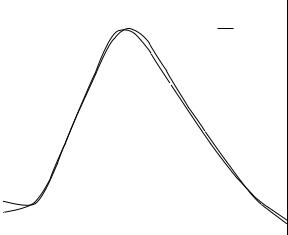
The results for isolated met-enkephalin are shown in Fig. 20. Both the EDA and FEDA predict a transition temperature in the 250–275 K temperature range. This is consistent with the increase in bin density and structural diversity at higher temperatures, and it suggests a sharp increase in the average potential energy of the system at this temperature. It also supports the transition from the DC*B ground-state (PEGM) cluster to the higher potential energy CD*A cluster in this temperature range.
Similar results for characterizing the folding transitions of enkephalins have also been obtained by multicanonical simulations [91]. This is encouraging because the two methods possess fundamental differences. In contrast to this work, the multicanonical approach does not rely on the identification of lowenergy local minima or the concepts of the harmonic approximation. Instead, thermodynamic quantities are developed by first generating large ensembles of structures with wide ranging energies and then employing reweighting techniques. In addition, although the multicanonical simulations included detailed atomistic level modeling, only unsolvated systems were considered.
The EDA was then applied to the RRIGS solvated form of met-enkephalin using the same protocol and conditions as detailed above. Qualitatively, the PEGM (in this case, PEGM refers to potentialþsolvation) for solvated metenkephalin exhibits a more extended conformation than that which is observed for the isolated form. As detailed in Table XVIII, the PEGM structure persists as

deterministic global optimization and ab initio approaches 333
TABLE XVIII
Dihedral Angle Values for PEGM and FEGM Structures of Solvated Met-enkephalina
Residue |
DA |
PEGM |
100 K |
200 K |
300 K |
400 K |
500 K |
|
|
|
|
|
|
|
|
Tyr1 |
f |
168.2 |
168.2 |
170.9 |
168.4 |
168.4 |
152.5 |
|
c |
30.9 |
30.9 |
28.5 |
34.3 |
34.3 |
153.2 |
|
o |
178.6 |
178.6 |
177.5 |
178.9 |
178.9 |
178.5 |
|
w1 |
173.5 |
173.5 |
178.8 |
178.7 |
178.7 |
179.0 |
|
w2 |
100.9 |
100.9 |
61.3 |
100.8 |
100.8 |
101.2 |
|
w3 |
19.3 |
19.3 |
4.1 |
179.0 |
179.0 |
179.9 |
Gly2 |
f |
78.5 |
78.5 |
73.8 |
177.8 |
177.8 |
173.9 |
|
c |
86.5 |
86.5 |
47.6 |
179.9 |
180.0 |
177.1 |
|
o |
177.3 |
177.3 |
179.2 |
180.0 |
180.0 |
179.8 |
Gly3 |
f |
162.4 |
162.4 |
167.6 |
180.0 |
180.0 |
179.6 |
|
c |
92.2 |
92.2 |
145.2 |
179.9 |
179.9 |
179.3 |
|
o |
172.6 |
172.6 |
175.2 |
179.7 |
179.7 |
179.6 |
Phe4 |
f |
150.3 |
150.3 |
149.3 |
155.3 |
155.4 |
155.4 |
|
c |
159.8 |
159.8 |
135.8 |
147.2 |
149.5 |
149.3 |
|
o |
178.1 |
178.1 |
176.6 |
176.8 |
178.3 |
178.3 |
|
w1 |
65.8 |
65.8 |
177.3 |
179.5 |
179.5 |
179.7 |
|
w2 |
87.4 |
87.4 |
108.1 |
111.7 |
105.6 |
74.4 |
Met5 |
f |
75.0 |
75.0 |
85.5 |
78.7 |
78.7 |
78.9 |
|
c |
113.9 |
113.9 |
41.1 |
51.1 |
113.4 |
113.5 |
|
o |
178.4 |
178.4 |
179.9 |
179.7 |
179.1 |
179.1 |
|
w1 |
172.3 |
172.3 |
65.6 |
67.2 |
67.4 |
67.4 |
|
w2 |
176.1 |
176.1 |
179.6 |
178.8 |
178.8 |
178.8 |
|
w3 |
180.0 |
180.0 |
179.4 |
179.9 |
179.9 |
179.9 |
|
w4 |
60.0 |
60.0 |
179.5 |
180.0 |
60.0 |
60.0 |
G |
|
50.060 |
41.896 |
34.566 |
28.604 |
22.828 |
17.166 |
E |
|
50.060 |
50.060 |
48.676 |
46.030 |
45.780 |
44.797 |
aThe temperatures are provided in the first row. The last two rows indicate the harmonic free energy (kcal/mol) and the potential energy value (kcal/mol), respectively.
small, and the entropic correction tends to induce an even stronger equalization of the free energy values. This equalization is best illustrated by the data plotted in Fig. 22, which indicate that the efficiency of locating low-free-energy conformers is relatively high at all temperatures. In fact, the highest density of states occurs near the middle of the temperature range, rather than at high temperatures as predicted for the isolated peptide. This behavior may be due to a lack of much-higher-energy local minima that would probably populate these high-temperature, high-energy bins.
Similar conclusions can be drawn by examining the data presented in Fig. 23, which provides information on the energy extrema for free energy bins at temperatures of 0, 250, and 500 K. As expected, for both 250, and 500 K, the
334 |
john l. klepeis et al. |
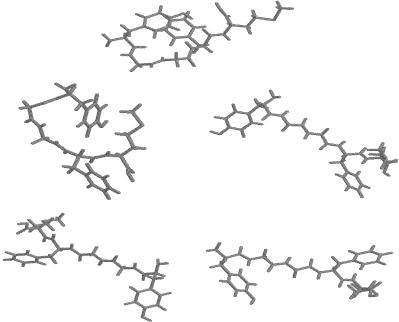
Figure 21. FEGM structures for solvated met-enkephalin. The top figure is the PEGM and the FEGM for 100 K. The structures at other temperatures (200 K, 300 K, 400 K, 500 K) are shown left to right, top to bottom.
range of energy values increases for higher-free-energy bins. In addition, for all bins, the minimum energy is relatively low and generally within a few kcal/mol of the PEGM. However, unlike the isolated met-enkephalin results, the maximum energy values do not become larger at higher temperatures. In fact, the curves for maximum energy at 250 and 500 K are almost identical. This indicates that relatively high energy minima may be needed in order to fill out these high-temperature bins.
A clustering analysis of the low-free-energy conformers was also performed for solvated met-enkephalin, and the results are shown in Table XX. At 100 K, the lowest free energy cluster included the FEGM structure, which is also the PEGM structure. At higher temperatures, the correlation between the extended FEGM structures and the lowest-free-energy cluster was also evident. In fact, all low energy clusters at 300, 400, and 500 K possess highly extended backbone conformations, with nearly all geometries within the E and E* regions on the Zimmerman conformational map. In fact, although the number of individual structures in each cluster is not excessively large, many of these extended conformers reside in the lowest free energy bins.