

Friesner R.A. (ed.) - Advances in chemical physics, computational methods for protein folding (2002)(en)
.pdf306 john l. klepeis et al.
The global minimum structures for the area-based hydration models (gradient inclusive) are less extended, as exhibited by Figs. 14 and 15. The lowest
energy structures for the WE1 |
and WE2 models are very similar, with an |
||
the end-to-end C |
a |
|
˚ |
|
distance of 5.85 A for both solvation models. In addition, the |
||
bend near the N-termini is stabilized by a hydrogen bond between the CO of the tyrosine residue and the NH proton of the phenylalanine residue (approximately
˚ 0 b
1.98 A). This bend is similar to the type II -bend of the unsolvated global minimum energy structure, although it is shifted to the Gly2–Gly3 backbone
˚
region. The aromatic ring separation is wider (approximately 6.48 A for both models) than for the RRIGS global minimum structure, although the side-chain orientations are similar. The values of the dihedral angles for the WE1 and WE2 global minimum structures are given in Tables IV and V, respectively.
The lowest energy conformation for the OONS ASP is also similar to the WE1 and WE2 structures. In this case, the end-to-end Ca distance is again
˚ 0 b
5.85 A. The bending near the N-termini is again similar to a type II -bend along the Gly2–Gly3 backbone, although in this case it is stabilized by a slightly weaker hydrogen bond between the CO of the tyrosine residue and the NH
˚ |
˚ |
proton of the phenylalanine residue (approximately 2.01 A). |
The 6.60 A |
aromatic ring separation is also slightly larger, which may be attributed to the slightly hydrophilic character of the aromatic carbon parameters as compared to the WE1 and WE2 ASP sets. The values of the dihedral angles for the global minimum structure are given in Table VI.
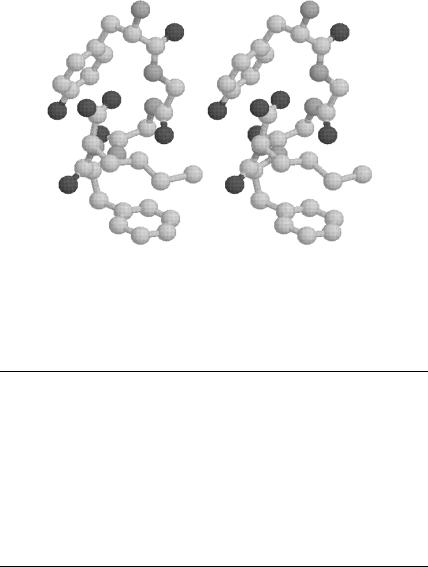
Figure 14. Plot of met-enkephalin conformation (in stereo). Global minimum energy of30.31 kcal/mol using the WE1 model for hydration.
deterministic global optimization and ab initio approaches 307
Figure 15. Plot of met-enkephalin conformation (in stereo). Global minimum energy of 0.62 kca/mol using the SCKS model for hydration.
TABLE IV
Dihedral Angles at the Global Minimum Energy Conformation of Met-enkephalin, Using the WE1 Model for Hydration
|
f |
c |
o |
w1 |
w2 |
w3 |
w4 |
Tyr |
162.65 |
43.34 |
177.43 |
173.76 |
90.62 |
2.61 |
|
Gly |
66.15 |
86.62 |
172.92 |
|
|
|
|
Gly |
152.31 |
32.40 |
178.49 |
|
96.19 |
|
|
Phe |
157.59 |
154.87 |
179.36 |
52.02 |
|
59.99 |
|
Met |
90.62 |
128.89 |
179.18 |
169.29 |
176.88 |
180.14 |
TABLE V
Dihedral Angles at the Global Minimum Energy Conformation of Met-enkephalin, Using the WE2 Model for Hydration
|
f |
c |
o |
w1 |
w2 |
w3 |
w4 |
Tyr |
162.70 |
43.23 |
177.47 |
173.94 |
90.83 |
2.63 |
|
Gly |
66.15 |
86.59 |
173.03 |
|
|
|
|
Gly |
152.49 |
32.41 |
178.55 |
|
96.11 |
|
|
Phe |
157.84 |
154.97 |
179.26 |
52.12 |
|
59.99 |
|
Met |
89.96 |
129.19 |
179.17 |
169.47 |
176.75 |
180.13 |

308 |
|
|
john l. klepeis et al. |
|
|
|
|
|
|
|
TABLE VI |
|
|
|
|
|
Dihedral Angles at the Global Minimum Energy Conformation of Met-enkephalin, |
|
|||||
|
|
Using the OONS Model for Hydration |
|
|
|||
|
|
|
|
|
|
|
|
|
f |
c |
o |
w1 |
w2 |
w3 |
w4 |
Tyr |
166.11 |
50.84 |
176.25 |
188.97 |
102.81 |
2.45 |
|
Gly |
63.86 |
86.04 |
175.39 |
|
|
|
|
Gly |
151.94 |
33.86 |
178.80 |
|
96.43 |
|
|
Phe |
159.47 |
153.41 |
179.46 |
50.93 |
|
|
|
Met |
79.75 |
148.31 |
178.93 |
68.16 |
181.45 |
178.08 |
59.70 |
The SCKS global minimum structure is even less extended, as shown in
|
|
˚ |
Fig. 15. Although the aromatic ring separation becomes wider (8.13 A), the |
||
overall end-to-end C |
a |
˚ |
|
distance decreases to 5.80 A. In this structure, there are |
|
˚
two stabilizing hydrogen bonds—a 1.86 A hydrogen bond between the NH proton of the first glycine residue and the CO of the methionine residue, and a
˚
2.02 A hydrogen bond between the CO of the first glycine residue and the NH proton of the phenylalanine residue. This backbone structure exhibits a type II0 b-bend around the Gly3 and Phe4 residues, which is similar to the global minimum energy conformation for unsolvated met-enkephalin. This compact structure is consistent with the relatively strong hydrophobic values of all carbon atom free energy parameters, as well as the relatively weak hydrophobic values of the oxygen and nitrogen atoms for the SCKS ASP set. The values of dihedral angles corresponding to the global minimum energy structure are given in Table VII.
In contrast, the JRF global minimum energy structure resembles a more
extended conformation, with an overall end-to-end C |
a |
˚ |
|
distance of 9.56 A. |
The plot of this structure, given in Fig. 16, shows that the residues near the N-terminus are almost fully extended, although there is slight turn near the
˚
C-terminus. This bending is stabilized by the formation of 2.10 A hydrogen bond between the CO of the second glycine residue and the NH proton of the
TABLE VII
Dihedral Angles at the Global Minimum Energy Conformation of Met-enkephalin, Using the SCKS Model for Hydration
|
f |
c |
o |
w1 |
w2 |
w3 |
w4 |
Tyr |
82.91 |
154.09 |
176.27 |
172.88 |
79.47 |
166.08 |
|
Gly |
151.61 |
81.91 |
168.71 |
|
|
|
|
Gly |
84.09 |
72.41 |
169.54 |
|
86.04 |
|
|
Phe |
137.07 |
18.52 |
173.06 |
57.94 |
|
58.18 |
|
Met |
162.71 |
158.63 |
179.76 |
51.94 |
173.67 |
179.21 |
deterministic global optimization and ab initio approaches 309
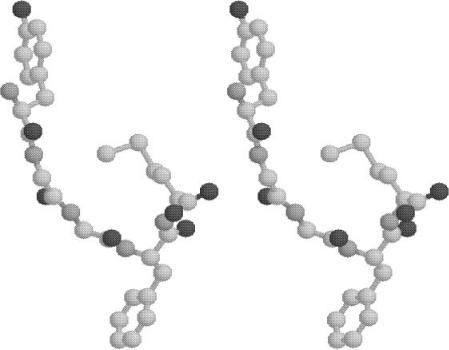
Figure 16. Plot of met-enkephalin conformation (in stereo). Global minimum energy of283.76 kcal/mol using the JRF model for hydration.
˚
methionine residue. In addition, the structure displays a large 14.87 A separation between the centroids of the Phe and Tyr aromatic rings. This can be partly attributed to the strongly hydrophilic character of the aromatic and carboxyl (carbonyl) carbons parameters for the JRF ASP set. The values of dihedral angles corresponding to the global minimum energy are given in Table VIII.
The structures were further analyzed by comparing energy evaluations at corresponding global minimum solutions. This information is given in Tables IX and X. In all cases, excluding the SCKS model, the JRF global minimum energy structure provides that most stabilizing values for the hydration energy. However, these stabilizing hydration energies are generally offset by the relatively high value for potential energy at the JRF global minimum conformation (5.06 kcal/mol, obtained by calculating ETOT EHYD from Tables IX and X). In fact, the high potential energy causes the JRF structure to exhibit the highest values for overall energy, excluding the case of the JRF model. Only when considering the JRF model do these stabilizing hydration free energies tend to dominate the prediction of the global minimum structure. This is

310 |
|
|
john l. klepeis et al. |
|
|
|
|
|
|
|
TABLE VIII |
|
|
|
|
|
Dihedral Angles at the Global Minimum Energy Conformation of Met-enkephalin, |
|
|||||
|
|
Using the JRF Model for Hydration |
|
|
|||
|
|
|
|
|
|
|
|
|
f |
c |
o |
w1 |
w2 |
w3 |
w4 |
Tyr |
84.96 |
160.74 |
179.09 |
59.83 |
100.80 |
179.29 |
|
Gly |
160.26 |
151.83 |
177.53 |
|
|
|
|
Gly |
159.50 |
157.94 |
178.71 |
61.87 |
|
|
|
Phe |
76.55 |
76.23 |
178.05 |
108.68 |
84.91 |
|
|
Met |
132.90 |
147.47 |
179.83 |
65.17 |
175.99 |
59.38 |
|
evidenced by the fact that the JRF structure provides an overall energy, more than 100 kcal/mol lower than any other total energy, which can be directly attributed to the differences in hydration energy. When using the SCKS model, the only case for which the JRF conformation does not produce the most stabilizing hydration energy, the JRF structure provides the least stabilizing
TABLE IX
Comparison of Hydration Energies for Met-enkephalina
|
Global of |
ETOT |
EHYD |
ENB |
EES |
ETOR |
(RMSD) |
RRIGS |
RRIGS |
50.01 |
41.42 |
21.84 |
31.46 |
1.02 |
0.00 |
|
WE1 |
47.87 |
38.12 |
22.09 |
32.61 |
0.78 |
2.83 |
|
WE2 |
47.91 |
38.14 |
22.09 |
32.63 |
0.76 |
2.83 |
|
OONS |
47.17 |
37.95 |
22.25 |
32.13 |
0.66 |
2.66 |
|
SCKS |
47.24 |
35.61 |
21.47 |
35.40 |
2.30 |
4.04 |
|
JRF |
41.63 |
46.69 |
23.29 |
19.13 |
0.90 |
4.83 |
WE1 |
RRIGS |
26.60 |
18.00 |
21.84 |
31.46 |
1.02 |
2.83 |
|
WE1 |
30.31 |
20.56 |
22.09 |
32.61 |
0.78 |
0.00 |
|
WE2 |
30.31 |
20.53 |
22.09 |
32.63 |
0.76 |
0.01 |
|
OONS |
29.01 |
19.79 |
22.25 |
32.13 |
0.66 |
0.80 |
|
SCKS |
27.80 |
16.17 |
21.47 |
35.40 |
2.30 |
3.33 |
|
JRF |
19.49 |
24.55 |
23.29 |
19.13 |
0.90 |
4.33 |
WE2 |
RRIGS |
29.87 |
21.27 |
21.84 |
31.46 |
1.02 |
2.83 |
|
WE1 |
33.26 |
23.52 |
22.09 |
32.61 |
0.78 |
0.01 |
|
WE2 |
33.27 |
23.49 |
22.09 |
32.63 |
0.76 |
0.00 |
|
OONS |
32.01 |
22.79 |
22.25 |
32.13 |
0.66 |
0.80 |
|
SCKS |
30.77 |
19.15 |
21.47 |
35.40 |
2.30 |
3.33 |
|
JRF |
22.93 |
27.99 |
23.29 |
19.13 |
0.90 |
4.32 |
aThe first column refers to the hydration model used in the function evaluations, which are performed at the global solutions for the hydration model listed in the second column. The total energy, ETOT, is provided along with the contributions from hydration, EHYD, nonbonded interactions (including hydrogen bonding), ENB, electrostatic interactions, EES, and torsion, ETOR. The last column provides the heavy-atom root-mean-squared deviation between the global minimum energy structures of the hydration models listed in the first two columns.

deterministic global optimization and ab initio approaches |
311 |
||||||
|
|
|
TABLE X |
|
|
|
|
|
Comparison of Hydration Energies for Met-enkephalina |
|
|
||||
|
|
|
|
|
|
|
|
|
Global of |
ETOT |
EHYD |
ENB |
EES |
ETOR |
(RMSD) |
OONS |
RRIGS |
24.18 |
15.59 |
21.84 |
31.46 |
1.02 |
2.66 |
|
WE1 |
31.08 |
21.33 |
22.09 |
32.61 |
0.78 |
0.80 |
|
WE2 |
31.09 |
21.31 |
22.09 |
32.63 |
0.76 |
0.80 |
|
OONS |
31.45 |
22.23 |
22.25 |
32.13 |
0.66 |
0.00 |
|
SCKS |
29.57 |
17.95 |
21.47 |
35.40 |
2.30 |
3.38 |
|
JRF |
19.60 |
24.66 |
23.29 |
19.13 |
0.90 |
4.12 |
SCKS |
RRIGS |
3.43 |
12.02 |
21.84 |
31.46 |
1.02 |
4.04 |
|
WE1 |
0.90 |
10.65 |
22.09 |
32.61 |
0.78 |
3.33 |
|
WE2 |
0.89 |
10.67 |
22.09 |
32.63 |
0.76 |
3.33 |
|
OONS |
1.66 |
10.88 |
22.25 |
32.13 |
0.66 |
3.38 |
|
SCKS |
0.62 |
11.00 |
21.47 |
35.40 |
2.30 |
0.00 |
|
JRF |
17.44 |
12.38 |
23.29 |
19.13 |
0.90 |
3.78 |
JRF |
RRIGS |
139.36 |
130.77 |
21.84 |
31.46 |
1.02 |
4.83 |
|
WE1 |
180.59 |
170.84 |
22.09 |
32.61 |
0.78 |
4.33 |
|
WE2 |
180.57 |
170.79 |
22.09 |
32.63 |
0.76 |
4.32 |
|
OONS |
181.70 |
172.48 |
22.25 |
32.13 |
0.66 |
4.12 |
|
SCKS |
171.67 |
160.04 |
21.47 |
35.40 |
2.30 |
3.78 |
|
JRF |
283.76 |
288.82 |
23.29 |
19.13 |
0.90 |
0.00 |
aThe first column refers to the hydration model used in the function evaluations, which are performed at the global solutions for the hydration model listed in the second column. The total energy, ETOT, is provided along with the contributions from hydration, EHYD, nonbonded interactions (including hydrogen bonding), ENB, electrostatic interactions, EES, and torsion, ETOR. The last column provides the heavy-atom root-mean-squared deviation between the global minimum energy structures of the hydration models listed in the first two columns.
hydration energy. This indicates that unlike the other hydration models, the SCKS model does not provide more hydration energy stabilization for extended conformations. This agrees with the prediction of the SCKS global minimum energy structure, which exhibits the most folded conformation. The SCKS structure also closely resembles the unsolvated global minimum energy structure and it exhibits the lowest potential energy contribution, 11.63 kcal/mol, which is only 0.08 kcal/mol higher than the global minimum potential energy. This suggests that low potential energy conformations are not only favored but also enhanced by hydration effects for the SCKS model. Excluding the SCKS model, the other models predict relatively large hydration energies at the SCKS structure. In fact, for the RRIGS, WE1 and WE2 models, the SCKS structure produces the highest values for the hydration energies. For the OONS and JRF model, the hydration energies are only smaller than those for the RRIGS structure. This is consistent with the hydrophilic nature of the aromatic carbons for the OONS and JRF models. Specifically, because the aromatic ring separation is smallest for the RRIGS structure, the OONS and JRF hydration
312 |
john l. klepeis et al. |
models tend to provide higher hydration energies for this structure. Although hydration energies for the RRIGS structure are typically high, the RRIGS model predicts a stabilizing hydration energy for this structure, second only to the JRF structure. It is this hydration energy contribution, when coupled with a relatively low potential energy ( 8.59 kcal/mol), that sets the RRIGS global minimum energy structure. For the other hydration models, low potential energy contributions ( 9.77, 9.75, and 9.22 kcal/mol for WE2, WE1, and OONS, respectively) seem to be more important in the prediction of relatively compact structures. In these cases the relative weighting of the hydration energy contributions does not favor extended conformations. However, these models also do not provide low hydration energies at the most compact structures, such as the SCKS global minimum energy structure. This indicates an interplay of hydration and potential energy contributions, although the prediction of relatively compact structures suggest the importance of low potential energy contributions.
Like met-enkephalin, leu-enkephalin (H–Tyr–Gly–Gly–Phe–Leu–OH) is an endogenous pentapeptide in which the methionine residue has been replaced by a leucine residue. Qualitatively, the results for the hydrated forms of leuenkephalin are similar to those for met-enkephalin [81].
5.Free Energy Modeling
Locating the global minimum potential energy or the global minimum potential plus solvation energy conformation is not sufficient because Anfinsen’s thermodynamic hypothesis requires the minimization of the conformational free energy. Specifically, potential energy minimization neglects the entropic contributions to the stability of the molecule. An approximation to these entropic contributions can be developed by using information about low-energy conformations. That is, once a sufficient ensemble of low-energy minima has been identified, a statistical analysis can be used to estimate the relative entropic contributions, and thus the relative free energy, for conformations in the ensemble.
Therefore, the analysis of the free energy of peptides requires efficient methods for locating not only the global minimum energy structure but also large numbers of low-energy conformers. A variety of methods have been used to find such stationary points on potential energy surfaces. For example, periodic quenching during a Monte Carlo or molecular dynamics trajectory can be used to identify local minima [82]. However, a drawback of these approaches is their inherent stochastic nature. In its original form, the aBB deterministic global optimization algorithm [15–18,73] has been shown to be an efficient method for finding the global minimum energy conformation for both unsolvated and solvated peptide systems [78,81,83]. Here, novel methods are proposed within the framework of the aBB algorithm to optimize the free energy of peptide systems. These modifications facilitate the generation of ensembles of

deterministic global optimization and ab initio approaches 313
low-energy conformers, which can be used to identify the global minimum free energy conformation, as well as perform detailed free energy rankings.
In peptide systems, this entropic contribution arises from fluctuations around a local conformational state. There exist a number of procedures, including both exact and approximate calculations, that can be used to determine the entropic contributions, and thus the free energy, of peptide systems.
First, assume that the full conformational space R can be considered as the union of disjoint basins of attraction, and the conformational space associated with a given basin (denoted by g) is defined by Rg. The energy, E, is a function of the variable set y, which corresponds to the set of dihedral angles used to describe the conformational state of the system. Each basin of attraction is characterized by a unique local minimum at position yg, with a corresponding energy Eg. That is, local minimization starting at any point in Rg will lead to the local minimum at yg. It should be noted that this approximation of the conformational space excludes all maxima and saddle point conformations.
For a given temperature, T, the probability that a peptide occupies the conformational space of a given basin (Rg) can be described by a Gibbs–Boltzmann distribution:
ÐRg expð bEðyÞÞ dy |
ð37Þ |
pg ¼ ÐR expð bEðyÞÞ dy |
Here b is equivalent to 1=kBT. If the numerator is redefined as the partition function (Zg) for the basin, Eq. (37) can be rewritten as
pg ¼ |
Zg |
ð38Þ |
Z |
The total partition function for the entire conformational space is represented by Z. Because this function is described by a disjoint set of basins (Rg), it is equivalent to the following form:
Z ¼ X Zg |
ð39Þ |
g |
|
Once the probability is known, the corresponding free energy, Gg, associated with each basin can also be calculated:
Gg ¼ |
ln pg |
ð40Þ |
b |
Using these definitions, a rigorous procedure can be envisioned for calculating the exact probability associated with a given basin. First, a sample of conformations must be generated with initial starting energies Ei, as defined by the total set I. Each structure is minimized to identify its corresponding basin
314 |
john l. klepeis et al. |
minimum (yg). These structures define the set IðgÞ (i.e., those structures associated with basin g). As the sampling goes to infinity, the probability associated with basin g can be calculated by the following expression:
exact |
¼ |
PiðgÞ2IðgÞ expð bEiðgÞÞ |
ð41Þ |
|
pg |
|
Pi2I expð bEiÞ |
||
Obviously, such a method is intractable for large systems, and this is the impetus for developing approximate methods.
6.Harmonic Approximation
A tractable method for including entropic effects for proteins relies on the concept of the harmonic approximation. Initially, the theoretical development of this approximation for polymer systems generated debate in the literature [84– 86]. In the work of Goldberg [84] a classical rigid model was used to characterize a partition function based on the fixed bond length and bond angle assumptions. In contrast, Flory [86] derived a different partition function using a classical flexible model. Later analysis by Go and Scheraga [85] actually showed that the flexible model was also applicable to the fixed bond length and bond angle system (i.e., a peptide described by the internal coordinate system).
In either case (i.e., rigid or flexible), entropic contributions can be calculated by employing an harmonic approximation [85]. The fundamental concept is to characterize the basin of attraction (g) by the properties of its corresponding local minimum (yg), and not by a random sampling of conformations. These properties include the local minimum energy value, Eg, and the convexity around the local minimum. Essentially, the convexity measure is used to approximate the basin of attraction region as a hyperparabola centered at the local minimum. Therefore, the anharmonic nature of the true basin, which defines the deviation from approximated harmonic behavior, controls the error associated with this assumption.
At each minimum (yg) the harmonic approximation to the entropy can be evaluated using the following expression:
approx |
|
kB |
^ |
|
|
Sg |
¼ |
|
|
ln ½DetðHgÞ& þ f ðTÞ |
ð42Þ |
2 |
|||||
Here Det Hg refers to the determinant of the Hessian (second derivative matrix)
y ^ð Þ
evaluated at the local minimum g. The function f T is an additive term that is only dependent on temperature. The approximated free energy can then be

deterministic global optimization and ab initio approaches 315
calculated by combining the energetic and entropic contributions through the follow expression:
Gapprox |
¼ |
E |
|
TSapprox |
f |
T |
Þ |
ð |
43 |
Þ |
g |
g |
g |
þ ð |
|
|
By substituting the harmonic entropic approximation from Eq. (42), Eq. (43) becomes
Gapprox |
¼ |
E |
þ |
1 |
|
ln |
Det |
H |
~f |
T |
Þ |
ð |
44 |
Þ |
|
2b |
|||||||||||||||
g |
g |
½ |
ð |
|
gÞ& þ ð |
|
|
||||||||
In this equation, it becomes evident that the free energy for a given basin is estimated using only the properties of the corresponding local minimum—that is,
the local minimum energy (Eg) and a measure of local convexity (DetðHgÞ). A
~ð Þ
temperature-dependent term, f T , is included, although it does not affect relative free energy comparisons.
Expressions for the probabilities and partition functions can also be developed. By combining Eqs. (38), (40), and (44), an approximation for the partition
function of a given basin can be written as: |
|
|
|
|
|
|
|
|
|
|
|
|
||||||
ln Zapprox |
¼ b |
E |
ln ½DetðHgÞ& |
|
~f |
T |
Þ þ |
ln Z |
ð |
45 |
Þ |
|||||||
g |
g |
2 |
|
b ð |
|
|
|
|
||||||||||
|
|
|
|
|
|
|
|
|
|
|
|
|
|
|
~ |
|
|
|
A further simplification can be made by realizing that b f ðTÞ and ln Z are |
||||||||||||||||||
|
|
|
|
|
|
|
|
~ |
|
|
|
|
|
|
|
|
|
|
constant for a given temperature (i.e., f ðTÞ ¼ b f ðTÞ þ ln Z). Equation (45) can |
||||||||||||||||||
be rewritten as |
|
|
|
|
|
|
|
|
|
|
|
|
|
|
|
|
|
|
Zapprox |
|
|
1 |
|
1=2exp |
ð |
bE |
|
f |
ð |
T |
Þ |
|
ð |
46 |
Þ |
||
|
|
|
|
|
||||||||||||||
g |
|
¼ ½DetðHgÞ& |
gÞ |
|
|
|
|
|||||||||||
Finally, by using Eq. (39), an approximate probability associated with a given basin (g) can be calculated using the following equation:
approx |
½ |
Det H |
1=2exp |
ð b |
E |
Þ |
|
|
ð |
gÞ& |
g |
|
|||||
pg |
¼ |
PiN¼1 ½DetðHiÞ& 1=2expð bEi Þ |
ð47Þ |
|||||
As expected, the f ðTÞ term disappears, and the statistical weight becomes a function of only the temperature (through b), the local minimum energy value,