Friesner R.A. (ed.) - Advances in chemical physics, computational methods for protein folding (2002)(en)
.pdf376 |
john l. klepeis et al. |
(bbbb, + 4.916) |
(bbj′b, + 4.749) |
(bbi′b, + 5.248) |
(bbai, + 2.719) |
(bjai′, + 2.975) |
(bbaa, + 2.875) |
(biaa, + 1.628) |
(iaaa, − 2.893) |
(aaaa, − 6.643)
Figure 37. One possible pathway from the extended conformation to the ground state of unsolvated tetra-alanine.
deterministic global optimization and ab initio approaches 377
2.No direct b ! a transitions are observed,2 indicating that a rotation of c from b-sheet to a-helical values is too large for a single transition.
3.Most pathways of length 10 or less involve at least one transition where more than one c angle changes (cooperative motion).
4.A wide variety of cooperative motion is possible, but the two most common types are as follows:
bi ! ia 36%
bj ! ii 14%
5.There is a tendency for one-half of the molecule to fold (nearly) completely followed by the other half (e.g., bbbb ! bbaa ! aaaa).
We can analyze the pathway given in Fig. 37 in terms of these observations. The individual c angles proceed as follows:
c1: b ! i ! a
c2: b ! j ! b ! i ! a c3: b ! j ! i ! a
c4: b ! i ! a
Except for a slight backtrack in c2, this pathway is consistent with (1) and (2). This pathway also exhibits three transitions that involve cooperative motion. Two of them are in the form bi ! ia, which is the most common form observed. The other cooperative motion, ji ! ba (nonadjacent alanines), has also been observed but is not nearly as common as the two forms listed above. Finally, it should be remarked that this pathway does pass through a bbaa minimum. In other words, the right side (the carboxyl terminus) folds completely before the left side (the amino terminus) folds at all. Not all pathways follow this rule strictly, although we have found that tetra-alanine tends to fold its right side most of the way before its left side makes significant progress.
The rotation of the f angles plays less of a role in the folding process than rotation of c angles. f takes on similar values for a-helical and b-sheet conformations. We found that the very slowest transitions (on the order of 100 Hz or less) tend to involve rotations of the f angles from inside to outside of the range 180 f 330 and vice versa. In fact, none of the minima involved
2This has been checked rigorously for all pathways length 11 or less with a rate cutoff of 106 Hz. What we have in fact found is that there are transition states that connect two minima b ! a, but either the transition itself is very slow or else the minima are so high in energy that it seems unlikely that a fast pathway (of any length) could pass through it. Our conclusion is that b ! a is not observed for all but the very slow pathways.
378 |
john l. klepeis et al. |
in pathways of any length with a rate cutoff of 106 Hz involves f angles outside this range (they would be indicated in our classification scheme by a doubleprime). This can be proved rigorously by examination of the rate disconnectivity graph, which we will discuss next.
4.Rate Disconnectivity Graph
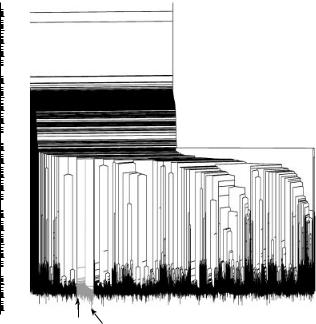
We constructed the rate disconnectivity graph for tetra-alanine at T ¼ 300 K. It is shown in Fig. 38. The rate disconnectivity graph provides us with the ratedependent connectivity of the potential energy surface [4,5,130,131]. If we begin at the top of the graph, with a very small rate cutoff, all of the minima fall into one group that is represented by a single node. As we increase the rate cutoff, transitions get eliminated. At some point, a critical transition gets eliminated which disconnects the minima into two groups. This is represented by the node splitting into two at the rate cutoff value. As the rate cutoff is increased further, more and more transitions are eliminated and the graph continues to bifurcate as
Transitionrate (Hz)
10−10 
10−5 
100 
105 
1010 
bbbb aaaa
Figure 38. Complete rate disconnectivity graph for unsolvated tetra-alanine at T ¼ 300 K. The a-helical ground state and the extended conformation both lie in the highlighted subtree.
380 |
john l. klepeis et al. |
5.Time Evolution of Quantities
Another way of obtaining an overall picture of the folding process of tetraalanine is to study the time-evolution of averages of certain quantities, such as energy, dihedral angles, or distances between specific atoms. If qj is the value of some quantity at minimum j, then hqi, the average value of q, and sq, the standard deviation, can be calculated as a function of time with the help of the Master equation:
q t |
X Pj t |
|
qj |
¼ |
XaielðiÞtujðiÞqj |
|
|
|
||||
h ið |
Þ ¼ |
ð Þ |
|
|
i; j |
|
|
|
|
|||
|
j |
|
|
|
|
|
|
|
|
|
||
|
¼ X ai XujðiÞqj elðiÞt |
ð96Þ |
||||||||||
|
i |
|
|
j |
|
|
|
|
|
|
|
|
hq2iðtÞ ¼ X ai XujðiÞqj2 elðiÞt |
ð97Þ |
|||||||||||
|
i |
|
|
j |
|
|
|
|
|
|
|
|
sq t |
q |
|
98 |
|
||||||||
|
q2 |
t |
Þ h |
q |
2 |
t |
Þ |
ð |
Þ |
|||
ð Þ ¼ h |
ið |
|
i |
ð |
|
|||||||
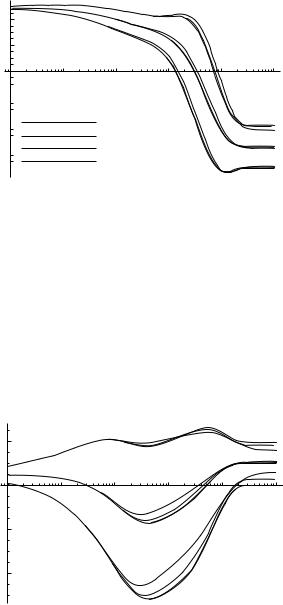
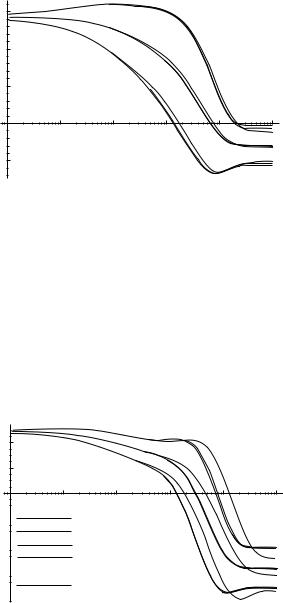
Plots of hqi and hqi sq as functions of time for q ¼ E; f1, and c1 are given in Figs. 39–41.
To obtain the correct time evolution of hqi and sq, it is necessary to solve the Master equation over all of the minima.4 We can also calculate the approximate time evolution of hqi and sq by restricting our attention to only a certain subset of pathways. This is accomplished by restricting the minima and transition states we use to solve the Master equation to those which are visited by the selected pathways.
In Figs. 39–41, we compare the overall time evolution of E, f1, and c1 with the time evolution obtained by restricting our attention to pathways with various length restrictions. The deviations are rather large for a length cutoff of 10, but are much smaller for a length cutoff of 11 or 12 (the same holds true for the other ci and fi angles, not shown). It appears that applying a length cutoff of 11 will yield most of the relevant pathways.
We can also determine the effect of various transition rate cutoffs on the time evolution of E, fi, and ci. In Fig. 42, we compare the overall time evolution of E with that obtained by restricting our attention to pathways with a length cutoff
4Actually, we only solve the Master equation over the 3713 minima in the highlighted region of the rate disconnectivity graph shown in Fig. 38. This is necessary because solving the Master equation for all 62,373 minima would require diagonalizing a 62; 373 62; 373 matrix which does not fit in computer memory. Fortunately, it is also sufficient because the other minima are unreachable during times on the order of 10 9 sec.


deterministic global optimization and ab initio approaches 383
definitely do not. However, these plots only reveal the average progress of these quantities. What we would really like to know is which, if any, of these quantities proceeds monotonically and uniformly for each pathway.
To help answer this question, we developed two ‘‘reaction coordinate indicators’’—one that measures the monotonicity of the reaction coordinate, and the other that measures the uniformity of the reaction coordinate. For a given pathway of length N
min1 ! min2 ! ! minN
a certain quantity q takes on values
q1 ! q2 ! ! qN
The two reaction coordinate indicators are d=D and D2=S, where
d |
¼ |
Xð þ |
|
Þ |
(displacement) |
||
|
|
i¼1 |
qi 1 |
qi |
|
||
|
|
N 1 |
|
||||
|
|
N 1 |
|
|
|
|
|
D ¼ X jqiþ1 qij |
|
(distance) |
|||||
|
|
i¼1 |
|
|
|
|
|
|
|
|
|
N 1 |
|
|
|
S ¼ ðN 1Þ X jqiþ1 qij2 |
(squared distance) |
||||||
i¼1
d=D measures the monotonicity of q along the given pathway, and D2=S measures the uniformity of q along the given pathway. Both indicators take the value 1 in the ideal case.
For each of the quantities E, fi and ci, we tabulated the average value and standard deviation of these two reaction coordinate indicators over the 92,216 relevant pathways in Table XXXIII. As expected, the f angles perform poorly on the monotonicity test (d=D is very small), whereas the energy and the c angles perform reasonably well on the monotonicity test. However, none of the quantities do very well on the uniformity test: the average value of D2=S is around 0:30 for each of the dihedral angles and around 0:48 for the energy. This suggests that changes in a given dihedral angle tend to occur in a small number of big steps, rather than in a large number of small steps. This is consistent with our earlier pathway analysis, where we found that the c angles tend to change one or two at a time.
It is clear that progress toward the a-helical ground state should not be measured in terms of a single c angle, but should reflect the progress of all c

384 |
john l. klepeis et al. |
TABLE XXXIII
Average and Standard Deviation Values of the Reaction Coordinate Indicators d/D and D2/S for Various Quantities Over All Pathways of Length 11 or Less with Transition Rates Exceeding 1010 Hz from the Extended Conformation to the Ground State of Unsolvated Tetra-alanine
|
|
d=D |
|
D2=S |
|
————————————— |
——————————— |
||
Quantity |
Average |
Standard |
Average |
Standard |
|
|
|
|
|
E |
0.796 |
0.099 |
0.482 |
0.144 |
f1 |
0.224 |
0.138 |
0.291 |
0.080 |
c1 |
0.899 |
0.120 |
0.256 |
0.060 |
f2 |
0.032 |
0.034 |
0.304 |
0.077 |
c2 |
0.850 |
0.100 |
0.283 |
0.051 |
f3 |
0.081 |
0.081 |
0.332 |
0.084 |
c3 |
0.867 |
0.129 |
0.298 |
0.071 |
f4 |
0.046 |
0.038 |
0.302 |
0.075 |
c4 |
0.849 |
0.132 |
0.293 |
0.059 |
Pi ci |
0.927 |
0.066 |
0.749 |
0.066 |
da1, a4 |
0.674 |
0.138 |
0.355 |
0.115 |
d1 |
0.762 |
0.129 |
0.467 |
0.098 |
d2 |
0.712 |
0.111 |
0.523 |
0.142 |
d1 þ d2 |
0.818 |
0.103 |
0.587 |
0.133 |
P
angles. This suggests that we might look at c as a reaction coordinate. The
P i i
time evolution of i ci is plotted in Fig. 43, and the average value and standard deviation of the reaction coordinate indicators are given in Table XXXIII. The
|
2 |
|
indicators, d |
= |
D |
¼ |
0 |
: |
927 and |
average value of the reaction coordinate |
|
|
|
||||||
D |
|
=S ¼ 0:749, both indicate very strongly that |
Pi ci makes |
a good reaction |
|||||
|
|
2 |
|
|
|
|
|||
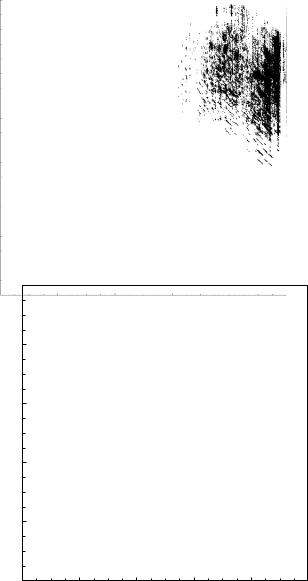
coordinate. To confirm this, we constructed a scatter plot of D =S vs. d=D for |
|||||||||
each of the 92,216 pathways, shown in Fig. 44. For most of the pathways, the |
|
reaction coordinate indicators are both near 1, further suggesting that |
Pi ci |
makes a good reaction coordinate. |
|
Further insight into the folding process may be gained by looking for a more physically significant reaction coordinate. An a-helix is stabilized by the formation of hydrogen bonds between the i and i þ 3 residues. Because these residues tend to be farthest apart in the extended conformation, and must be brought close together to form the hydrogen bond, it makes sense to use the hydrogen bonding distance as a reaction coordinate.
We first tried da1;a4 , the distance between the first and fourth a-carbons. This
distance is indicated in Fig. 45. This distance varies from |
˚ |
9:079 A in the |
|
˚ |
a-helical ground |
extended conformation to 4:998 A in the ground state. The |
|
˚ |
|
state is not the only conformation with da1;a4 < 5:0 A. Of the 526 minima |
|
involved in the 92,216 relevant pathways, 26 of them satisfy this inequality.