

Friesner R.A. (ed.) - Advances in chemical physics, computational methods for protein folding (2002)(en)
.pdfdetecting native protein folds among large decoy sets 477
|
250 |
|
|
|
|
|
|
|
|
|
200 |
|
|
Near-Native Conformers |
|
||||
|
|
|
|
Non-Native Conformers |
|
||||
|
|
|
|
|
|
||||
of Decoys |
150 |
|
|
|
|
|
|
|
|
100 |
|
|
|
|
|
|
|
|
|
50 |
|
|
|
|
vdW Energy UvdW |
|
|||
Number |
0 |
|
|
|
|
|
|
|
|
100 |
|
|
|
|
OPLS-AA/SGB |
|
|||
|
|
|
|
|
|
|
|
||
|
|
|
|
|
|
|
|
|
|
|
50 |
|
|
|
|
|
|
|
|
|
0 |
|
|
|
|
|
|
|
|
|
0 |
50 |
100 |
150 |
200 |
250 |
300 |
350 |
400 |
|
|
|
|
∆U (kcal/mol) |
|
|
|
||
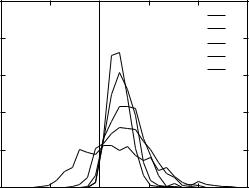
Figure 9. Near-native and non-native distributions of the OPLS-AA/SGB and van der Waals energy gaps from the native for the Park and Levitt 3icb decoys.
have a less favorable total electrostatic energy (intramolecular þ solvation) with respect to the native. The contribution of the solvation energy term, however, is large enough to reverse the sign of the energy gap for those decoys having an intramolecular energy more favorable than the native, for which there are many examples in the Park and Levitt set (see Fig. 11). The native state
|
500 |
|
|
|
|
|
|
|
250 |
|
|
|
|
|
|
(kcal/mol) |
0 |
|
|
|
|
|
|
|
|
|
|
|
|
|
|
SGB |
−250 |
|
|
|
|
|
|
∆U |
|
|
|
|
|
|
|
|
−500 |
|
|
|
|
|
|
|
−750 |
|
|
|
|
|
|
|
−500 |
−250 |
0 |
250 |
500 |
750 |
1000 |
|
|
|
∆U Coloumb (kcal/mol) |
|
|
||
Figure 10. Correlation plot between the intramolecular Coulomb energy gap UCoulomb and the solvation energy gap USGB for the 3icb decoys.
478 |
anders wallqvist et al. |
|
0.010 |
|
|
|
w = 1 |
|
|
|
|
|
|
|
|
|
0.008 |
|
|
|
w = 2 |
|
|
|
|
|
w = 4 |
|
|
|
|
|
|
|
w = 10 |
|
) |
0.006 |
|
|
|
w = 80 |
|
|
|
|
|
|
||
∆U |
|
|
|
|
|
|
P ( |
0.004 |
|
|
|
|
|
|
|
|
|
|
|
|
|
0.002 |
|
|
|
|
|
|
0.000 |
−250 |
|
|
|
|
|
−500 |
0 |
250 |
500 |
750 |
|
|
|
|
∆U (kcal/mol) |
|
|
|
Figure 11. The distributions of the screened Coulomb OPLS-AA energy gaps from the native for the 3icb decoys as a function of dielectric constant.
corresponds to a balance between optimizing the intramolecular Coulomb interactions and the intermolecular protein–solvent interactions.
Monge et al. [20] have also studied various energy decompositions of an allatom force field supplemented by a continuum solvation model. They analyzed a decoy data set generated by a simplified model employing a fixed, known secondary structure. The authors observe that the relative differences of both van der Waals and Coulomb energies are about 1–2% above the native values, but the total electrostatic component is the dominant factor in distinguishing non-native states from the native ones. They found that a fraction of the decoys had vdW energies lower than that of the native. Their model performed reasonably well, though some non-native conformations had better scores than the native state. This was not observed in the data sets we studied using the OPLS-AA/SGB scoring function.
E.Approximate Effective Dielectric Models
1.Screened Coulomb Approximation
As shown in Fig. 10, the solvation energy gaps with respect to the native are strongly correlated with the intramolecular Coulomb energy gaps. The equation
USGB ¼ a þ b UCoulomb |
ð9Þ |
can be fitted obtaining b ¼ 0:82 with a regression coefficient of 0:94. If we collate the total electrostatic interaction energy Uele as the sum of the Coulomb

detecting native protein folds among large decoy sets 479
and solvation energies, we find
Uele UCoulomb þ USGB 0:18 UCoulomb |
ð10Þ |
This suggests that it might be possible to employ a screened Coulomb model to account for solvation effects.
The screened Coulomb effective electrostatic interaction between two charges q a distance r apart is
UCoulombðrÞ |
¼ |
q2 |
ð |
11 |
Þ |
|
Ew |
Ewr |
|||||
|
The effect of the surrounding medium is accounted for by the value of Ew, usually taken as 80 for water. Figure 11 shows the energy distributions for the 3icb decoy set relative to the native state for the vacuum case and for various values of the effective dielectric constant. A good energy function should only produce energy gap values in the positive range. It is clear that for this decoy set, a simple electrostatic energy evaluation in vacuum (Ew ¼ 1) results in many decoy structures with energies substantially below the native values. Moreover, no correlation between the RMSD from the native and the energy is observed. Increasing the value of the effective dielectric constant removes some of the negative energy gaps and increases the propensity for the low-energy decoy structures to have low RMSD (not shown). None of the effective dielectric constants used, however, was able to differentiate all of the decoys from the native structure. This point is also illustrated in Fig. 2, which depicts the fraction of native-like structures with energy gaps from the native less than U using Ew ¼ 5:5 as suggested by the relation in Eq. (10). It is clear that the screened Coulomb scoring function provides less discrimination between decoys and native structures than does the SGB solvation model.
If a simple relationship between the reaction field energy calculated via the SGB model and the Coulomb energy as in Eq. (11) could be found, there would be no need to employ more complicated continuum models. Although the bulk of the correlation between these two terms can be explained by a screened Coulomb interaction, the discrimination between native and non-native states is degraded by such an approximation. The dispersion in the reaction field energy versus the Coulomb energy, which is not contained in the screened Coulomb model, provides a more detailed description of solvation effects which aids the discrimination of native-like conformations from misfolded ones.
Although the SGB solvation energy is correlated with the intramolecular Coulomb energy, it is not clear that the best values to use for an effective dielectric constant is given by Eq. (10). The fraction of native-like structures with energy gap less than a given energy difference calculated over all the data
480 |
anders wallqvist et al. |
|
100 |
|
|
|
|
|
Å |
|
|
|
|
w = 1.0 |
|
80 |
|
|
|
w = 5.5 |
|
|
<3.0 |
|
|
|
|
||
|
|
|
w = 80.0 |
|
||
|
|
|
|
|
||
|
|
|
|
w = 1.0r |
|
|
rms |
|
|
|
|
|
|
60 |
|
|
|
w = 5.5r |
|
|
with |
|
|
|
|
|
|
Structures |
40 |
|
|
|
|
|
20 |
|
|
|
|
|
|
%- |
|
|
|
|
|
|
|
0 |
|
|
|
|
|
|
0 |
100 |
200 |
300 |
400 |
500 |
|
|
|
∆U (kcal/mol) |
|
|
|
Figure 12. Fraction of the Park and Levitt decoys with energy gap from the native less than
˚
U which are native-like (RMSD from native < 3 A), using the vacuum OPLS-AA potential with screened Coulomb interactions.
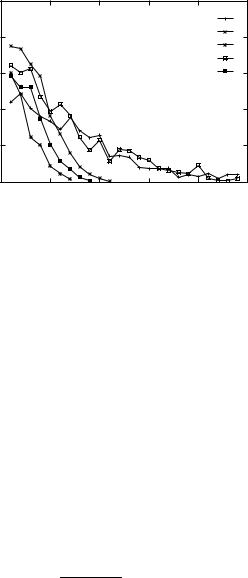
sets in Table I, reported in Fig. 12, shows the efficiency achieved using different values of Ew. None of the effective dielectric models achieves 100% discrimination for energy values within 20 kcal/mol of the native state energy. Using Ew ¼ 1 yields a broad range of energies for both native-like and non-native states as discussed above. In comparison, using a value of Ew either 5:5 or 80:0 yields distributions of energies that are like those given in Fig. 11 for the calbindin data set. The fraction of native-like structures with energies similar to the native state is around 60% for an effective dielectric constant of 80.0. This fraction increases to about 75% for an Ew value of 5.5.
2.Distance-Dependent Dielectric Approximation
An alternative to the simple screened Coulomb interaction in protein modeling is the distance-dependent dielectric function [51]. In this approximation the effective electrostatic interaction between two partial charges q at distance r is written as
UCoulombðrÞ |
¼ |
q2 |
ð |
12 |
Þ |
|
Ewr |
Ewr2 |
|||||
|
Although unphysical in nature, it has been suggested that the extra screening afforded by the 1=r2 function can capture some of the additional polarization effects contained in higher-level implicit solvent models [51]. By calculating
detecting native protein folds among large decoy sets 481
the energies of the decoy conformers in Table I using the distance-dependent dielectric approximation, we obtain energy distributions similar to those obtained using the simple screened Coulomb model. Moreover, as shown in Fig. 2, both effective dielectric models produce qualitatively similar results. For both values of Ew studied, 1.0 and 5.5, the fraction of native-like structures with energy similar to the native energy, is significantly less than 100%. Comparison between the distance-dependent dielectric and the non-distance- dependent dielectric function in Figs. 12 and 2 demonstrate that the distancedependent function is less discriminatory for the decoy data sets studied here. While the distance-dependent dielectric constant has been successfully employed in some cases [77], we find that, though it is better than the vacuum Coulomb potential, a simple non-distance-dependent screened Coulomb model is more effective (Fig. 12). None of the screened Coulomb models are as effective as the SGB solvation potential for the protein decoy data sets investigated here.
F.Dependence on the Interior Dielectric Constant
The SGB solvent model requires the separation of space into an exterior region containing the solvent medium and an interior region containing the protein charge distribution. In the current implementation of the SGB model, the van der Waals surface of the protein is used to define the dividing surface. The default value for the dielectric constant of the solvent is 80, corresponding to pure water at room temperature. Up to this point, the dielectric constant of the interior region, Ein, has been set at the value of 1, corresponding to the vacuum dielectric constant. We have also examined the cases Ein ¼ 2 and 5.5 to see whether the OPLS-AA/SGB results can be further improved. The energy components obtained for the native conformations contained in the Park and Levitt set are given in Table V. A larger interior dielectric constant results in a lower total energy of the system due to the increase of the dielectric shielding inside the protein. The Coulomb energy and the reaction field contributions are both reduced in an amount roughly proportional to the interior dielectric constant. The van der Waals energy partly compensates for the reduction in electrostatic energy, but the variation in UvdWnative is relatively small.
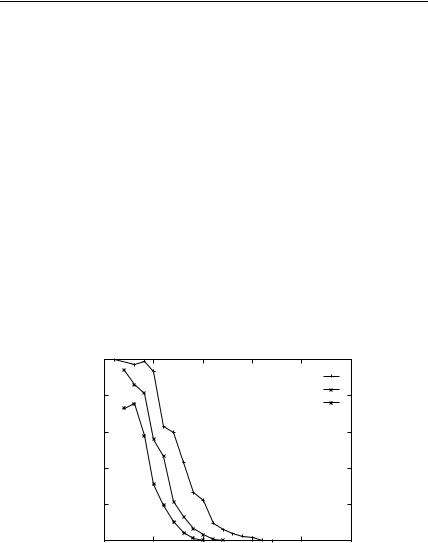
The fraction of native-like decoys of the Park and Levitt set as a function of energy gap is shown in Fig. 13 for the values of Ein examined. The number
˚
of native-like conformations (RMSD <3 A) with an energy score similar to the native increases as we decrease the dielectric constant of the interior region. It is only with an interior dielectric of 1.0 that all misfolded conformations can be eliminated based on energy alone. The discriminatory power of the OPLS-AA/SGB energy model in this fold recognition test is optimal for this choice of the internal dielectric, though it may not be optimal in other modeling contexts.
482 |
anders wallqvist et al. |
TABLE V
Selected Energy Components from Eqs. (1) and (2) for the Native State Using the Continuum Model ðEw ¼ 80:0Þ as a Function of Interior Dielectric Constant, Ein
|
|
Unative |
Unative |
Unative |
Unative |
Unative |
|
|
total |
vdW |
Coulomb |
SGB |
cav |
PDB |
Ein |
(kcal/mol) |
(kcal/mol) |
(kcal/mol) |
(kcal/mol) |
(kcal/mol) |
1ctf |
1.0 |
4213.9 |
475.5 |
5340.3 |
1367.6 |
þ 37.9 |
|
2.0 |
2065.9 |
519.7 |
2595.2 |
688.3 |
þ 38.4 |
|
5.5 |
730.6 |
532.8 |
925.5 |
244.0 |
þ 38.7 |
1r69 |
1.0 |
3499.5 |
497.2 |
3722.9 |
1168.9 |
þ 37.2 |
|
2.0 |
1709.9 |
539.0 |
1781.7 |
593.3 |
þ 37.7 |
|
5.5 |
599.5 |
554.3 |
627.9 |
210.8 |
þ 38.1 |
1sn3 |
1.0 |
3467.5 |
465.1 |
4784.2 |
972.8 |
þ 36.3 |
|
2.0 |
1688.1 |
499.8 |
2315.2 |
500.3 |
þ 36.8 |
|
5.5 |
585.3 |
511.8 |
821.5 |
180.1 |
þ 37.1 |
2cro |
1.0 |
3628.3 |
522.4 |
3514.8 |
1462.2 |
þ 40.4 |
|
2.0 |
1763.1 |
567.2 |
1662.8 |
749.7 |
þ 41.0 |
|
5.5 |
604.8 |
578.9 |
585.2 |
264.8 |
þ 41.4 |
3icb |
1.0 |
4694.5 |
587.3 |
5163.5 |
2350.6 |
þ 45.4 |
|
2.0 |
2271.4 |
641.0 |
2466.5 |
1195.6 |
þ 46.1 |
|
5.5 |
766.8 |
656.8 |
865.7 |
427.2 |
þ 46.4 |
4pti |
1.0 |
3055.0 |
423.9 |
2542.0 |
1366.9 |
þ 34.1 |
|
2.0 |
1464.2 |
448.4 |
1208.6 |
686.6 |
þ 34.6 |
|
5.5 |
473.2 |
455.1 |
425.0 |
240.9 |
þ 34.8 |
4rxn |
1.0 |
3363.5 |
373.6 |
2496.6 |
2791.5 |
þ 31.3 |
|
2.0 |
1598.8 |
399.3 |
1190.1 |
1389.9 |
þ 31.6 |
|
5.5 |
498.1 |
407.6 |
410.9 |
489.1 |
þ 31.8 |
|
100 |
|
|
|
|
|
Å |
|
|
|
|
in = 1.0 |
|
|
|
|
|
in = 2.0 |
|
|
<3.0 |
80 |
|
|
|
|
|
|
|
|
in = 5.5 |
|
||
|
|
|
|
|
||
rms |
60 |
|
|
|
|
|
with |
|
|
|
|
|
|
|
|
|
|
|
|
|
-Structures |
40 |
|
|
|
|
|
20 |
|
|
|
|
|
|
% |
|
|
|
|
|
|
|
|
|
|
|
|
|
|
0 |
|
|
|
|
|
|
0 |
100 |
200 |
300 |
400 |
500 |
|
|
|
∆U (kcal/mol) |
|
|
|
Figure 13. Fraction of the Park and Levitt decoys with energy gap from the native less than
˚
U which are native-like (RMSD from native < 3 A), using the OPLS-AA/SGB potential with various values of the interior dielectric constant.
detecting native protein folds among large decoy sets 483
IV. CONCLUSIONS
The OPLS-AA molecular mechanics energy function coupled with the surface generalized Born solvation model is found to be able to discriminate the native structures of several proteins from their decoys. The results show that for a number of cleverly constructed decoys the OPLS-AA/SGB scoring function correctly singles out native-like states from the bulk of the non-native conformations. Not all of the native-like structures were clearly separated in the data sets; indeed some distant non-native conformations score better than some native-
˚
like (RMSD <3 A) conformations. This suggests that if the current scoring method is to be applied to a set of ab initio generated structures, it is critical that the algorithm for constructing native-like structures be such that a broad range of the relevant parts of the native-like conformational space are sampled.
The ability of the OPLS-AA/SGB model to recognize native conformations is found to be comparable, and in many cases superior, to the best knowledgebased scoring functions. Other studies have shown the usefulness of molecular mechanics force fields augmented by implicit solvation models in this area [6]. Lazaridis and Karplus [22] have shown that the CHARMM protein force field combined with their EEF1 effective solvation free energy model [78] is able to achieve 100% discrimination of the native conformations in a large decoy data set and in the single decoy data set they examined. They also observe, in agreement with our findings, that significantly poorer results are obtained by omitting the solvation free energy term. They obtain these results despite the use of a computationally fast solvation model which has the form of an effective pair potential and is simpler than the SGB solvation model. Recently, Petrey and Honig [79] have applied the CHARMM protein force field, together with a dielectric continuum model based on the Poisson–Boltzmann equation, to the problem of native fold recognition in the single decoy data set [17] (also examined in this work) achieving a discrimination level close to 100%. They also applied a simplified solvation model containing only the intramolecular electrostatic energy and a hydrophobic residue burial estimator to evaluate the Park and Levitt decoy sets. In two cases (3icb and 4rxn) their method does not clearly rank the X-ray conformation favorably. Petrey and Honig observe that the solvation energy often favors the misfolded conformation in the singledecoy sets, concluding that the solvation energy is not useful in recognizing the native conformation. However, even though the solvation energy generally favors misfolded conformations, these structures tend to be disfavored relative to the native conformation when the total electrostatic energy (sum of the direct Coulomb and solvation term) is considered. In contrast, the SGB solvation term is essential for destabilizing the relatively large number of Park and Levitt decoys for which the direct Coulomb energy is more favorable than the corresponding value for the native.
484 |
anders wallqvist et al. |
The OPLS-AA/SGB scoring function was also compared with the screened Coulomb OPLS-AA scoring function. Whereas a significant fraction of the decoys with scores within 100 kcal/mol from the native are misfolded using a screened Coulomb potential, essentially all of the decoys within 100 kcal/mol from the native are native-like using the OPLS-AA/SGB scoring function.
The ability to discriminate native-like protein conformations from non-native conformations is one of the fundamental problems in theoretical protein structure prediction. The use of knowledge-based scoring potentials, derived from a combination of structural and thermodynamic data, is currently the most widely used method. It is often assumed that such models are inherently better than all-atom force fields. This work shows the importance of correctly modeling the physical forces underlying protein folding. Thanks to their simplicity, knowledge-based scoring schemes are less costly to evaluate compared to all-atom models. In the future it should be possible to combine the best features of the two approaches to rapidly generate plausible protein conformations using knowledge-based potentials more reliably, and then discriminate between conformers using all-atom scoring functions.
Acknowledgments
This project has been supported by the National Institutes of Health Grant GM-30580, the Center for Biomolecular Simulations at Columbia University, and the High Performance Computing Project at Rutgers University. The authors thank Dr. Lynne Reed Murphy for help with some of the calculations.
References
1.S. J. Wodak and M. J. Rooman, Curr. Opin. Struct. Biol. 3, 247–259 (1993).
2.D. T. Jones and J. M. Thornton, Curr. Opin. Struct. Biol. 6, 210–216 (1996).
3.K. W. Plaxco, D. S. Riddle, V. Grantcharova, and D. Baker, Curr. Opin. Struct. Biol. 8, 80–85 (1988).
4.M. Hao and H. A. Scheraga, Curr. Opin. Struct. Biol. 9, 184–188 (1999).
5.D. J. Osguthorpe, Curr. Opin. Struct. Biol. 10, 146–152 (2000).
6.T. Lazaridis and M. Karplus, Curr. Opin. Struct. Biol. 10, 139–145 (2000).
7.V. Eyrich, D. Standley, A. Felts, and R. Friesner, Proteins 35, 41–57 (1999).
8.S. W. Rick and B. J. Berne, J. Am. Chem. Soc. 116, 3949–3954 (1994).
9.R. M. Levy and E. Gallicchio, Annu. Rev. Phys. Chem. 49, 531–567 (1998).
10.A. A. Rashin and M. A. Bukatin, J. Phys. Chem. 98, 386–389 (1994).
11.D. Sitkoff, K. A. Sharp, and B. Honig, J. Phys. Chem. 98, 1978–1988 (1994).
12.D. J. Tannor, B. Marten, R. Murphy, R. A. Friesner, D. Sitkoff, A. Nicholls, M. Ringnalda, W. A. Goddard III, and B. Honig, J. Am. Chem. Soc. 116, 11875–11882 (1994).
13.D. Sitkoff, N. Ben-Tal, and B. Honig, J. Phys. Chem. 100, 2744–2752 (1996).
14.G. Hawkins, C. Cramer, and D. Truhlar, J. Phys. Chem. 100, 19824–19839 (1996).
15.E. Gallicchio, L. Zhang, and R. M. Levy, submitted (2001).
16.D. Eisenberg and A. D. McLachlan, Nature 319, 199–203 (1986).
detecting native protein folds among large decoy sets 485
17.L. Holm and C. Sander, J. Mol. Biol. 225, 93–105 (1992).
18.W. F. van Gunsteren, F. J. Luque, D. Timms, and A. E. Torda, Annu. Rev. Biophys. Biomol. Struct. 23, 847–863 (1994).
19.P. E. Smith and B. M. Pettitt, J. Phys. Chem. 98, 9700–9711 (1998).
20.A. Monge, E. J. P. Lathrop, J. R. Gunn, P. S. Shenkin, and R. A. Friesner, J. Mol. Biol. 247, 995–1012 (1995).
21.M. Schaefer, H. W. van Vlijmen, and M. Karplus, Adv. Protein Chem. 51, 1–57 (1998).
22.T. Lazaridis and M. Karplus, J. Mol. Biol. 288, 477–487 (1999).
23.Y. N. Vorobjev and J. Hermans, Biophys. Chem. 78, 195–205 (1999).
24.M. K. Gilson and B. Honig, Proteins Struct., Funct., Genet. 4, 7–18 (1988).
25.D. Bashford and M. Karplus, Biochemistry 29, 10219–10225 (1990).
26.A. A. Rashin, J. Phys. Chem. 94, 1725–1733 (1990).
27.K. A. Sharp and B.Honig, Annu. Rev. Biophys. Chem. 19, 301–332 (1990).
˚
28. A. Warshel and J. Aqvist, Annu. Rev. Biophys. Chem. 20, 267–298 (1991).
29. M. K. Gilson, M. E. Davis, B. A. Luty, and J. A. McCammon, J. Phys. Chem. 97, 3591–3600 (1993).
30. B. Honig, K. Sharp, and A.-S. Yang, J. Phys. Chem. 97, 1101–1109 (1993).
31. V. Mohan, M. E. Davis, J. A. McCammon, and B. M. Pettitt, J. Phys. Chem. 96, 6428–6431 (1992).
32. T. Simonson and A. T. Bru¨nger, J. Phys. Chem. 98, 4683–4694 (1994).
¨
33. K. Osapay, W. S. Young, D. Bashford, C. L. Brooks III, and D. A. Case, J. Phys. Chem. 100, 2698–2705 (1996).
34. S. R. Edinger, C. Cortis, P. S. Shenkin, and R. A. Friesner, J. Phys. Chem. B 101, 1190–1197 (1997).
35. M. Born, Z. Physik 1, 45–48 (1920).
36. F. Hirata, P. Rejfern, and R. Levy, J. Quantum Chem. 15, 179–188 (1988).
37. W. C. Still, A. Tempczyk, R. C. Hawley, and T. Hendrickson, J. Am. Chem. Soc. 112, 6127– 6129 (1990).
38. A. Jean-Charles, A. Nichols, K. Sharp, B. Honing, A. Tempczyk, T. F. Hendrickson, and W. C. Still, J. Am. Chem. Soc. 113, 1454–1455 (1991).
39. D. Qiu, P. S. Shenkin, F. P. Hollinger, and W. C. Still, J. Phys. Chem. A 101, 3005–3014 (1997). 40. A. Ghosh, C. S. Rapp, and R. A. Friesner, J. Phys. Chem. B 102, 10983–10990 (1998). 41. B. Roux and T. Simonson, Biophys. Chem. 78, 1–20 (1999).
42. L. Zhang, E. Gallicchio, R. Friesner, and R. M. Levy, J. Comp. Chem. 22, 591–607 (2001). 43. J. Novotny, R. Bruccoleri, and M. Karplus, J. Mol. Biol. 177, 787–818 (1984).
44. J. Novotny, A. A. Rashin, and R. Bruccoleri, Proteins Struct. Funct. Genet. 4, 19–30 (1988). 45. L. Chiche, L. M. Gregoret, F. E. Cohen, and P. A. Kollman, Proc. Natl. Acad. Sci. USA 87,
3240–3243 (1990).
46. J. Vila, R. L. Williams, M. Vasquez, and H. A. Scheraga, Proteins Struct. Funct. Genet. 10, 199–218 (1991).
47. R. L. Williams, J. Vila, G. Perrot, and H. A. Scheraga, Proteins Struct. Funct. Genet. 14, 110– 119 (1992).
48. Y. Wang, H. Zhang, W. Li, and R. A. Scott, Proc. Natl. Acad. Sci. USA 92, 709–713 (1995). 49. Y. Wang, H. Zhang, and R. A. Scott, Protein Sci. 4, 1402–1411 (1995).
486 |
anders wallqvist et al. |
50.M. Vieth, A. Kolinski, C. L. Brooks III, and J. Skolnick, J. Mol. Biol. 237, 361–367 (1994).
51.S. J. Weiner, P. A. Kollman, D. A. Case, U. C. Singh, C. Ghio, G. Alagone, S. Profeta, and
P.Weiner, J. Am. Chem. Soc. 106, 765–784 (1984).
52.Y. N. Vorobjev, J. C. Almagro, and J. Hermans, Proteins Struct. Funct. Genet. 32, 399–413 (1998).
53.M. Hendlich, P. Lackner, S. Weitckus, H. Floeckner, R. Froschauer, K. Gottsbacher, G. Casari, and M. J. Sippl, J. Mol. Biol. 216, 167–180 (1990).
54.M. J. Sippl, Curr. Opin. Struct. Biol. 5, 229–235 (1995).
55.R. L. Jernigan and I. Bahar, Curr. Opin. Struct. Biol. 6, 195–209 (1996).
56.S. Miyazawa and R. J. Jernigan, J. Mol. Biol. 256, 623–644 (1996).
57.A. Wallqvist, G. W. Smythers, and D. G. Covell, Protein Sci. 6, 1627–1642 (1997).
58.S. Miyazawa and R. L. Jernigan, Proteins Struct. Funct. Genet. 36, 357–369 (1999).
59.D. Covell and R. Jernigan, Biochemistry 29, 3287–3294 (1990).
60.B. Park and M. Levitt, J. Mol. Biol. 258, 367–392 (1996).
61.B. Ozkan and I. Bahar, Proteins Struct. Funct., Genet. 32, 211–222 (1998).
62.R. Samudrala and J. Moult, J. Mol. Biol. 275, 895–916 (1998).
63.K. T. Simons, I. Ruczinski, C. Kooperberg, B. A. Fox, C. Bystroff, and D. Baker, Proteins Struct. Funct. and Genet. 34, 82–95 (1999).
64.W. L. Jorgensen, D. S. Maxwell, and J. Tirado-Rives, J. Am. Chem. Soc. 118, 11225–11236 (1996).
65.E. S. Huang, S. Subbiah, J. Tsai, and M. Levitt, J. Mol. Biol. 257, 716–725 (1996).
66.B. H. Park, E. S. Huang, and M. Levitt, J. Mol. Biol. 266, 831–846 (1997).
67.J. Moult, T. Hubbard, K. Fidelis, and J. T. Pedersen, Proteins Struct. Funct. Genet. Suppl. 3, 2–6 (1999).
68.D. B. Kitchen, F. Hirata, J. D. Westbrook, R. Levy, D. Kofke, and M. Yarmush, J. Comp. Chem. 11, 1169–1180 (1990).
69.E. E. Abola, F. C. Bernstein, S. H. Bryant, T. F. Koetzle, and J. Weng, Protein data bank, in
Crystallographic Databases—Information Content, Software Systems, Scientific Applications,
F.H. Allen, G. Bergerhoff, and R. Sievers, eds., Data Commission of the International Union of Crystallography, Bonn/Cambridge/Chester, 1987.
70.L. Zhang, E. Gallicchio, and R. M. Levy, Implicit solvent models for protein–ligand binding: Insights based on explicit solvent simulations, in Simulation and Theory of Electrostatic Interactions in Solution, AIP Conference Proceedings 492, L. R. Pratt and G. Hummer, eds., American Institute of Physics, New York, 1999.
71.M. Levitt, J. Mol. Biol. 226, 507–533 (1992).
72.R. Samudrala, Y. Xia, M. Levitt, and E. S. Huang, Proc. Pacific Symp. Biocomput. 4, 505–516 (1999).
73.D. A. Hinds and M. Levitt, Proc. Natl. Acad. Sci. USA 89, 2536–2540 (1992).
74.D. A. Hinds and M. Levitt, J. Mol. Biol. 243, 668–682 (1994).
75.K. A. Dill, Biochemistry 29, 7133–7155 (1990).
76.K. A. Dill, Curr. Opin. Struct. Biol. 3, 99–103 (1993).
77.M. Schaefer, C. Bartels, and M. Karplus, Theor. Chem. Acc. 101, 194–204 (1998).
78.T. Lazaridis and M. Karplus, Proteins 35, 133–152 (1999).
79.D. Petrey and B. Honig, Protein Sci. 9, 2181–2191 (2000).