

Biomechanics Principles and Applications - Donald R. Peterson & Joseph D. Bronzino
.pdf3-12 |
|
Biomechanics |
Lateral |
Posterior |
Medial |
Nonsymmetrical optimal axis |
Screw axis |
Symmetrical optimal axis |
FIGURE 3.11 Approximate location of the optimal axis (case 1 — nonsymmetric, case 3 — symmetric), and the screw axis (case 2) on the medial and lateral condyles of the femur of a human subject for the range of motion of 0 to 90◦ flexion (standing to sitting, respectively). (From Lewis J.L. and Lew W.D. 1978. J. Biomech. Eng. 100: 187. With permission.)
0°
40°
 80°
80°
120°
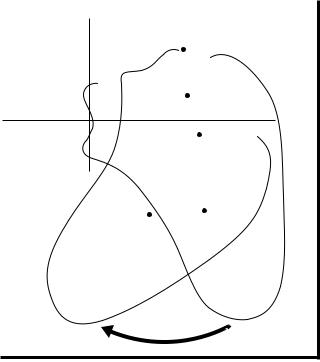
FIGURE 3.12 Position of patellar ligament, patella, and quadriceps tendon and location of the contact points as a function of the knee flexion angle. (From van Eijden T.M.G.J., Kouwenhoven E., Verburg J. et al. J. Biomech. 19: 227.)
|
|
|
|
|
|
Rolling |
|
|
|
|
|
|
|
|
|
|
|
|
|
|
|
|
|
|
|
|
|
|
|
|
|
|
|
|
|
|
|
|
|
|||||||
|
|
|
|
|
|
|
|
|
|
|
|
|
|
|
|
|
|
|
|
|
|
|
|
|
|
|
|
|
|
|
|
|
|
|
|
|||||||||||
0.4 |
|
|
|
|
|
Gliding |
|
|
|
|
|
|
|
|
|
|
|
|
|
|
|
|
|
|
|
|
|
|
|
|
|
|
|
|
|
|
|
|
|
|||||||
|
|
|
|
|
|
|
|
|
|
|
|
|
|
|
|
|
|
|
|
|
|
|
|
|
|
|
|
|
|
|
|
|
|
|||||||||||||
|
|
|
|
|
|
|
|
|
|
|
|
|
|
|
|
|
|
|
|
|
|
|
|
|
|
|
|
|
|
|
|
|
|
|
|
|
|
|
|
|
|
|
|
|
|
|
|
|
|
|
|
|
|
|
|
|
|
|
|
|
|
|
|
|
|
|
|
|
|
|
|
|
|
|
|
|
|
|
|
|
|
|
|
|
|
|
|
|
|
|
|
|
|
0.2 |
|
|
|
|
|
|
|
|
|
|
|
|
|
|
|
|
|
|
|
|
|
|
|
|
|
|
|
|
|
|
|
|
|
|
|
|
|
|
|
|
|
|
|
|
|
|
|
|
|
|
|
|
|
|
|
|
|
|
|
|
|
|
|
|
|
|
|
|
|
|
|
|
|
|
|
|
|
|
|
|
|
|
|
|
|
|
|
|
|
|
|
|
|
|
|
|
|
|
|
|
|
|
|
|
|
|
|
|
|
|
|
|
|
|
|
|
|
|
|
|
|
|
|
|
|
|
|
|
|
|
|
|
|
|
|
|
|
|
|
|
|
|
|
|
|
|
|
|
|
|
|
|
|
|
|
|
|
|
|
|
|
|
|
|
|
|
|
|
|
|
|
|
|
|
|
|
|
|
|
|
|
|
|
|
|
|
|
|
|
|
|
|
|
|
|
|
|
|
|
|
|
|
|
|
|
|
|
|
|
|
|
|
|
|
|
|
|
|
|
|
|
|
|
|
|
|
|
|
|
|
|
|
|
|
0 |
|
|
|
|
|
|
|
|
|
|
|
|
|
|
|
|
|
|
|
|
|
|
|
|
|
|
|
|
|
|
|
|
|
|
|
|
|
|
|
|
|
|
|
|
|
|
|
|
|
|
|
|
|
|
|
|
|
|
|
|
|
|
|
|
|
|
|
|
|
|
|
|
|
|
|
|
|
|
|
|
|
|
|
|
|
|
|
|
|
|
|
|
|
|
|
|
|
|
|
|
|
|
|
|
|
|
|
|
|
|
|
|
|
|
|
|
|
|
|
|
|
|
|
|
|
|
|
|
|
|
|
|
|
|
|
|
|
|
|
|
–0.2 |
|
20 |
|
|
|
40 |
|
|
|
60 |
|
|
|
|
80 |
|
|
|
|
100 |
|
120 |
||||||||||||||||||||||||
|
|
|
|
|
|
|
|
|
|
|
|
|
|
|
|
|
|
|
|
|
|
|
|
|
|
|
|
|
|
|
|
|
|
|
Angle of flexion |
|||||||||||
|
|
|
|
|
|
|
|
|
|
|
|
|
|
|
|
|
|
|
|
|
|
|
|
|
|
|
|
|
|
|
|
|
|
|
|
|||||||||||
–0.4 |
|
|
|
|
|
|
|
|
|
|
|
|
|
|
|
|
|
|
|
|
|
|
|
|
|
|
|
|
|
|
|
|
|
|
|
|
|
|
|
|
|
|
|
|
|
|
–0.6 |
|
|
|
|
|
|
|
|
|
|
|
|
|
|
|
|
|
|
|
|
|
|
|
|
|
|
|
|
|
|
|
|
|
|
|
|
|
|
|
|
|
|
|
|
|
|
|
|
|
|
|
|
|
|
|
|
|
|
|
|
|
|
|
|
|
|
|
|
|
|
|
|
|
|
|
|
|
|
|
|
|
|
|
|
|
|
|
|
|
|
|
||
|
|
|
|
|
|
|
|
|
|
|
|
|
|
|
|
|
|
|
|
|
|
|
|
|
|
|
|
|
|
|
|
|
|
|
|
|
|
|
|
|
|
|
|
|
|
|
FIGURE 3.13 Calculated rolling/gliding ratio for the patellofemoral joint as a function of the knee flexion angle. (From van Eijden T.M.G.J., Kouwenhoven E., Verburg J. et al. J. Biomech. 19: 226.)

Joint-Articulating Surface Motion |
3-13 |
120◦ (Figure 3.12). The mean amount of patellar gliding for all knees is approximately 6.5 mm per 10◦ of flexion between 0 and 80◦ and 4.5 mm per 10◦ of flexion between 80 and 120◦. The relationship between the angle of flexion and the mean rolling/gliding ratio for all knees is shown in Figure 3.13. Between 80 and 90◦ of knee flexion, the rolling motion of the articulating surface comes to a standstill and then changes direction. The reversal in movement occurs at the flexion angle where the quadriceps tendon first contacts the femoral groove.
3.3 Hip
The hip joint is composed of the head of the femur and the acetabulum of the pelvis. The hip joint is one of the most stable joints in the body. The stability is provided by the rigid ball-and-socket configuration.
3.3.1 Geometry of the Articulating Surfaces
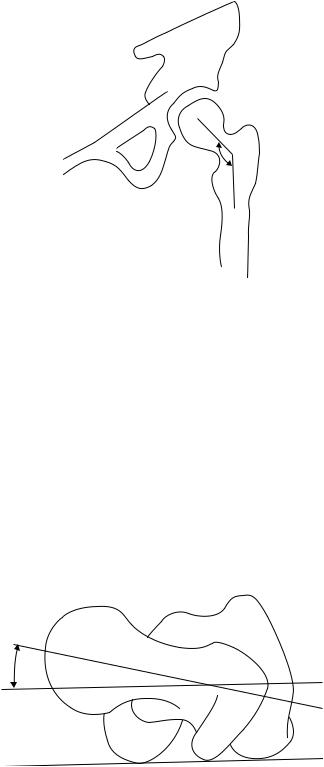
The femoral head is spherical in its articular portion that forms two thirds of a sphere. The diameter of the femoral head is smaller for females than for males (Table 3.11). In the normal hip, the center of the femoral head coincides exactly with the center of the acetabulum. The rounded part of the femoral head is spheroidal rather than spherical because the uppermost part is flattened slightly. This causes the load to be distributed in a ringlike pattern around the superior pole. The geometrical center of the femoral head is traversed by the three axes of the joint, the horizontal axis, the vertical axis, and the anterior/posterior axis. The head is supported by the neck of the femur, which joins the shaft. The axis of the femoral neck is obliquely set and runs superiorly, medially, and anteriorly. The angle of inclination of the femoral neck to the shaft in the frontal plane is the neck-shaft angle (Figure 3.14). In most adults, this angle is about 130◦ (Table 3.11). An angle exceeding 130◦ is known as coxa valga; an angle less than 130◦ is known as coxa vara. The femoral neck forms an acute angle with the transverse axis of the femoral condyles. This angle faces medially and anteriorly and is called the angle of anteversion (Figure 3.15). In the adult, this angle averages about 7.5◦ (Table 3.11).
The acetabulum receives the femoral head and lies on the lateral aspect of the hip. The acetabulum of the adult is a hemispherical socket. Its cartilage area is approximately 16 cm2 [Von Lanz and Wauchsmuth, 1938]. Together with the labrum, the acetabulum covers slightly more than 50% of the femoral head [Tonnis,¨ 1987]. Only the sides of the acetabulum are lined by articular cartilage, which is interrupted inferiorly by the deep acetabular notch. The central part of the cavity is deeper than the articular cartilage and is nonarticular. This part is called the acetabular fossae and is separated from the interface of the pelvic bone by a thin plate of bone.
3.3.2 Joint Contact
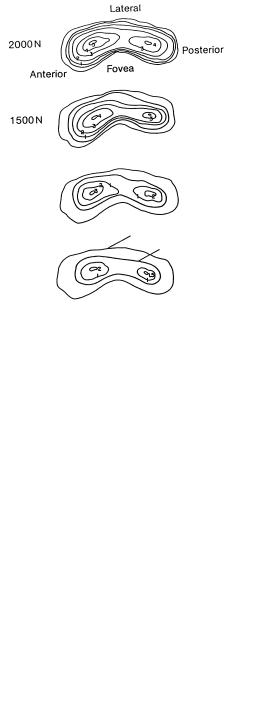
Miyanaga et al. [1984] studied the deformation of the hip joint under loading, the contact area between the articular surfaces, and the contact pressures. They found that at loads up to 1000 N, pressure was distributed largely to the anterior and posterior parts of the lunate surface with very little pressure applied to the central portion of the roof itself. As the load increased, the contact area enlarged to include the outer
TABLE 3.11 Geometry of the Proximal Femur
Parameter |
Females |
Males |
||
|
|
|
|
|
Femoral head diameter (mm) |
45.0 |
± 3.0 |
52.0 |
± 3.3 |
Neck shaft angle (deg) |
133 |
± 6.6 |
129 |
± 7.3 |
Anteversion (deg) |
8 |
± 10 |
7.0 |
± 6.8 |
Source: Yoshioka Y., Siu D., and Cooke T.D.V. 1987. J. Bone
Joint Surg. 69A: 873.
3-14 |
Biomechanics |
130°
FIGURE 3.14 The neck-shaft angle.
and inner edges of the lunate surface (Figure 3.16). However, the highest pressures were still measured anteriorly and posteriorly. Of five hip joints studied, only one had a pressure maximum at the zenith or central part of the acetabulum.
Davy et al. [1989] utilized a telemetered total hip prosthesis to measure forces across the hip after total hip arthroplasty. The orientation of the resultant joint contact force varies over a relatively limited range during the weight-load-bearing portions of gait. Generally, the joint contact force on the ball of the hip prosthesis is located in the anterior/superior region. A three-dimensional plot of the resultant joint force during the gait cycle, with crutches, is shown in Figure 3.17.
3.3.3 Axes of Rotation
The human hip is a modified spherical (ball-and-socket) joint. Thus, the hip possesses three degrees of freedom of motion with three correspondingly arranged, mutually perpendicular axes that intersect at
FIGURE 3.15 The normal anteversion angle formed by a line tangent to the femoral condyles and the femoral neck axis, as displayed in the superior view.
Joint-Articulating Surface Motion |
3-15 |
||||||||||
|
|
|
|
|
|
|
|
|
|
|
|
|
|
|
|
|
|
|
Lateral |
||||
|
|
|
|
|
|
|
|
|
|
|
|
|
2000 N |
|
|
|
|
|
|
|
|||
|
|
|
|
|
|
|
Posterior |
|
|||
|
|
|
|
|
|
|
|
|
|
|
|
|
|
|
|
|
|
|
|
|
|
|
|
|
|
|
|
|
|
|
|
|
|
|
|
|
|
|
|
|
|
Fovea |
|
|
|
|
|
|
|
|
Anterior |
||||||||
|
|
|
|
|
|
|
|
|
|
||
|
|
|
|
|
|
|
|
|
|
|
|
|
|
|
|
|
|
|
|
|
|
|
|
|
|
1500 N |
|
|
|
|
|
|
|
|
|
|
|
|
|
|
|
|
|
|
|
|
|
1000 N
Edge of cartilage
Edge of contact area
500 N
FIGURE 3.16 Pressure distribution and contact area of hip joint. The pressure is distributed largely to the anterior and posterior parts of the lunate surface. As the load increased, the contact area increased. (From Miyanaga Y., Fukubayashi T., and Kurosawa H. 1984. Arch. Orth. Trauma Surg. 103: 13. With permission.)
FIGURE 3.17 Scaled three-dimensional plot of resultant force during the gait cycle with crutches. The lengths of the lines indicate the magnitude of force. Radial line segments are drawn at equal increments of time, so the distance between the segments indicates the rate at which the orientation of the force was changing. For higher amplitudes of force during stance phase, line segments in close proximity indicate that the orientation of the force was changing relatively little with the cone angle between 30 and 40◦ and the polar angle between −25 and −15◦ . (From Davy D.T., Kotzar D.M., Brown R.H. et al. 1989. J. Bone Joint Surg. 70A: 45. With permission.)

3-16 |
Biomechanics |
the geometric center of rotation of the spherical head. The transverse axis lies in the frontal plane and controls movements of flexion and extension. An anterior/posterior axis lies in the sagittal plane and controls movements of adduction and abduction. A vertical axis that coincides with the long axis of the limb when the hip joint is in the neutral position controls movements of internal and external rotation. Surface motion in the hip joint can be considered as spinning of the femoral head on the acetabulum. The pivoting of the bone socket in three planes around the center of rotation in the femoral head produces the spinning of the joint surfaces.
3.4 Shoulder
The shoulder represents the group of structures connecting the arm to the thorax. The combined movements of four distinct articulations — glenohumeral, acromioclavicular, sternoclavicular, and scapulothoracic — allow the arm to be positioned in space.
3.4.1 Geometry of the Articulating Surfaces
The articular surface of the humerus is approximately one-third of a sphere (Figure 3.18). The articular surface is oriented with an upward tilt of approximately 45◦ and is retroverted approximately 30◦ with respect to the condylar line of the distal humerus [Morrey and An, 1990]. The average radius of curvature of the humeral head in the coronal plane is 24.0 ± 2.1 mm [Iannotti et al., 1992]. The radius of curvature in the anteroposterior and axillary-lateral view is similar, measuring 13.1 ± 1.3 and 22.9 ± 2.9 mm, respectively [McPherson et al., 1997]. The humeral articulating surface is spherical in the center. However, the peripheral radius is 2 mm less in the axial plane than in the coronal plane. Thus the peripheral contour of the articular surface is elliptical with a ratio of 0.92 [Iannotti et al., 1992]. The major axis is superior to inferior and the minor axis is anterior to posterior [McPherson et al., 1997]. More recently, the threedimensional geometry of the proximal humerus has been studied extensively. The articular surface, which is part of a sphere, varies individually in its orientation with respect to inclination and retroversion, and it has variable medial and posterior offsets [Boileau and Walch, 1997]. These findings have great impact in implant design and placement in order to restore soft-tissue function.
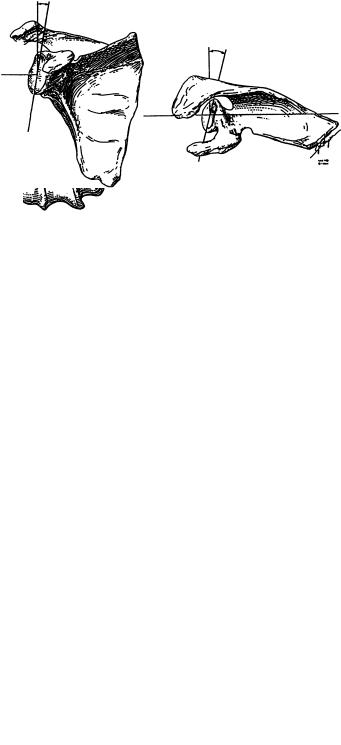
The glenoid fossa consists of a small, pear-shaped, cartilage-covered bony depression that measures 39.0 ± 3.5 mm in the superior/inferior direction and 29.0 ± 3.2 mm in the anterior/posterior direction [Iannotti et al., 1992]. The anterior/posterior dimension of the glenoid is pear-shaped with the lower half being larger than the top half. The ratio of the lower half to the top half is 1 : 0.80 ± 0.01 [Iannotti et al., 1992]. The glenoid radius of curvature is 32.2 ± 7.6 mm in the anteroposterior view and 40.6 ± 14.0 mm in the axillary–lateral view [McPherson et al., 1997]. The glenoid is therefore more curved superior to inferior (coronal plane) and relatively flatter in an anterior to posterior direction (sagittal plane). Glenoid depth is 5.0 ± 1.1 mm in the anteroposterior view and 2.9 ± 1.0 mm in the axillary–lateral [McPherson et al., 1997], again confirming that the glenoid is more curved superior to inferior. In the coronal plane the articular surface of the glenoid comprises an arc of approximately 75◦ and in the transverse plane the arc of curvature of the glenoid is about 50◦ [Morrey and An, 1990]. The glenoid has a slight upward tilt of about 5◦ [Basmajian and Bazant, 1959] with respect to the medial border of the scapula (Figure 3.19) and is retroverted a mean of approximately 7◦ [Saha, 1971]. The relationship of the dimension of the humeral head to the glenoid head is approximately 0.8 in the coronal plane and 0.6 in the horizontal or transverse plane [Saha, 1971]. The surface area of the glenoid fossa is only one-third to one-fourth that of the humeral head [Kent, 1971]. The arcs of articular cartilage on the humeral head and glenoid in the frontal and axial planes were measured [Jobe and Iannotti, 1995]. In the coronal plane, the humeral heads had an arc of 159◦ covered by 96◦ of glenoid, leaving 63◦ of cartilage uncovered. In the transverse plane, the humeral arc of 160◦ is opposed by 74◦ of glenoid, leaving 86◦ uncovered.
Joint-Articulating Surface Motion |
3-17 |
30–40°
45°
FIGURE 3.18 The two-dimensional orientation of the articular surface of the humerus with respect to the bicondylar axis. By permission of Mayo Foundation.
3.4.2 Joint Contact
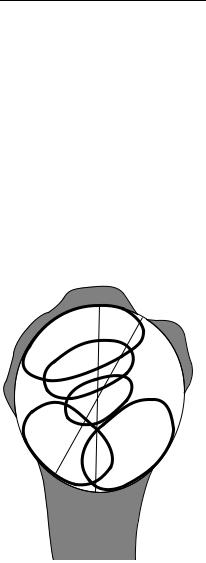
The degree of conformity and constraint between the humeral head and glenoid has been represented by conformity index (radius of head/radius of glenoid) and constraint index (arc of enclosure/360) [McPherson, 1997]. Based on the study of 93 cadaveric specimens, the mean conformity index was 0.72 in the coronal and 0.63 in the sagittal plane. There was more constraint to the glenoid in the coronal vs. sagittal plane (0.18 vs. 0.13). These anatomic features help prevent superior–inferior translation of the humeral head but allow translation in the sagittal plane. Joint contact areas of the glenohumeral joint tend to be greater at mid-elevation positions than at either of the extremes of joint position (Table 3.12). These results suggest that the glenohumeral surface is maximum at these more functional positions, thus distributing joint load over a larger region in a more stable configuration. The contact point moves forward and inferior during internal rotation (Figure 3.20). With external rotation, the contact is posterior/inferior. With elevation, the contact area moves superiorly. Lippitt and associates [1998] calculated the stability ratio, which is defined as a force necessary to translate the humeral head from
3–5°
7°
FIGURE 3.19 The glenoid faces slightly superior and posterior (retroverted) with respect to the body of the scapula. By permission of Mayo Foundation.
3-18 |
|
|
|
Biomechanics |
|
TABLE 3.12 Glenohumeral Contact Areas |
|||
|
|
|
|
|
|
|
|
Contact Areas |
|
|
Elevation |
Contact Areas |
at 20◦ Internal to |
|
|
Angle (◦ ) |
at SR (cm2) |
SR (cm2) |
|
0 |
0.87 ± 1.01 |
1.70 ± 1.68 |
|
|
30 |
2.09 ± 1.54 |
2.44 ± 2.15 |
|
|
60 |
3.48 ± 1.69 |
4.56 ± 1.84 |
|
|
90 |
4.95 ± 2.15 |
3.92 ± 2.10 |
|
|
120 |
5.07 ± 2.35 |
4.84 ± 1.84 |
|
|
150 |
3.52 ± 2.29 |
2.33 ± 1.47 |
|
|
180 |
2.59 ± 2.90 |
2.51 ± NA |
||
SR = starting external rotation that allowed the shoulder to reach maximal elevation in the scapular plane (≈40◦ ± 8◦ ); NA = not applicable.
Source: Soslowsky L.J., Flatow E.L., Bigliani L.U., Pablak R.J., Mow V.C., and Athesian G.A. 1992. J. Orthop. Res. 10: 524.
the glenoid fossa divided by the compressive load times 100. The stability ratios were in the range of 50–60% in the superior–inferior direction and 30–40% in the anterior–posterior direction. After the labrum was removed, the ratio decreased by approximately 20%. Joint conformity was found to have significant influence on translations of humeral head during active positioning by muscles [Karduna et al., 1996].
GT
BG
Pivot LT
90 – 60
30
Ext. Int.
Rot. Rot.
FIGURE 3.20 Humeral contact positions as a function of glenohumeral motion and positions. (From Morrey B.F. and An K.N. 1990. C.A. Rockwood and F.A. Matsen (Eds.), The Shoulder, pp. 208–245, Philadelphia, Saunders. With permission.)

Joint-Articulating Surface Motion |
|
3-19 |
||
|
TABLE 3.13 Arm Elevation: Glenohumeral–Scapulothoracic Rotation |
|||
|
|
|
|
|
|
|
Glenohumeral/Scapulothoracic |
||
|
Investigators |
Motion Ratio |
||
|
|
|
|
|
|
Inman et al. [1994] |
2 : 1 |
|
|
|
Freedman and Munro [1966] |
1.35 |
: 1 |
|
|
Doody et al. [1970] |
1.74 |
: 1 |
|
|
Poppen and Walker [1976] |
4.3 : 1 (<24◦ elevation) |
||
|
|
1.25 |
: 1 (>24◦ elevation) |
|
|
Saha [1971] |
2.3 : 1 (30–135◦ elevation) |
|
|
3.4.3 Axes of Rotation
The shoulder complex consists of four distinct articulations: the glenohumeral joint, the acromioclavicular joint, the sternoclavicular joint, and the scapulothoracic articulation. The wide range of motion of the shoulder (exceeding a hemisphere) is the result of synchronous, simultaneous contributions from each joint. The most important function of the shoulder is arm elevation. Several investigators have attempted to relate glenohumeral and scapulothoracic motion during arm elevation in various planes (Table 3.13). About two-thirds of the motion takes place in the glenohumeral joint and about one-third in the scapulothoracic articulation, resulting in a 2 : 1 ratio.
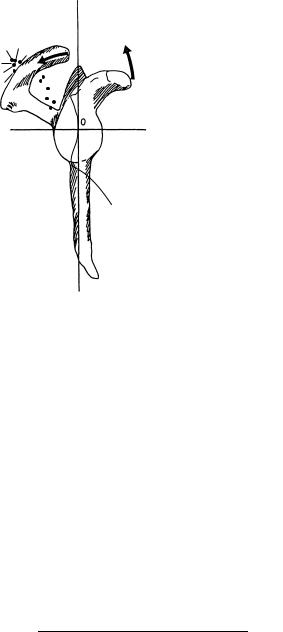
Surface motion at the glenohumeral joint is primarily rotational. The center of rotation of the glenohumeral joint has been defined as a locus of points situated within 6.0 ± 1.8 mm of the geometric center of the humeral head [Poppen and Walker, 1976]. However, the motion is not purely rotational. The humeral head displaces, with respect to the glenoid. From 0 to 30◦, and often from 30 to 60◦, the humeral head moves upward in the glenoid fossa by about 3 mm, indicating that rolling and/or gliding has taken place. Thereafter, the humeral head has only about 1 mm of additional excursion. During arm elevation in the scapular plane, the scapula moves in relation to the thorax [Poppen and Walker, 1976]. From 0 to 30◦ the scapula rotates about its lower mid portion, and then from 60◦ onward the center of rotation shifts toward the glenoid, resulting in a large lateral displacement of the inferior tip of the scapula (Figure 3.21). The center of rotation of the scapula for arm elevation is situated at the tip of the acromion as viewed from the edge on (Figure 3.22). The mean amount of scapular twisting at maximum arm elevation is 40◦. The superior tip of the scapula moves away from the thorax, and the inferior tip moves toward it.
3.5 Elbow
The bony structures of the elbow are the distal end of the humerus and the proximal ends of the radius and ulna. The elbow joint complex allows two degrees of freedom in motion: flexion/extension and pronation/supination. The elbow joint complex is three separate synovial articulations. The humeral– ulnar joint is the articulation between the trochlea of the distal radius and the trochlear fossa of the proximal ulna. The humero–radial joint is formed by the articulation between the capitulum of the distal humerus and the head of the radius. The proximal radioulnar joint is formed by the head of the radius and the radial notch of the proximal ulna.
3.5.1 Geometry of the Articulating Surfaces
The curved, articulating portions of the trochlea and capitulum are approximately circular in a crosssection. The radius of the capitulum is larger than the central trochlear groove (Table 3.14). The centers of curvature of the trochlea and capitulum lie in a straight line located on a plane that slopes at 45 to 50◦
3-20 |
Biomechanics |
|
Y |
y |
|
120–150° |
|
60–90° |
|
x |
MED. |
LAT. |
|
|
90–120° |
0–30° |
30–60° |
150° Shoulder elevation |
0° Shoulder |
|
elevation |
X |
|
FIGURE 3.21 Rotation of the scapula on the thorax in the scapular plane. Instant centers of rotation (solid dots) are shown for each 30◦ interval of motion during shoulder elevation in the scapular plane from zero to 150◦ . The x and y axes are fixed in the scapula, whereas the X and Y axes are fixed in the thorax. From zero to 30◦ in the scapula rotated about its lower midportion; from 60◦ onward, rotation took place about the glenoid area, resulting in a medial and upward displacement of the glenoid face and a large lateral displacement of the inferior tip of the scapula. (From Poppen N.K. and Walker P.S. 1976. J. Bone Joint Surg. 58A: 195. With permission.)
anterior and distal to the transepicondylar line and is inclined at 2.5◦ from the horizontal transverse plane [Shiba et al., 1988]. The curves of the ulnar articulations form two surfaces (coronoid and olecranon) with centers on a line parallel to the transepicondylar line but are distinct from it [Shiba et al., 1988]. The carrying angle is an angle made by the intersection of the longitudinal axis of the humerus and the forearm in the frontal plane with the elbow in an extended position. The carrying angle is contributed to, in part, by the oblique axis of the distal humerus and, in part, by the shape of the proximal ulna (Figure 3.23).
3.5.2 Joint Contact
The contact area on the articular surfaces of the elbow joint depends on the joint position and the loading conditions. Increasing the magnitude of the load not only increases the size of the contact area but shifts the locations as well (Figure 3.24). As the axial loading is increased, there is an increased lateralization of the articular contact [Stormont et al., 1985]. The area of contact, expressed as a percentage of the total articulating surface area, is given in Table 3.15. Based on a finite element model of the humero–ulnar joint, Merz et al. [1997] demonstrated that the humero–ulnar joint incongruity brings about a bicentric distribution of contact pressure, a tensile stress exists in the notch that is the same order of magnitude as the compressive stress [Merz, 1997].
Joint-Articulating Surface Motion |
|
|
|
|
3-21 |
|||||
(a) |
|
|
|
(b) |
y |
|||||
|
Acromion |
|
y |
Acromion |
|
|
|
|
||
|
|
|
|
remains |
|
|
|
|
||
|
|
|
|
|
|
|
||||
30° 60° |
|
|
|
|
|
|
|
|||
|
|
|
|
level |
|
|
|
|
||
0° |
|
|
|
|
|
|
|
|
|
|
90° |
120° |
|
|
|
|
|
|
Coracoid |
||
120° |
|
|
|
|
|
|
moves up |
|||
|
|
|
|
|
|
|
|
|||
150° 150° |
90° |
|
|
|
|
|
|
|
|
|
60° |
|
|
|
|
|
|
|
|
||
0° 30° |
|
|
|
|
|
|
|
|
||
|
Coracoid |
|
|
|
|
|
|
|
|
|
x |
|
|
z |
|
|
0 |
|
|
||
|
|
|
|
|
|
|
|
|
||
|
LAT. |
|
MED. |
POST. |
|
|
ANT. |
|||
|
|
|
|
|
|
|||||
|
|
|
|
|
|
|
|
|
|
|
|
|
|
|
|
|
|
|
|
|
|
FIGURE 3.22 (a) A plot of the tips of the acromion and coracoid process on roentgenograms taken at successive intervals of arm elevation in the scapular plane shows upward movement of the coracoid and only a slight shift in the acromion relative to the glenoid face. This finding demonstrates twisting, or external rotation, of the scapula about the x-axis. (b) A lateral view of the scapula during this motion would show the coracoid process moving upward while the acromion remains on the same horizontal plane as the glenoid. (From Poppen N.K. and Walker P.S. 1976. J. Bone Joint Surg. 58A: 195. With permission.)
3.5.3 Axes of Rotation
The axes of flexion and extension can be approximated by a line passing through the center of the trochlea, bisecting the angle formed by the longitudinal axes of the humerus and the ulna [Morrey and Chao, 1976]. The instant centers of flexion and extension vary within 2–3 mm of this axis (Figure 3.25). With the elbow fully extended and the forearm fully supinated, the longitudinal axes of humerus and ulna normally intersect at a valgus angle referred to as the carrying angle. In adults, this angle is usually 10–15◦ and normally is greater on average in women [Zuckerman and Matsen, 1989]. As the elbow flexes, the carrying angle varies as a function of flexion (Figure 3.26). In extension there is a valgus angulation of
TABLE 3.14 Elbow Joint Geometry
Parameter |
Size (mm) |
|
|
|
|
Capitulum radius |
10.6 ± 1.1 |
|
Lateral trochlear flange radius |
10.8 ± 1.0 |
|
Central trochlear groove radius |
8.8 |
± 0.4 |
Medial trochlear groove radius |
13.2 |
± 1.4 |
Distal location of flexion/extension |
|
|
axis from transepicondylar line: |
|
± 0.2 |
Lateral |
6.8 |
|
Medial |
8.7 |
± 0.6 |
Source: Shiba R., Sorbie C., Siu D.W., Bryant J.T.,
Cooke T.D.V., and Weavers H.W. 1988. J. Orthop.
Res. 6: 897.