

Biomechanics Principles and Applications - Donald R. Peterson & Joseph D. Bronzino
.pdfCardiac Biomechanics |
8-25 |
[122]Ingels, N.B., Jr., Daughters, G.T., II, Stinson, E.B. et al., Measurement of midwall myocardial dynamics in intact man by radiography of surgically implanted markers, Circulation, 52, 859–867, 1975.
[123]Hunter, W.C. and Zerhouni, E.A., Imaging distinct points in left ventricular myocardium to study regional wall deformation, in Innovations in Diagnostic Radiology, J.H. Anderson, Ed. SpringerVerlag, New York: 1989, pp. 169–190.
[124]Meier, G.D., Bove, A.A., Santamore, W.P. et al., Contractile function in canine right ventricle, Am. J. Physiol., 239, H794–H804, 1980.
[125]Meier, G.D., Ziskin, M.C., Santamore, W.P. et al., Kinematics of the beating heart, IEEE Trans. Biomed. Eng., 27, 319–329, 1980.
[126]McCulloch, A.D. and Omens, J.H., Non-homogeneous analysis of three-dimensional transmural finite deformations in canine ventricular myocardium, J. Biomech., 24, 539–548, 1991.
[127]Leclercq, C., Faris, O., Tunin, R. et al., Systolic improvement and mechanical resynchronization does not require electrical synchrony in the dilated failing heart with left bundle-branch block, Circulation, 106, 1760–1763, 2002.
[128]Usyk, T.P. and McCulloch, A.D., Electromechanical model of cardiac resynchronization in the dilated failing heart with left bundle branch block, J. Electrocardiol., 36, 57–61, 2003.
[129]Ross, J., Jr., Sonnenblick, E.H., Covell, J.W. et al., The architecture of the heart in systole and diastole: technique of rapid fixation and analysis of left ventricular geometry, Circ. Res., 21, 409–421, 1967.
[130]Grossman, W., Cardiac hypertrophy: useful adaptation or pathologic process? Am. J. Med., 69, 576–583, 1980.
[131]Grossman, W., Jones, D., and McLaurin, L.P., Wall stress and patterns of hypertrophy in the human left ventricle, J. Clin. Invest., 56, 56–64, 1975.
[132]Medugorac, I., Myocardial collagen in different forms of hypertrophy in the rat, Res. Exp. Med. (Berl.), 177, 201–211, 1980.
[133]Weber, K.T., Janicki, J.S., Shroff, S.G. et al., Collagen remodeling of the pressure-overloaded, hypertrophied nonhuman primate myocardium, Circ. Res., 62, 757–65, 1988.
[134]Jalil, J.E., Doering, C.W., Janicki, J.S. et al., Structural vs. contractile protein remodeling and myocardial stiffness in hypertrophied rat left ventricle, J. Mol. Cell. Cardiol., 20, 1179–87, 1988.
[135]Mukherjee, D. and Sen, S., Collagen phenotypes during development and regression of myocardial hypertrophy in spontaneously hypertensive rats, Circ. Res., 67, 1474–1480, 1990.
[136]Harper, J., Harper, E., and Covell, J.W., Collagen characterization in volume-overload- and pressure- overload-induced cardiac hypertrophy in minipigs, Am. J. Physiol., 265, H434–H438, 1993.
[137]Omens, J.H., Milkes, D.E., and Covell, J.W., Effects of pressure overload on the passive mechanics of the rat left ventricle, Ann. Biomed. Eng., 23, 152–163, 1995.
[138]Contard, F., Koteliansky, V., Marotte, F. et al., Specific alterations in the distribution of extracellular matrix components within rat myocardium during the development of pressure overload, Lab. Invest., 64, 65–75, 1991.
[139]Silver, M.A., Pick, R., Brilla, C.G. et al., Reactive and reparative fibrillar collagen remodelling in the hypertrophied rat left ventricle: two experimental models of myocardial fibrosis, Cardiovasc. Res., 24, 741–747, 1990.
[140]Michel, J.B., Salzmann, J.L., Ossondo Nlom, M. et al., Morphometric analysis of collagen network and plasma perfused capillary bed in the myocardium of rats during evolution of cardiac hypertrophy,
Basic Res. Cardiol., 81, 142–154, 1986.
[141]Iimoto, D.S., Covell, J.W., and Harper, E., Increase in crosslinking of type I and type III collagens associated with volume overload hypertropy, Circ. Res., 63, 399–408, 1988.
[142]Weber, K.T., Pick, R., Silver, M.A. et al., Fibrillar collagen and remodeling of dilated canine left ventricle, Circulation, 82, 1387–1401, 1990.
[143]Corin, W.J., Murakami, T., Monrad, E.S. et al., Left ventricular passive diastolic properties in chronic mitral regurgitation, Circulation, 83, 797–807, 1991.
8-26 |
Biomechanics |
[144]Whittaker, P., Boughner, D.R., Kloner, R.A. et al., Stunned myocardium and myocardial collagen damage: differential effects of single and repeated occlusions, Am. Heart J., 121, 434–441, 1991.
[145]Zhao, M., Zhang, H., Robinson, T.F. et al., Profound structural alterations of the extracellular collagen matrix in postischemic dysfunctional (“tunned”) but viable myocardium, J. Am. Coll. Cardiol., 10, 1322–1334, 1987.
[146]Forrester, J.S., Diamond, G., Parmley, W.W. et al., Early increase in left ventricular compliance after myocardial infarction, J. Clin. Invest., 51, 598–603, 1972.
[147]Pirzada, F.A., Ekong, E.A., Vokonas, P.S. et al., Experimental myocardial infarction XIII. Sequential changes in left ventricular pressure–length relationships in the acute phase, Circulation, 53, 970–975, 1976.
[148]Takahashi, S., Barry, A.C., and Factor, S.M., Collagen degradation in ischaemic rat hearts, Biochem. J., 265, 233–241, 1990.
[149]Charney, R.H., Takahashi, S., Zhao, M. et al., Collagen loss in the stunned myocardium, Circulation, 85, 1483–1490, 1992.
[150]Connelly, C.M., Vogel, W.M., Wiegner, A.W. et al., Effects of reperfusion after coronary artery occlusion on post-infarction scar tissue, Circ. Res., 57, 562–577, 1985.
[151]Jugdutt, B.I. and Amy, R.W., Healing after myocardial infarction in the dog: changes in infarct hydroxyproline and topography, J. Am. Coll. Cardiol., 7, 91–102, 1986.
[152]Whittaker, P., Boughner, D.R., and Kloner, R.A., Analysis of healing after myocardial infarction using polarized light microscopy, Am. J. Pathol., 134, 879–893, 1989.
[153]Jensen, L.T., Hørslev-Petersen, K., Toft, P. et al., Serum aminoterminal type III procollagen peptide reflects repair after acute myocardial infarction, Circulation, 81, 52–57, 1990.
[154]Pfeffer, J.M., Pfeffer, M.A., Fletcher, P.J. et al., Progressive ventricular remodeling in rat with myocardial infarction, Am. J. Physiol., 260, H1406–H1414, 1991.
[155]Whittaker, P., Boughner, D.R., and Kloner, R.A., Role of collagen in acute myocardial infarct expansion, Circulation, 84, 2123–2134, 1991.
[156]Holmes, J.W., Yamashita, H., Waldman, L.K. et al., Scar remodeling and transmural deformation after infarction in the pig, Circulation, 90, 411–420, 1994.
[157]Eghbali, M., Robinson, T.F., Seifter, S. et al., Collagen accumulation in heart ventricles as a function of growth and aging, Cardiovasc. Res., 23, 723–729, 1989.
[158]Medugorac, I. and Jacob, R., Characterisation of left ventricular collagen in the rat, Cardiovasc. Res., 17, 15–21, 1983.
[159]Borg, T.K., Ranson, W.F., Moslehy, F.A. et al., Structural basis of ventricular stiffness, Lab. Invest., 44, 49–54, 1981.
[160]Anversa, P., Puntillo, E., Nikitin, P. et al., Effects of age on mechanical and structural properties of myocardium of Fischer 344 rats, Am. J. Physiol., 256, H1440–H1449, 1989.

Ajit P. Yoganathan
Jack D. Lemmon
Jeffrey T. Ellis
Georgia Institute of Technology
9
Heart Valve Dynamics
9.1 Aortic and Pulmonic Valves . . . . . . . . . . . . . . . . . . . . . . . . . . . 9-1
Mechanical Properties • Valve Dynamics
9.2 Mitral and Tricuspid Valves . . . . . . . . . . . . . . . . . . . . . . . . . . . . 9-8
Mechanical Properties |
• Valve Dynamics |
References . . . . . . . . . . . . . . |
. . . . . . . . . . . . . . . . . . . . . . . . . . . . . . . . . . . . 9-13 |
The heart has four valves that control the direction of blood flow through the heart, permitting forward flow and preventing back flow. On the right side of the heart, the tricuspid and pulmonic valves regulate the flow of blood that is returned from the body to the lungs for oxygenation. The mitral and aortic valves control the flow of oxygenated blood from the left side of the heart to the body. The aortic and pulmonic valves allow blood to be pumped from the ventricles into arteries on the left and right side of the heart, respectively. Similarly, the mitral and tricuspid valves lie between the atria and ventricles of the left and right sides of the heart, respectively. The aortic and pulmonic valves open during systole when the ventricles are contracting, and close during diastole when the ventricles are filling through the open mitral and tricuspid valves. During isovolumic contraction and relaxation, all four valves are closed (Figure 9.1).
When closed, the pulmonic and tricuspid valves must withstand a pressure of approximately 30 mmHg. However, the closing pressures on the left side of the heart are much higher. The aortic valve withstands pressures of approximately 100 mmHg, while the mitral valve closes against pressures up to 150 mmHg. Since diseases of the valves on the left side of the heart are more prevalent, most of this chapter will focus on the aortic and mitral valves. Where pertinent, reference will be made to the pulmonic and tricuspid valves.
9.1 Aortic and Pulmonic Valves
The aortic valve is composed of three semilunar cusps, or leaflets, contained within a connective tissue sleeve. The valve cusps are attached to a fibrous ring embedded in the fibers of the ventricular septum and the anterior leaflet of the mitral valve. Each of the leaflets is lined with endothelial cells and has a dense collagenous core adjacent to the high pressure aortic side. The side adjacent to the aorta is termed the fibrosa and is the major fibrous layer within the belly of the leaflet. The layer covering the ventricular side of the valve is called the ventricularis and is composed of both collagen and elastin. The ventricularis is thinner than the fibrosa and presents a very smooth surface to the flow of blood [Christie, 1990]. The central portion of the valve, called the spongiosa, contains variable loose connective tissue and proteins and is normally not vascularized. The collagen fibers within the fibrosa and ventricularis are unorganized in the unstressed state. When a stress is applied, they become oriented primarily in the
9-1
9-2 |
|
|
|
|
|
|
|
|
|
Biomechanics |
|
|
Systole |
|
|
|
Diastole |
|
|
||
Aortic |
|
|
|
|
|
|
|
|
|
|
pressure |
|
|
|
|
|
|
|
|
|
|
Ventricular |
|
|
|
|
|
|
|
|
|
|
pressure |
|
|
|
|
|
|
|
|
MV closes |
|
|
|
|
|
|
|
|
|
|
||
Mitral |
|
|
|
|
|
|
|
|
|
|
flow |
|
|
|
|
|
|
|
|
|
|
|
|
|
|
|
|
MV opens |
|
|
|
|
|
|
|
|
|
|
AV closes |
|
|
|
|
Aortic |
|
|
|
|
|
|
|
|
|
|
flow |
|
AV opens |
|
|
|
|
|
|
|
|
|
|
|
|
|
|
|
|
|
||
ECG |
QRS |
|
|
|
|
|
|
|
|
|
|
|
|
|
|
|
|
|
|
|
|
|
|
T |
|
|
|
|
|
P |
|
|
0 |
100 |
200 |
300 |
400 |
500 |
600 |
700 |
800 |
900 |
1000 |
Isovolumic |
|
|
Isovolumic |
|
|
|
Time (msec) |
|||
contraction |
|
|
relaxation |
|
|
|
|
|
||
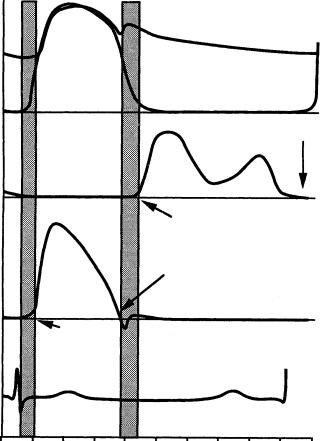
FIGURE 9.1 Typical pressure and flow curves for the aortic and mitral valves.
circumferential direction with a lower concentration of elastin and collagen in the radial direction [Christie, 1990; Thubrikar, 1990].
The fibrous annular ring of the aortic valve separates the aorta from the left ventricle and superior to this ring is a structure called the sinus of Valsalva, or aortic sinus. The sinus is comprised of three bulges at the root of the aorta, with each bulge aligned with the belly or central part of the specific valve leaflet. Each valve cusp and corresponding sinus is named according to its anatomical location within the aorta. Two of these sinuses give rise to coronary arteries that branch off the aorta, providing blood flow to the heart itself. The right coronary artery is based at the right or right anterior sinus, the left coronary artery exits the left or left posterior sinus, and the third sinus is called the non-coronary or right posterior sinus. Figure 9.2 shows the configuration of the normal aortic sinuses and valve in the closed position. Because the length of the aortic valve cusps is greater than the annular radius, a small overlap of tissue from each leaflet protrudes and forms a coaptation surface within the aorta when the valve is closed [Emery and Arom, 199l]. This overlapped tissue, called the lunula, may help to ensure that the valve is sealed. When the valve is open, the leaflets extend to the upper edge of the sinuses of Valsalva. The anatomy of the pulmonic valve is similar to that of the aortic valve, but the surrounding structure is slightly different. The main
Heart Valve Dynamics |
9-3 |
Sinus of valsalva
LCC |
RCC |
|
Aorta
Left ventricle
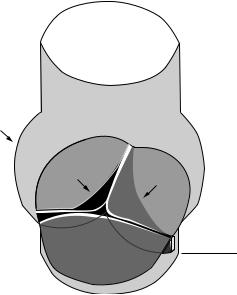
FIGURE 9.2 The aortic sinuses and valve in the closed position. The noncoronary cusp (NCC) is in front. The left and right coronary cusps (LCC and RCC) are positioned as marked. The aorta is above the closed valve in this orientation and the left ventricle is below the dashed line.
differences are that the sinuses are smaller in the pulmonary artery and the pulmonic valve annulus is slightly larger than that of the aortic valve.
The dimensions of the aortic and pulmonic valves and their leaflets have been measured in a number of ways. Before noninvasive measurement techniques such as echocardiography became available, valve measurements were recorded from autopsy specimens. An examination of 160 pathologic specimens revealed the aortic valve diameter to be 23.2 ± 3.3 mm, whereas the diameter of the pulmonic valve was measured at 24.3 ± 3.0 mm [Westaby et al., 1984]. However, according to M-mode echocardiographic measurements, the aortic root diameter at end systole was 35 ± 4.2 mm and 33.7 ± 4.4 mm at the end of diastole [Gramiak and Shah, 1970]. The differences in these measurements reflect the fact that the autopsy measurements were not performed under physiologic pressure conditions and that intrinsic differences in the measurement techniques exist. On average, pulmonic leaflets are thinner than aortic leaflets: 0.49 vs. 0.67 mm [David et al., 1994], although the leaflets of the aortic valve show variable dimensions depending on the respective leaflet. For example, the posterior leaflet tends to be thicker, have a larger surface area, and weigh more than the right or left leaflet [Silver and Roberts, 1985; Sahasakul et al., 1988], and the average width of the right aortic leaflet is greater than that of the other two [Vollebergh and Becker, 1977].
9.1.1 Mechanical Properties
Due to the location and critical function of the aortic valve, it is difficult to obtain measurements of its mechanical properties in vivo; however, reports are available from a small number of animal studies. This section will reference the in vivo data whenever possible and defer to the in vitro data when necessary. Since little mathematical modeling of the aortic valve’s material properties has been reported, it will be sufficient to describe the known mechanical properties of the valve. Like most biological tissues, the aortic valve is anisotropic, inhomogeneous, and viscoelastic. The collagen fibers within each valve cusp are aligned along the circumferential direction. Vesely and Noseworthy [1992] found that both the ventricularis and fibrosa were stiffer in the circumferential direction than in the radial direction. However, the ventricularis
9-4 |
Biomechanics |
was more extensible radially than circumferentially, while the fibrosa had uniform extensibility in both directions.
There are also elastin fibers, at a lesser concentration, that are oriented orthogonal to the collagen. It is this fiber structure that accounts for the anisotropic properties of the valve. The variation in thickness and composition across the leaflets is responsible for their inhomogeneous material properties. Although the aortic valve leaflet as a whole is asymmetric in its distensibility, the basal region tends to be relatively isotropic while the central region shows the greatest degree of anisotropy [Lo and Vesely, 1995]. The role and morphology of elastin and how elastin is coupled to collagen remain points of investigation. Scott and Vesely [1996] have shown that the elastin in the ventricularis consists of continuous amorphous sheets or compact meshes, while elastin in the fibrosa consists of complex arrays of large tubes that extend circumferentially across the leaflet. These tubes may surround the large circumferential collagen bundles in the fibrosa. Mechanical testing of elastin structures from the fibrosa and ventricularis separately have shown that the purpose of elastin in the aortic valve leaflet is to maintain a specific collagen fiber configuration and return the fibers to that state during cyclic loading [Vesely, 1998]. The valve’s viscoelastic properties are actually dominated by the elastic component (over the range of in vitro testing) so that the viscous effects, which are largely responsible for energy losses, are small [Thubrikar, 1990]. In addition to the collagen and elastin, clusters of lipids have been observed in the central spongiosa of porcine aortic valves. Vesely et al. [1994] have shown that the lipids tend to be concentrated at the base of the valve leaflets, while the coaptation regions and free edges of the leaflets tend to be devoid of these lipids. In addition, the spatial distribution of the lipids within the spongiosal layer of the aortic leaflets corresponded to areas in which calcification is commonly observed on bioprosthetic valves suggesting that these lipid clusters may be potential nucleation sites for calcification. In contrast, pulmonic leaflets showed a substantially lower incidence of lipids [Dunmore-Buyze et al., 1995]. The aortic valve leaflets have also been shown to be slightly stiffer than pulmonary valve leaflets, although the extensibilities and relaxation rates of the two tissues are similar [Leeson-Dietrich et al., 1995].
Using marker fluoroscopy, in which the aortic valve leaflets were surgically tagged with radio-opaque markers and imaged with high speed x-rays, the leaflets have been shown to change length during the cardiac cycle [Thubrikar, 1990]. The cusps are longer during diastole than systole in both the radial and circumferential direction. The variation in length is greatest in the radial direction, approximately 20%, while the strain in the circumferential direction is about 10% of the normal systolic length [Lo and Vesely, 1995]. The difference in strain is due to the presence of the compliant elastin fibers aligned in this radial direction. The length change in both directions results in an increased valve surface area during diastole. During systole, the shortening of the valve leaflets helps to reduce obstruction of the aorta during the systolic ejection of blood. It should be noted that this change in area is by no means an active mechanism within the aortic valve; the valve simply reacts to the stresses it encounters in a passive manner.
In addition to this change in surface area, the aortic valve leaflets also undergo bending in the circumferential direction during the cardiac cycle. In diastole when the valve is closed, each leaflet is convex toward the ventricular side. During systole when the valve is open, the curvature changes and each leaflet is concave toward the ventricle. This bending is localized on the valve cusp near the wall of the aorta. This location is often thicker than the rest of the leaflet. The total diastolic stress in a valve leaflet has been estimated at 2.5 × 10⁶ dyn/cm2 for a strain of 15% [Thubrikar, 1990]. The stress in the circumferential direction was found to be the primary load bearing element in the aortic valve. Due to the collagen fibers oriented circumferentially, the valve is relatively stiff in this direction. The strain that does occur circumferentially is primarily due to scissoring of the fibrous matrix and straightening of collagen fibers that are kinked or crimped in the presence of no external stress. However, in the radial direction, because elastin is the primary element, the valve can undergo a great deal of strain, ranging from 20 to 60% in tissue specimens [Christie, 1990; Lo and Vesely, 1995]. In the closed position, the radial stress levels are actually small compared to those in the circumferential direction. This demonstrates the importance of the lunula in ensuring that the valve seals tightly to prevent leakage. Because of their anatomical location, the lunula cause these high circumferential stress levels by enabling the aortic pressure to pull each leaflet in the circumferential direction towards the other leaflets.
Heart Valve Dynamics |
9-5 |
The composition, properties, and dimensions of the aortic valve change with age and in the presence of certain diseases. The valve leaflets become thicker, the lunula become fenestrated, or mesh-like, and in later stages of disease the central portion of the valve may become calcified [Davies, 1980]. This thickening of the valve typically occurs on the ventricular side of the valve, in the region where the tips of the leaflets come together. Another site of calcification and fibrosis is the point of maximum cusp flexion and is thought to be a response to fatigue in the normal valve tissue.
9.1.2 Valve Dynamics
The aortic valve opens during systole when the ventricle is contracting and then closes during diastole as the ventricle relaxes and fills from the atrium. Systole lasts about one third of the cardiac cycle and begins when the aortic valve opens, which typically takes only 20 to 30 msec [Bellhouse, 1969]. Blood rapidly accelerates through the valve and reaches a peak velocity after the leaflets have opened to their full extent and start to close again. Peak velocity is reached during the first third of systole and the flow begins to decelerate rapidly after the peak is reached, albeit not as fast as its initial acceleration. The adverse pressure gradient that is developed affects the low momentum fluid near the wall of the aorta more than that at the center; this causes reverse flow in the sinus region [Reul and Talukdar, 1979]. Figure 9.2 illustrates the pressure and flow relations across the aortic valve during the cardiac cycle. During systole, the pressure difference required to drive the blood through the aortic valve is on the order of a few millimeters of mercury; however, the diastolic pressure difference reaches 80 mmHg in normal individuals. The valve closes near the end of the deceleration phase of systole with very little reverse flow through the valve.
During the cardiac cycle the heart undergoes translation and rotation due to its own contraction pattern. As a result, the base of the aortic valve varies in size and also translates, mainly along the axis of the aorta. Using marker fluoroscopy to study the base of the aortic valve in dogs, Thubrikar et al. [1993] found that the base perimeter is at its largest at end diastole and decreases in size during systole; it then reaches a minimum at the end of systole and increases again during diastole. The range of this perimeter variation during the cardiac cycle was 22% for an aortic pressure variation of 120/80 mmHg. The valve annulus also undergoes translation, primarily parallel to the aortic axis. The aortic annulus moves downward toward the ventricle during systole and then recoils back toward the aorta as the ventricle fills during diastole. The annulus also experiences a slight side-to-side translation with its magnitude approximately one half the displacement along the aortic axis.
During systole, vortices develop in all three sinuses behind the leaflets of the aortic valve. The function of these vortices was first described by Leonardo da Vinci in 1513, and they have been researched extensively in this century primarily through the use of in vitro models [Bellhouse, 1969; Reul and Talukdar, 1979]. It has been hypothesized that the vortices help to close the aortic valve so that blood is prevented from returning to the ventricle during the closing process. These vortices create a transverse pressure difference that pushes the leaflets toward the center of the aorta and each other at the end of systole, thus minimizing any possible closing volume. However, as shown in vitro by Reul and Talukdar [1979], the axial pressure difference alone is enough to close the valve. Without the vortices in the sinuses, the valve still closes but its closure is not as quick as when the vortices are present. The adverse axial pressure difference within the aorta causes the low inertia flow within the developing boundary layer along the aortic wall to decelerate first and to reverse direction. This action forces the belly of the leaflets away from the aortic wall and toward the closed position. When this force is coupled with the vortices that push the leaflet tips toward the closed position, a very efficient and fast closure is obtained. Closing volumes have been estimated to be less than 5% of the forward flow [Bellhouse and Bellhouse, 1969].
The parameters that describe the normal blood flow through the aortic valve are the velocity profile, time course of the blood velocity or flow, and magnitude of the peak velocity. These are determined in part by the pressure difference between the ventricle and aorta and by the geometry of the aortic valve complex. As seen in Figure 9.3, the velocity profile at the level of the aortic valve annulus is relatively flat. However there is usually a slight skew toward the septal wall (less than 10% of the center-line velocity) that is caused by the orientation of the aortic valve relative to the long axis of the left ventricle. This skew

9-6 |
Biomechanics |
FIGURE 9.3 Velocity profiles measured 2 cm downstream of the aortic valve with hot film anemometry in dogs [Paulsen and Hasenkam, 1983]. The timing of the measurements during the cardiac cycle is shown by the marker on the aortic flow curve.
in the velocity profile has been shown by many experimental techniques, including hot film anemometry, Doppler ultrasound, and MRI [Paulsen and Hasenkam, 1983; Rossvol et al., 1991; Kilner et al., 1993]. In healthy individuals, blood flows through the aortic valve at the beginning of systole and then rapidly accelerates to its peak value of 1.35 ± 0.35 m/sec; for children this value is slightly higher at 1.5 ± 0.3 m/sec [Hatle and Angelson, 1985]. At the end of systole there is a very short period of reverse flow that can be measured with Doppler ultrasound. This reverse flow is probably either a small closing volume or the velocity of the valve leaflets as they move toward their closed position. The flow patterns just downstream of the aortic valve are of particular interest because of their complexity and relation to arterial disease. Highly skewed velocity profiles and corresponding helical flow patterns have been observed in the human aortic arch using magnetic resonance phase velocity mapping [Kilner et al., 1993].
Heart Valve Dynamics |
9-7 |
m/sec
|
|
|
1.0 |
|
39 msec |
70 msec |
|
0.8 |
|
|
101 msec |
|||
|
|
|
0.6 |
|
|
Left |
|
0.4 |
|
|
|
0.2 |
||
Inf. |
|
|
||
|
|
|
||
|
|
|
0.0 |
|
|
Sup |
|
–0.2 |
|
a Right |
|
–0.4 |
||
b |
c |
|||
|
Trans_neg
132 msec |
163 msec |
256 msec |
m/sec |
1.0 |
|||
|
|
|
0.8 |
|
|
|
0.6 |
|
|
|
0.4 |
|
|
|
0.2 |
|
|
|
0.0 |
|
|
|
–0.2 |
d |
e |
f |
–0.4 |
|
m/sec
1.0
0.8
349 msec 442 msec 721 msec
0.6
0.4
0.2
0.0
–0.2
–0.4
g |
h |
i |
Trans_neg
Trans_neg
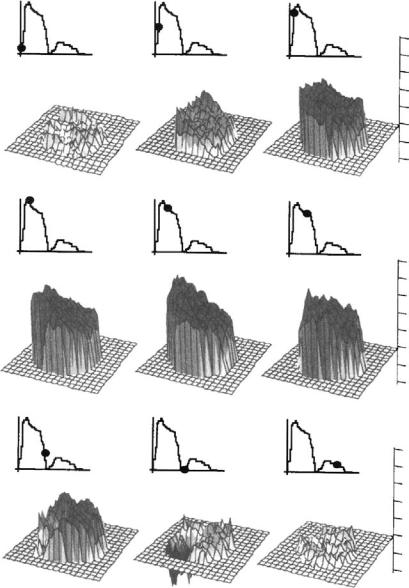
FIGURE 9.4 Velocity profiles downstream of the human pulmonary valve obtained with magnetic resonance phase velocity mapping [Sloth, 1994]. Again the timing of the measurements is shown by the marker on the flow curve.
The pulmonic valve flow behaves similarly to that of the aortic valve, but the magnitude of the velocity is not as great. Typical peak velocities for healthy adults are 0.75 ± 0.15 m/sec; again these values are slightly higher for children at 0.9 ± 0.2 m/sec [Weyman, 1994]. As seen in Figure 9.4 a rotation of the peak velocity can be observed in the pulmonary artery velocity profile. During acceleration, the peak velocity is observed inferiorly with the peak rotating counterclockwise throughout the remainder of the ejection phase [Sloth et al., 1994]. The mean spatial profile is relatively flat, however, although there is a region of reverse flow that occurs in late systole that may be representative of flow separation. Typically, there is only a slight skew to the profile. The peak velocity is generally within 20% of the spatial mean throughout the cardiac cycle. Secondary flow patterns can also be observed in the pulmonary artery and its bifurcation. In vitro