

Biomechanics Principles and Applications - Donald R. Peterson & Joseph D. Bronzino
.pdf9-8 |
Biomechanics |
laser Doppler anemometry experiments have shown that these flow patterns are dependent on the valve geometry and thus can be used to evaluate function and fitness of the heart valve [Sung and Yoganathan, 1990].
9.2 Mitral and Tricuspid Valves
The mitral (Figure 9.5) and tricuspid valves are similar in structure with both valves composed of four primary elements: (1) the valve annulus, (2) the valve leaflets, (3) the papillary muscles, and (4) the chordae tendineae. The base of the mitral leaflets form the mitral annulus, which attaches to the atrial and ventricular walls, and aortic root. At the free edge of the leaflets, the chordae tendinae insert at multiple locations and extend to the tips of the papillary muscles. This arrangement provides continuity between the valve and ventricular wall to enhance valvular function. The valvular apparatus, or complex, requires an intricate interplay between all components throughout the cardiac cycle.
The mitral annulus is an elliptical ring composed of dense collagenous tissue surrounded by muscle. It goes through dynamic changes during the cardiac cycle by not only changing in size, but also by moving three-dimensionally. The circumference of the mitral annulus ranges from 8 to 12 cm during diastole. Recent studies involving the measurement of annular shape have also shown that the mitral annulus is not planar, but instead has a three-dimensional form. The annulus actually forms a saddle, or ski-slope shape [Levine et al., 1987; Komoda et al., 1994; Pai et al., 1995; Glasson et al., 1996]. This three-dimensional shape must be taken into account when non-invasively evaluating valvular function.
The mitral valve is a bileaflet valve comprised of an anterior and posterior leaflet. The leaflet tissue is primarily collagen-reinforced endothelium, but also contains striated muscle cells, non-myelinated nerve fibers, and blood vessels. The anterior and posterior leaflets of the valve are actually one continuous piece of tissue, as shown in Figure 9.6. The free edge of this tissue shows several indentations of which two are regularly placed, called the commisures. The commisures separate the tissue into the anterior and posterior leaflets. The location of the commisures can be identified by the fan-like distribution of chordae tendinae and the relative positioning of the papillary muscles. The combined surface area of both leaflets is approximately twice the area of the mitral orifice; this extra surface area permits a large line of coaptation and ample coverage of the mitral orifice during normal function and provides compensation in cases of disease [He, 1997, 1999]. The posterior leaflet encircles roughly two-thirds of the mitral annulus and is essentially an extension of the mural endocardium from the free walls of the left atrium. The anterior leaflet portion of the annulus is a line of connection, for the leaflet, the wall of the ascending aorta,
Annulus
Anterior
leaflet
Posterior
leaflet
Chordae tendineae
Posteromedial papillary
muscle
Anterolateral papillary muscle
FIGURE 9.5 Schematic of the mitral valve showing the valve leaflets, papillary muscles, and chordae tendineae.
Heart Valve Dynamics |
|
9-9 |
|
Anterior leaflet |
Posterior leaflet |
||
Posteromedial |
|
Anterolateral |
|
|
commisure |
||
commisure |
|
||
|
Lateral |
||
Medial |
Central |
||
scallop |
|||
scallop |
scallop |
||
|
|||
Chordae |
Chordae |
||
tendineae |
|||
tendineae |
|||
|
|
||
Posteromedial |
|
Anterolateral |
|
papillary |
|
papillary |
|
muscle |
|
muscle |
|
FIGURE 9.6 Diagram of the mitral valve as a continuous piece of tissue. The posterior and anterior leaflets are indicated, as are the scallops, chordae tendineae, and papillary muscles.
the aortic valve, and the atrial septum. The anterior leaflet is slightly larger than the posterior leaflet, and is roughly semi-lunar in shape as opposed to the quadrangular shaped posterior leaflet. The normal width and height of the anterior leaflet is approximately 3.3 and 2.3 cm, respectively. The height of the posterior leaflet is 1.3 cm, while the commisure height is less than 1.0 cm. The posterior leaflet typically has indentations, called scallop, that divide the leaflet into three regions: (1) the medial, (2) central, and
(3) lateral scallop [Silverman and Hurst, 1968; Raganathan et al., 1970; Roberts, 1983; Barlow, 1987; Kunzelmar et al., 1994].
The mitral leaflet tissue can be divided into both a rough and clear zone. The rough zone is the thicker part of the leaflet and is defined from the free edge of the valve to the valve’s line of closure. The term “rough” is used to denote the texture of the leaflet due to the insertion of the chordae tendineae in this area. The clear zone is thinner and translucent and extends from the line of closure to the annulus in the anterior leaflet and to the basal zone in the posterior leaflet. Unlike the mitral valve, the tricuspid valve has three leaflets: (1) an anterior leaflet, (2) a posterior leaflet with a variable number of scallops, and (3) a septal leaflet. The tricuspid valve is larger and structurally more complicated than the mitral valve and the separation of the valve tissue into distinct leaflets is less pronounced than with the mitral valve. The surface of the leaflets is similar to that of the mitral valve; however, the basal zone is present in all of the leaflets [Silver et al., 1971].
Chordae tendineae from both leaflets attach to each of the papillary muscles. The chordae tendineae consist of an inner core of collagen surrounded by loosely meshed elastin and collagen fibers with an outer layer of endothelial cells. In the mitral complex structure, there are marginal and basal chordae that insert into the mitral leaflets. From each papillary muscle, several chordae originate and branch into the marginal and basal chordae. The thinner marginal chordae insert into the leaflet free edge at multiple insertion points, while the thicker basal chordae insert into the leaflets at a higher level towards the annulus. The marginal chordae function to keep the leaflets stationary while the basal chordae seem to act more as supports [Kunzelman, 1994].
The left side of the heart has two papillary muscles, called anterolateral and posteromedial, that attach to the ventricular free wall and tether the mitral valve in place via the chordae tendinae. This tethering prevents the mitral valve from prolapsing into the atrium during ventricular ejection. On the right side of the heart, the tricuspid valve has three papillary muscles. The largest one, the anterior papillary muscle, attaches to the valve at the commissure between the anterior and posterior leaflets. The posterior papillary muscle is located between the posterior and septal leaflets. The smallest papillary muscle, called the septal muscle, is sometimes not even present. Improper tethering of the leaflets will result in valve prolapse during ventricular contraction, permitting the valve leaflets to extend into the atrium. This incomplete

10
Arterial Macrocirculatory Hemodynamics
10.1 |
Blood Vessel Walls . . . . . . . . . . . . . . . . . . . . . . . . . . . . . . . . . . . . |
10-1 |
10.2 |
Flow Characteristics . . . . . . . . . . . . . . . . . . . . . . . . . . . . . . . . . . . |
10-2 |
10.3 |
Wave Propagation . . . . . . . . . . . . . . . . . . . . . . . . . . . . . . . . . . . . . |
10-4 |
10.4 |
Velocity Profiles . . . . . . . . . . . . . . . . . . . . . . . . . . . . . . . . . . . . . . . |
10-5 |
10.5 |
Pathology . . . . . . . . . . . . . . . . . . . . . . . . . . . . . . . . . . . . . . . . . . . . . |
10-8 |
Defining Terms . . . . . . . . . . . . . . . . . . . . . . . . . . . . . . . . . . . . . . . . . . . . . . |
10-9 |
|
Baruch B. Lieber |
References . . . . . . . . . . . . . . . . . . . . . . . . . . . . . . . . . . . . . . . . . . . . . . . . . . . |
10-10 |
State University of New York-Buffalo |
Further Information . . . . . . . . . . . . . . . . . . . . . . . . . . . . . . . . . . . . . . . . . |
10-10 |
The arterial circulation is a multiply branched network of compliant tubes. The geometry of the network is complex, and the vessels exhibit nonlinear viscoelastic behavior. Flow is pulsatile, and the blood flowing through the network is a suspension of red blood cells and other particles in plasma that exhibits complex non-Newtonian properties. Whereas the development of an exact biomechanical description of arterial hemodynamics is a formidable task, surprisingly useful results can be obtained with greatly simplified models.
The geometrical parameters of the canine systemic and pulmonary circulations are summarized in Table 10.1. Vessel diameters vary from a maximum of 19 mm in the proximal aorta to 0.008 mm (8 μm) in the capillaries. Because of the multiple branching, the total cross-sectional area increases from 2.8 cm2 in the proximal aorta to 1357 cm2 in the capillaries. Of the total blood volume, approximately 83% is in the systemic circulation, 12% is in the pulmonary circulation, and the remaining 5% is in the heart. Most of the systemic blood is in the venous circulation, where changes in compliance are used to control mean circulatory blood pressure. This chapter will be concerned with flow in the larger arteries, classes 1 to 5 in the systemic circulation and 1 to 3 in the pulmonary circulation in Table 10.1. Flow in the microcirculation is discussed in Chapter 13, and venous hemodynamics is covered in Chapter 14.
10.1 Blood Vessel Walls
The detailed properties of blood vessels were described earlier in this section, but a few general observations are made here to facilitate the following discussion. Blood vessels are composed of three layers: the intima, media, and adventitia. The inner layer, or intima, is composed primarily of endothelial cells, which line the
10-1

10-2 |
|
|
|
|
|
Biomechanics |
|||
TABLE 10.1 Model of Vascular Dimensions in 20-kg Dog |
|
|
|
|
|
||||
|
|
|
|
|
|
|
|
|
|
|
|
|
|
|
|
Total |
|
Percentage |
|
|
|
|
Mean Diameter |
Number |
Mean Length |
Cross-Section |
Total Blood |
of Total |
|
Class |
Vessels |
(mm) |
of Vessels |
(mm) |
(cm2) |
Volume (ml) |
Volume |
||
|
|
|
|
|
Systemic |
|
|
|
|
|
|
|
|
|
|
|
|
|
|
1 |
Aorta |
(19–4.5) |
1 |
|
(2.8–0.2) |
60 |
|
|
|
2 |
Arteries |
4.000 |
40 |
150.0 |
5.0 |
75 |
|
|
|
3 |
Arteries |
1.300 |
500 |
45.0 |
6.6 |
30 |
|
|
|
4 |
Arteries |
0.450 |
6000 |
13.5 |
9.5 |
13 |
11 |
|
|
5 |
Arteries |
0.150 |
110,000 |
4.0 |
19.4 |
8 |
|
|
|
6 |
Arterioles |
0.050 |
6 |
1.2 |
55.0 |
7 |
|
|
|
2.8 × 10⁹ |
|
|
|||||||
7 |
Capillaries |
0.008 |
2.7 × 10⁷ |
0.65 |
1357.0 |
88 |
5 |
|
|
8 |
Venules |
0.100 |
1.0 × 10 |
1.6 |
785.4 |
126 |
|
|
|
9 |
Veins |
0.280 |
660,000 |
4.8 |
406.4 |
196 |
|
|
|
10 |
Veins |
0.700 |
40,000 |
13.5 |
154.0 |
208 |
|
|
|
11 |
Veins |
1.800 |
2100 |
45.0 |
53.4 |
240 |
|
|
|
12 |
Veins |
4.500 |
110 |
150.0 |
17.5 |
263 |
67 |
|
|
13 |
Venae cavae |
(5–14) |
2 |
|
(0.2–1.5) |
92 |
|
|
|
Total |
|
|
|
|
|
1406 |
|
|
|
|
|
|
|
Pulmonary |
|
|
|
|
|
|
|
|
|
|
|
|
|
|
|
1 |
Main artery |
1.600 |
1 |
28.0 |
2.0 |
6 |
|
|
|
2 |
Arteries |
4.000 |
20 |
10.0 |
2.5 |
25 |
3 |
|
|
3 |
Arteries |
1.000 |
1550 |
14.0 |
12.2 |
17 |
|
|
|
4 |
Arterioles |
0.100 |
6 |
0.7 |
120.0 |
8 |
|
|
|
1.5 × 10⁹ |
|
|
|||||||
5 |
Capillaries |
0.008 |
2.7 × 10⁶ |
0.5 |
1357.0 |
68 |
4 |
|
|
6 |
Venules |
0.110 |
2.0 × 10 |
0.7 |
190.0 |
13 |
|
|
|
7 |
Veins |
1.100 |
1650 |
14.0 |
15.7 |
22 |
|
|
|
8 |
Veins |
4.200 |
25 |
100.0 |
|
35 |
5 |
|
|
9 |
Main veins |
8.000 |
4 |
30.0 |
|
6 |
|
|
|
Total |
|
|
|
|
|
200 |
|
|
|
|
|
|
|
|
Heart |
|
|
|
|
|
|
|
|
|
|
|
|
|
|
|
|
Atria |
|
2 |
|
|
30 |
|
|
|
|
Ventricles |
|
2 |
|
|
54 |
5 |
|
Total |
|
|
|
|
|
84 |
|
|
|
Total |
|
|
|
|
|
|
|
|
|
|
circulation |
|
|
|
|
|
1690 |
100 |
|
Source: Milnor, W.R. 1989. Hemodynamics, 2nd ed., p. 45. Baltimore, Williams and Wilkins. With permission.
vessel and are involved in control of vessel diameter. The media, composed of elastin, collagen, and smooth muscle, largely determines the elastic properties of the vessel. The outer layer, or adventitia, is composed mainly of connective tissue. Unlike in structures composed of passive elastic materials, vessel diameter and elastic modulus vary with smooth-muscle tone. Dilation in response to increases in flow and myogenic constriction in response to increases in pressure have been observed in some arteries. Smooth-muscle tone is also affected by circulating vasoconstrictors such as norepinephrine and vasodilators such as nitroprusside. Blood vessels, like other soft biological tissues, generally do not obey Hooke’s law, becoming stiffer as pressure is increased. They also exhibit viscoelastic characteristics such as hysteresis and creep. Fortunately, for many purposes a linear elastic model of blood vessel behavior provides adequate results.
10.2 Flow Characteristics
Blood is a complex substance containing water, inorganic ions, proteins, and cells. Approximately 50% is plasma, a nearly Newtonian fluid consisting of water, ions, and proteins. The balance contains erythrocytes

Arterial Macrocirculatory Hemodynamics |
10-3 |
(red blood cells), leukocytes (white blood cells), and platelets. Whereas the behavior of blood in vessels smaller than approximately 100 μm exhibits significant non-Newtonian effects, flow in larger vessels can be described reasonably accurately using the Newtonian assumption. There is some evidence suggesting that in blood analog fluids wall shear stress distributions may differ somewhat from Newtonian values [Liepsch et al., 1991].
Flow in the arterial circulation is predominantly laminar with the possible exception of the proximal aorta and main pulmonary artery. In steady flow, transition to turbulence occurs at Reynolds numbers (NR) above approximately 2300
NR = |
2rV |
(10.1) |
ν |
where r = vessel radius, V = velocity, v = kinematic viscosity = viscosity/density.
Flow in the major systemic and pulmonary arteries is highly pulsatile. Peak-to-mean flow amplitudes as high as 6 to 1 have been reported in both human and dog [Milnor, 1989, p. 149]. Womersley’s [1957] analysis of incompressible flow in rigid and elastic tubes showed that the importance of pulsatility in the
velocity distributions depended on the parameter |
|
|
|
|
|
|
|
|
|
Nw = r |
|
ω |
(10.2) |
|
|
|
|
||
|
v |
|||
where ω = frequency.
This is usually referred to as the Womersley number (Nw ) or α-parameter. Womersley’s original report is not readily available; however, Milnor provides a reasonably complete account [Milnor, 1989, pp. 106–121].
Mean and peak Reynolds numbers in human and dog are given in Table 10.2, which also includes mean, peak, and minimum velocities as well as the Womersley number. Mean Reynolds numbers in the entire systemic and pulmonary circulations are below 2300. Peak systolic Reynolds numbers exceed 2300 in the aorta and pulmonary artery, and some evidence of transition to turbulence has been reported. In dogs, distributed flow occurs at Reynolds numbers as low as 1000, with higher Womersley numbers increasing the transition Reynolds number [Nerem and Seed, 1972]. The values in Table 10.2 are typical for individuals at rest. During exercise, cardiac output and hence Reynolds numbers can increase severalfold. The Womersley number also affects the shape of the instantaneous velocity profiles as discussed below.
TABLE 10.2 Normal Average Hemodynamics Values in Man and Dog
|
|
|
|
Dog (20 kg) |
|
|
|
|
Man (70 kg, 1.8 m2) |
|
|
|
|
|
|
|
|
|
|
|
|
|
|||
|
Nw |
Velocity (cm/sec) |
|
NR |
Nw |
Velocity (cm/sec) |
NR |
|||||
|
|
|
|
|
|
|
|
|
|
|
|
|
Systemic Vessels |
|
|
|
|
|
|
|
|
|
|
|
|
Ascending aorta |
16 |
15.8 (89/0)a |
870 (4900)b |
21 |
18 |
(112/0)a |
1500 (9400)a |
|||||
Abdominal aorta |
9 |
12 (60.0) |
370 (1870) |
12 |
14 |
(75/0) |
640 |
(3600) |
||||
Renal artery |
3 |
41 |
(74/26) |
440 (800) |
4 |
40 |
(73/26) |
700 |
(1300) |
|||
Femoral artery |
4 |
10 |
(42/1) |
130 (580) |
4 |
12 |
(52/2) |
200 (860) |
||||
Femoral vein |
5 |
5 |
|
92 |
|
7 |
4 |
|
104 |
|
||
Superior vena cava |
10 |
8 |
(20/0) |
320 (790) |
15 |
9 (23/0) |
550 |
(1400) |
||||
Inferior vena cava |
11 |
19 |
(40/0) |
800 |
(1800) |
17 |
21 (46/0) |
1400 |
(3000) |
|||
Pulmonary vessels |
|
|
|
|
|
|
|
|
|
|
|
|
Main artery |
14 |
18 |
(72/0) |
900 |
(3700) |
20 |
19 |
(96/0) |
1600 |
(7800) |
||
Main veinc |
7 |
18 |
(30/9) |
270 (800) |
10 |
19 (38/10) |
800 |
(2200) |
||||
aMean (systolic/diastolic).
bMean (peak).
cOne of the usually four terminal pulmonary veins.
Source: Milnor, W.R. 1989. Hemodynamics, 2nd ed., p. 148, Baltimore, Williams and Wilkins. With permission.

10-4 |
|
|
|
Biomechanics |
|
TABLE 10.3 Pressure Wave Velocities in Arteriesa,b |
|
||
|
|
|
Wave |
|
|
Artery |
Species |
Velocity (cm/sec) |
|
|
|
|
|
|
|
Ascending Aorta |
Man |
440–520 |
|
|
|
Dog |
350–472 |
|
|
Thoracic aorta |
Man |
400–650 |
|
|
|
Dog |
400–700 |
|
|
Abdominal aorta |
Man |
500–620 |
|
|
|
Dog |
550–960 |
|
|
Iliac |
Man |
700–880 |
|
|
|
Dog |
700–800 |
|
|
Femoral |
Man |
800–1800 |
|
|
|
Dog |
800–1300 |
|
|
Popliteal |
Dog |
1220–1310 |
|
|
Tibial |
Dog |
1040–1430 |
|
|
Carotid |
Man |
680–830 |
|
|
|
Dog |
610–1240 |
|
|
Pulmonary |
Man |
168–182 |
|
|
|
Dog |
255–275 |
|
|
|
Rabbit |
100 |
|
|
|
Pig |
190 |
|
aAll data are apparent pressure wave velocities (although the average of higher frequency harmonics approximates the true velocity in many cases), from relatively young subjects with normal cardiovascular systems, at approximately normal distending pressures.
bRanges for each vessel and species taken from Table 9.1 of source.
Source: Milnor, W.R. 1989. Hemodynamics, 2nd ed.,
p.235, Baltimore, Williams and Wilkins. With permission.
10.3Wave Propagation
The viscoelasticity of blood vessels affects the hemodynamics of arterial flow. The primary function of arterial elasticity is to store blood during systole so that forward flow continues when the aortic valve is closed. Elasticity also causes a finite wave propagation velocity, which is given approximately by the Moens–Korteweg relationship
c = |
Eh |
(10.3) |
2ρr |
where E = wall elastic modulus, h = wall thickness, ρ = blood density, r = vessel radius.
Although Moens [1878] and Korteweg [1878] are credited with this formulation, Fung [1984, p. 107] has pointed out that the formula was first derived much earlier [Young, 1808]. Wave speeds in arterial blood vessels from several species are given in Table 10.3. In general, wave speeds increase toward the periphery as vessel radius decreases and are considerably lower in the main pulmonary artery than in the aorta owing primarily to the lower pressure and consequently lower elastic modulus.
Wave reflections occur at branches where there is not perfect impedance matching of parent and daughter vessels. The input impedance of a network of vessels is the ratio of pressure to flow. For rigid vessels with laminar flow and negligible inertial effects, the input impedance is simply the resistance and is independent of pressure and flow rate. For elastic vessels, the impedance is dependent on the frequency of

Arterial Macrocirculatory Hemodynamics |
10-5 |
the fluctuations in pressure and flow. The impedance can be described by a complex function expressing the amplitude ratio of pressure to flow oscillations and the phase difference between the peaks.
¯ |
¯ |
|
|
|
|||
|
P (ω) |
|
|||||
Zi (ω) = |
|
|
|
|
|
|
|
|
Q¯ (ω) |
|
|||||
¯ |
|
¯ |
|
|
|
||
|
|
|
P (ω) |
(10.4) |
|||
|Zi (ω)| = |
|
|
|
|
|||
|
|
Q¯ (ω) |
|||||
|
θi (ω) = |
¯ |
|
|
¯ |
||
|
θ [(P (ω))] − θ [(Q(ω))] |
||||||
¯ |
¯ |
|
|
|
|
|
|
where Zi is the complex impedance, |
|Zi | is the amplitude, and θi is the phase. |
||||||
For an infinitely long straight tube with constant properties, input impedance will be independent of position in the tube and dependent only on vessel and fluid properties. The corresponding value of input
impedance is called the characteristic impedance Z0 given by |
|
||
Z0 = |
ρc |
(10.5) |
|
|
|
||
A |
|||
where A = vessel cross-sectional area.
In general, the input impedance will vary from point to point in the network because of variations in vessel sizes and properties. If the network has the same impedance at each point (perfect impedance matching), there will be no wave reflections. Such a network will transmit energy most efficiently. The reflection coefficient R, defined as the ratio of reflected to incident wave amplitude, is related to the relative characteristic impedance of the vessels at a junction. For a parent tube with characteristic impedance Z0 branching into two daughter tubes with characteristic impedances Z1 and Z2, the reflection coefficient is given by
R = |
|
Z0−1 − Z1−1 + Z2−1 |
(10.6) |
|||||
|
Z0−1 + Z1−1 + Z2−1 |
|||||||
and perfect impedance matching requires |
|
|
|
|
|
|
|
|
|
1 |
= |
1 |
+ |
1 |
|
(10.7) |
|
|
|
|
|
|
||||
|
Z0 |
Z1 |
Z2 |
|||||
The arterial circulation exhibits partial impedance matching; however, wave reflections do occur. At each branch point, local reflection coefficients typically are less than 0.2. Nonetheless, global reflection coefficients, which account for all reflections distal to a given site, can be considerably higher [Milnor, 1989, p. 217].
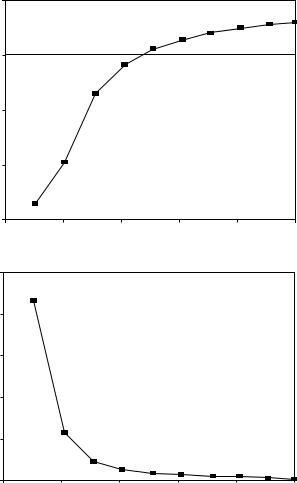
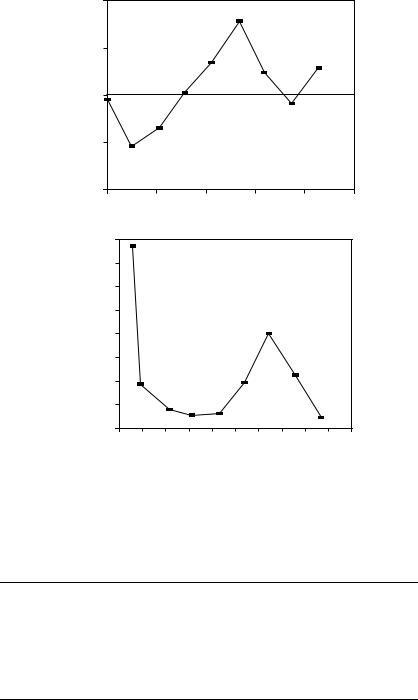
In the absence of wave reflections, the input impedance is equal to the characteristic impedance. Womersley’s analysis predicts that impedance modulus will decrease monotonically with increasing frequency, whereas the phase angle is negative at low frequency and becomes progressively more positive with increasing frequency. Typical values calculated from Womersley’s analysis are shown in Figure 10.1. In the actual circulation, wave reflections cause oscillations in the modulus and phase. Figure 10.2 shows input impedance measured in the ascending aorta of a human. Measurements of input resistance, characteristic impedance, and the frequency of the first minimum in the input impedance are summarized in Table 10.4.
10.4 Velocity Profiles
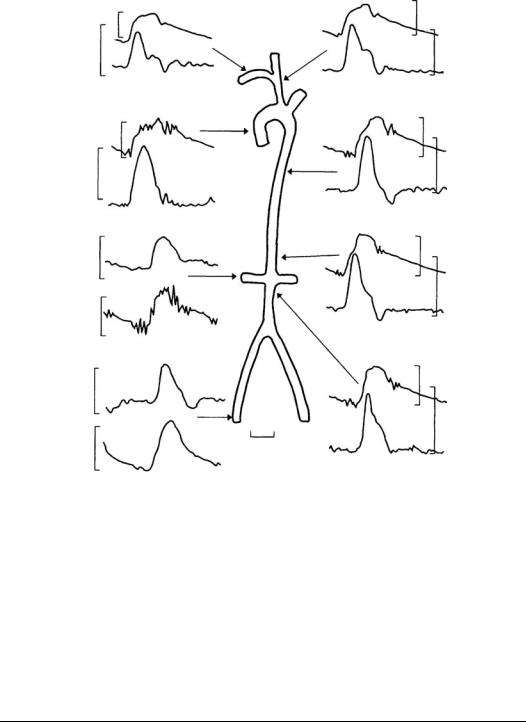
Typical pressure and velocity fluctuations throughout the cardiac cycle in man are shown in Figure 10.3. Although mean pressure decreases slightly toward the periphery due to viscous effects, peak pressure shows small increases in the distal aorta due to wave reflection and vessel taper. A rough estimate of mean pressure can be obtained as 1/3 of the sum of systolic pressure and twice the diastolic pressure.
10-6 |
Biomechanics |
|
0.1 |
|
|
|
|
|
(radians) |
0 |
|
|
|
|
|
|
|
|
|
|
|
|
Phaseangle |
–0.1 |
|
|
|
|
|
–0.2 |
|
|
|
|
|
|
|
|
|
|
|
|
|
|
–0.3 |
|
|
|
|
|
|
0 |
2 |
4 |
6 |
8 |
10 |
|
|
|
Womersley number |
|
|
|
|
5 |
|
|
|
|
|
modulus |
4 |
|
|
|
|
|
|
|
|
|
|
|
|
impedance |
3 |
|
|
|
|
|
2 |
|
|
|
|
|
|
Normalized |
|
|
|
|
|
|
1 |
|
|
|
|
|
|
|
|
|
|
|
|
|
|
0 |
|
|
|
|
|
|
0 |
2 |
4 |
6 |
8 |
10 |
|
|
|
Womersley number |
|
|
|
FIGURE 10.1 Characteristic impedance calculated from Womersley’s analysis. The top panel contains the phase of the impedance and the bottom panel the modulus, both plotted as a function of the Womersley number Nw, which is proportional to frequency. The curves shown are for an unconstrained tube and include the effects of wall viscosity. The original figure has an error in the scale of the ordinate, which has been corrected. (From Milnor, W.R. 1989. Hemodynamics, 2nd ed., p. 172, Baltimore, Williams and Wilkins. With permission.)
Velocity peaks during systole, with some backflow observed in the aorta early in diastole. Flow in the aorta is nearly zero through most of the diastole; however, more peripheral arteries such as the iliac and renal show forward flow throughout the cardiac cycle. This is a result of capacitive discharge of the central arteries as arterial pressure decreases.
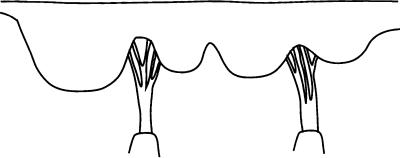
Velocity varies across the vessel due to viscous and inertial effects as mentioned earlier. The velocities in Figure 10.3 were measured at one point in the artery. Velocity profiles are complex because the flow is pulsatile and vessels are elastic, curved, and tapered. Profiles measured in the thoracic aorta of a dog at normal arterial pressure and cardiac output are shown in Figure 10.4. Backflow occurs during diastole, and profiles are flattened even during peak systolic flow. The shape of the profiles varies considerably with mean aortic pressure and cardiac output [Ling et al., 1973].
Arterial Macrocirculatory Hemodynamics |
10-7 |
|
120 |
|
|
|
|
|
(degrees) |
60 |
|
|
|
|
|
|
|
|
|
|
|
|
Phaseangle |
0 |
|
|
|
|
|
–60 |
|
|
|
|
|
|
|
–120 |
|
|
|
|
|
|
0 |
2 |
4 |
6 |
8 |
10 |
|
|
|
Frequency (Hz) |
|
|
|
|
4000.0 |
|
|
|
|
|
|
|
|
|
|
) |
|
|
|
|
|
|
|
|
|
|
|
–5 |
3500.0 |
|
|
|
|
|
|
|
|
|
|
cm |
|
|
|
|
|
|
|
|
|
|
|
|
|
|
|
|
|
|
|
|
|
|
|
(dynes |
3000.0 |
|
|
|
|
|
|
|
|
|
|
2500.0 |
|
|
|
|
|
|
|
|
|
|
|
impedance |
|
|
|
|
|
|
|
|
|
|
|
2000.0 |
|
|
|
|
|
|
|
|
|
|
|
1500.0 |
|
|
|
|
|
|
|
|
|
|
|
of |
1000.0 |
|
|
|
|
|
|
|
|
|
|
Modulus |
|
|
|
|
|
|
|
|
|
|
|
500.0 |
|
|
|
|
|
|
|
|
|
|
|
|
|
|
|
|
|
|
|
|
|
|
|
|
0.0 |
1 |
2 |
3 |
4 |
5 |
6 |
7 |
8 |
9 |
10 |
|
0 |
||||||||||
|
|
|
|
|
Frequency (Hz) |
|
|
|
|
||
FIGURE 10.2 Input impedance derived from the pressure and velocity data in the ascending aorta of Figure 10.3. The top panel contains the modulus and the bottom panel the phase, both plotted as functions of frequency. The peripheral resistance (DC impedance) for this plot was 16,470 dyne sec/cm5. (From Mills C.J., Gabe I.T., Gault J.N. et al. 1970. Pressure–flow relationships and vascular impedance in man. Cardiovasc. Res. 4: 405. With permission.)
TABLE 10.4 Characteristic Arterial Impedances in Some Mammals: Average (±SE)a,b
Species |
Artery |
Rin |
Z0 |
fmin |
Dog |
Aorta |
2809–6830 |
125–288 |
6–8 |
Dog |
Pulmonary |
536–807 |
132–295 |
2–3.5 |
Dog |
Femoral |
110–162c |
4.5–15.8c |
8–13 |
Dog |
Carotid |
69c |
7.0–9.4c |
8–11 |
Rabbit |
Aorta |
20–50c |
1.8–2.1c |
4.5–9.8 |
Rabbit |
Pulmonary |
|
1.1c |
3.0 |
Rat |
Aorta |
153c |
11.2c |
12 |
Abbreviations: Rin, input resistance (mean arterial pressure/flow) in dyn sec/cm5; Z0, characteristic impedance, in dyn sec/cm5, estimated by averaging high-frequency input impedances in aorta and pulmonary artery; value at 5Hz for other arteries, fmin, frequency of first minimum of Zi .
aValues estimated from published figures if averages were not reported.
bRanges for each species and vessel taken from values in Table 7.2 of source.
c103 dyn sec/cm5.
Source: Milnor, W.R. 1989. Hemodynamics, 2nd ed., p. 183, Baltimore, Williams and Wilkins. With permission.
0 |
|
|
|
V |
100 |
|
|
|
|
|
|
|
|
|
P |
|
0.2 sec |
|
0 |
|
|
|
||
60 |
|
|
|
|
10-8 |
|
Right subclavian |
Innominate artery |
Biomechanics |
|
P |
artery |
110 |
|
120 |
|
P |
|
|
60 |
80 |
|
70 |
80 |
V |
|
|
|
V |
0 |
|
|
|
0 |
|
|
Ascending |
Descending |
|
|
P |
aorta |
aorta T7 |
|
|
120 |
|
110 |
|
60 |
|
|
P |
60 |
|
80 |
|
70 |
V |
V |
|
|
|
|
0 |
|
|
|
0 |
|
Right renal artery |
Descending |
|
|
50 |
|
|
aorta T10 |
|
|
|
110 |
||
V |
|
|
P |
80 |
0 |
|
|
70 |
V |
90 |
|
|
|
|
P |
|
|
|
0 |
45 |
Right common |
Abdominal |
|
|
|
Iliac artery |
aorta L1 |
|
|
60 |
|
|
110 |
|
V |
|
|
P |
80 |
|
|
|
70 |
|
FIGURE 10.3 Simultaneous pressure and blood velocity patterns recorded at points in the systemic circulation of a human. Velocities were recorded with a catheter-tip electromagnetic flowmeter probe. The catheter included a lumen for simultaneous pressure measurement; V is the velocity (cm/sec), P is the pressure (mmHg). (From Mills, C.J., Gabe, I.T., Gault, J.N. et al., 1970. Cardiovasc. Res. 40: 405. With permission.)
In more peripheral arteries the profiles are resembling parabolic ones as in fully developed laminar flow. The general features of these fully developed flow profiles can be modeled using Womersley’s approach, although nonlinear effects may be important in some cases. The qualitative features of the profile depend on the Womersley number Nw. Unsteady effects become more important as Nw increases. Below a value of about 2 the instantaneous profiles are close to the steady parabolic shape. Profiles in the aortic arch are skewed due to curvature of the arch.
10.5 Pathology
Atherosclerosis is a disease of the arterial wall that appears to be strongly influenced by hemodynamics. The disease begins with a thickening of the intimal layer in locations that correlate with the shear stress distribution on the endothelial surface [Friedman et al., 1993]. Over time the lesion continues to grow until a significant portion of the vessel lumen is occluded. The peripheral circulation will dilate to compensate