


1
Array Formats
Ralph R. Martel, Matthew P. Rounseville, and Ihab W. Botros, and Bruce E. Seligmann
1.1 Introduction
Arrays have become an increasingly diverse set of tools for biological studies; their use continues to expand rapidly. Likewise, the underlying array technologies, formats and protocols continue to evolve. Investigators can choose from a growing range of options when selecting an array technology that is appropriate for reaching their research objectives. Traditionally, arrays have consisted of collections of distinct capture molecules – typically cDNAs or oligonucleotides – attached to a substrate – usually a glass slide – at predefined locations within a grid pattern [1, 2]. However, today’s formats are more diverse and can be grouped into several categories. Like any categorization e ort, there will be exceptions, crossover technologies and tangential relations. The intent here is only to lay out some general trends.
The classes of capture molecules used in arrays include not only DNA, but also proteins [3], carbohydrates [4], drug-like molecules [5], cells [6], tissues [7] and the like. Array formats vary in their architecture. For closed architecture arrays, the analytes that can be measured are preselected and locked-in during the manufacturing process. In contrast open architecture array technologies allow the set of measured analytes to be modified or allow new analytes to be discovered. Regardless of the architecture, various manufacturing technologies and various substrate materials and coatings are available as are numerous means of attaching capture molecules to substrates. A broad variety of commercially prepared arrays can be purchased. In some instances, the pre-defined grid has been eliminated and replaced with ‘virtual arrays’ of optically encoded beads [8] or of analyte-specific detection labels (e.g. e-Tags; www.aclara.com). Coupled with the diversity of arrayed molecules and array formats is the diversity of detection schemes that include fluorescence, luminescence, electrochemical detection, mass spectrometry, surface plasmon resonance and others.
In spite of the diversity of formats, all arrays share a common feature: Arrays allow multiplexed analyses, that is, arrays allow multiple tests to be
4Ralph R. Martel et al.
performed simultaneously. This is the case both when many analytes are measured simultaneously in an individual sample and also when many samples are tested at one time for an individual analyte. For instance, DNA arrays can be used to determine the expression levels of thousands of genes in an individual biological specimen, while tissue arrays can be used to determine the presence of a specific antigen in hundreds of specimens in a single experiment. Various ‘array–of–arrays’ technologies combine the measurement of numerous analytes across numerous samples.
The impact of array technologies on the life sciences has been important. In conjunction with bioinformatic tools to process and analyze the large amounts of data they generate, arrays have spawned new approaches to systems biology often described with the ‘omics’ su x: genomics, transcriptomics and proteomics, to name a few.
This chapter will provide the rationales for using arrays to address various scientific questions and will outline some of the array technologies developed to fill specific needs. This is a series of examples to illustrate the range of available options and how one technology may be better suited than another to reach a specific research objective, not a comprehensive survey of available tools. The latter part of the chapter will discuss the ArrayPlateTM technology developed by High Throughput Genomics (HTG, Tucson, AZ) to bring the benefits of arrays to the high throughput screening phase of the drug discovery and development process. The procedure for a multiplexed ArrayPlateTM mRNA assay will be described and the results of an mRNA assay and a companion multiplexed ELISA will be presented.
1.2 Reasons to Use Arrays
There are three principle justifications for using array technologies. Arrays serve to discover unique patterns (of gene expression, protein synthesis or post-translational modification, etc.) associated with a particular physiological state. We use the term ‘survey array’ to describe the technologies that are employed for this purpose. ‘Scan array’ or ‘focused array’ refers to the array tools that measure a predefined pattern, previously established with survey arrays. Finally, ‘e ciency array’ refers to the techniques that do not require multiplexing per se, but that take advantage of the parallel processing common to arrays to provide savings of e ort, time and materials or to improve data quality by incorporating internal controls that are measured in each sample. Most array technologies have been developed to achieve one of these three goals and may be ine cient for reaching the other two.
1.2.1 Arrays to Identify Patterns
The best-known array technology, the GeneChip R developed by A ymetrix (Santa Clara, California) is an excellent example of a ‘survey array’. According
1 Array Formats |
5 |
to the company (www.a ymetrix.com), the two arrays in the Human Genome U133 Set contain over one million distinct oligonucleotide features to monitor the expression of 39,000 transcript variants of 33,000 di erent human genes in a single sample. GeneChips R and their cDNA and oligonucleotide array counterparts are widely used to identify genes that are di erentially expressed in diseased tissues or during development or upon treatment with a drug. In most instances, results obtained with DNA arrays show that the vast majority of genes are either not expressed or not a ected by disease. Typically, a disease-specific pattern of gene expression or ‘signature’ is characterized that involves fewer than 50 genes [9–12]. Although well suited to initially define patterns based on the examination of a relatively small number of samples, survey arrays are generally too laborand material-intensive and too costly to be used routinely thereafter in diagnostics or in drug discovery.
1.2.2 Arrays to Measure Patterns
‘Scan arrays’ that measure specific patterns are appropriate for clinical diagnostics and for drug discovery. While these techniques measure fewer analytes than do survey arrays, the analytes have been carefully selected and validated. Other attributes such as ease of use and throughput make various scan array technologies well-suited for particular niches.
Inexpensive readout equipment is a requirement for array-based diagnostic tests as such tests are performed at many di erent sites such as reference laboratories, hospital laboratories and physicians’ o ces but relatively infrequently at any given site. Cost per test however is less important since the results provide information that is of high value. Furthermore, most diagnostic testing is reimbursed by insurers. Hands-on manipulations must be simple as testing is frequently performed by inexperienced personnel. To gain approval from regulatory agencies, diagnostics tests must yield results that are robust and interpretable. For these reasons, various hand-held electronic array devices appear to be in the best position to make inroads in this arena.
In drug discovery, once targets are validated, throughput becomes an important criterion, that is, how rapidly collections of hundreds of thousands of chemical compounds can be tested to identify those compounds that elicit a desired e ect. E ciency in the high throughput screening laboratory is obtained with miniaturization (96–, 384– and 1536–well microplates) and with extensive automation and plate handling robotics. Besides performance criteria such as sensitivity and reproducibility, the success of a technology in this setting depends upon the development of automation-friendly protocols. While substantial expenditures on capital equipment are commonplace, cost per sample is an issue because of the large testing volumes. The ArrayPlateTM described later in this chapter was designed specifically for high throughput screening.
6Ralph R. Martel et al.
1.2.3 Arrays for Parallel Processing
Examples where the array format has been adopted for the e ciencies derived from parallel processing can be found in the combinatorial chemistry literature [13]. The synthesis of chemical compound libraries has been performed in an array format [14]. Indeed, the photolithographic process utilized by A ymetrix to manufacture its DNA chips had its origins in combinatorial chemistry [15]. Arrays of compounds have also been used in drug discovery screening [16]. Microtiter plate wells that contained individual compounds have been miniaturized to the point of vanishing with the compounds becoming elements of an array rather than contents of a well. Generally, using arrays leverages sample preparation e orts. In cell-based assays for instance, the e ort of culturing cells and screening compounds is the same regardless of whether a single or multiple measurements are made.
1.3 Arrays for Nucleic Acid Analysis
Several review articles covering advances and applications of DNA microarray technology have recently been published [17, 18] hence, the same material will not be repeated here. Oligonucleotide and cDNA arrays have di erent strengths and weaknesses. There is more control over the design of oligonucleotide microarrays than there is for cDNA arrays. Consequently, oligonucleotide arrays tend to have more uniform physicochemical characteristics and fewer issues pertaining to cross–hybridization. For cDNA arrays, the capture probes are typically PCR amplicons of clones derived from the organism or the organ of interest. One advantage is that cDNA probes can be incorporated into arrays without further characterization of the underlying gene. For both types of microarrays however, the architecture is closed, albeit at times unknown for cDNA arrays. For illustrative purposes, several less conventional array technologies are described.
1.3.1 Arrays on Beads
The attachment of array moieties to small particles allows multiplexed assays to be performed in three–dimensions rather than on a flat surface. Luminex (Austin, TX) has developed fluorochrome-coded microspheres that can be coated with various classes of ligands. During an assay, a sample is incubated with the beads in solution, allowing the analytes of interest to be captured by their corresponding bead-bound ligands. A fluorescently tagged ‘reporter molecule’ then labels the analyte species. For readout, beads are passed, single file, through a flow cytometry device where the fluorescent tags are illuminated by laser excitation. The resulting fluorescence of both the bead and the reporter molecule are quantified and decoded to yield the identity and quantity
1 Array Formats |
7 |
of the captured molecule. The application of this method to RNA expression analysis has been described recently [8].
Illumina (San Diego, CA) has developed an alternative readout system for bead-based arrays. A manifold of 96 fiber optic bundles, each consisting of about 50,000 individual fibers, is manufactured to fit the standard microplate format. A dimple etched at the end of each fiber can accommodate one of the company’s 3 m beads. This enables fluorochrome excitation and emission of the beads and of fluorescently-labelled analytes through the fiber. The company claims that combinations of fluorescent dyes uniquely identify up to 1,500 beads that can be sampled with 30–fold redundancy to provide a statistical average readout. Presently, the method appears to be used mainly in single nucleotide polymorphism (SNP) genotyping of multiple samples, as reviewed by Oliphant [19].
1.3.2 Electronic Arrays
Array technologies have used electronics to program open architecture systems, to accelerate hybridization kinetics and control stringency, and to detect captured analytes. The NanoChip R (Nanogen, San Diego, CA) incorporates 100 electrode test sites that are coated with a hydrogel containing streptavidin. This system has an open architecture. Programming is with biotinylated target–binding probes that migrate to specific electrodes when a positive charge is applied and that remain bound to the streptavidin afterwards. An electric field is also used to concentrate target molecules at the electrodes to accelerate their hybridization and subsequently, to drive away non-specifically bound materials. Final detection of target is by fluorescence. The eSensorTM DNA detection system (Motorola, Pasadena, CA) uses a selfassembled monolayer (SAM) array of target-specific 22–mer oligonucleotides covalently bound to the gold electrodes of a circuit board [20]. Target nucleic acids hybridized to the array are detected with ferrocene-labelled signaling probes that hybridize with their target next to the capture probe. An applied potential causes the transfer of electrons from the ferrocene to the gold electrode with the measured current quantifying the ferrocene label. SNPs can be detected as perfect hybrids that generate signals at least twofold greater than do single–base mismatches. Both of these technologies have targeted diagnostic applications.
1.3.3 SAGE
Serial analysis of gene expression (SAGE) allows the simultaneous detection and quantification of multiple mRNA species [21, 22] although it is not an array technology per se. SAGE relies on the isolation of unique sequence tags from individual mRNA molecules via a process that includes mRNA isolation, reverse transcription, restriction enzyme digestion, ligation and PCR amplification. The tags are subsequently ligated to form concatamers that
8Ralph R. Martel et al.
are sequenced to reveal both the identity and abundance of expressed genes. Unlike conventional arrays, SAGE can identify novel transcripts.
1.4 Protein Arrays
The development of protein arrays has lagged behind that of DNA arrays primarily because of the greater complexity of proteins. While DNA microarrays have become the tools of choice for characterizing patterns of gene expression, two–dimensional gel electrophoresis remains the standard method for generating ‘protein fingerprints’.
Multiplexed immunoassays are the most developed application for protein arrays. Three strategies have emerged. One is the miniaturization and multiplexing of the standard enzyme linked immunosorbent assay (ELISA), in which capture antibodies are arrayed onto slides or microtiter plates. A variation on this method that requires only a single antibody for each antigen, is to label the proteins in a sample with one fluorochrome and the proteins in a reference sample with a second fluorochrome. The di erentially labelled samples are mixed and incubated with an antibody microarray which is scanned. The ratio of the two fluorescent dyes at each spot in the array corresponds to the relative concentration of each protein in the two samples [23]. Improvements in sensitivity and signal–to–noise ratio will be required for this methodology to become useful for measuring protein changes in biologically relevant samples. A third strategy, which may be particularly useful for diagnostic assays, is to prepare arrays of antigens. Such arrays allow samples to be tested for the presence and the titer of antibodies to particular antigens. This approach lends itself to develop broad–spectrum tests for certain autoimmune diseases and for exposure to infectious agents. As for nucleic acids, bead arrays also lend themselves to proteomic applications.
The technological challenges that remain are the development of specific, high a nity ligands that can be produced on a large scale and in a relatively short time. Distinguishing between various post-translational modifications, such as phosphorylation and amidation, are also technical features that need to be addressed. It is likely that di erent types of protein arrays will be required for cataloging the proteome, detecting di erences in expression, and for screening compounds. For a more extensive review on the development of protein-detecting microarrays and related devices see Kodadek [24] and Schweitzer [3].
The development of arrays of functionally active proteins such as enzymes and receptors is progressing rapidly and the significant advances in this area are the topic of Chaps. 14–16 in this book.
1 Array Formats |
9 |
1.5 The ArrayPlateTM
HTG developed the ArrayPlateTM as a platform technology with an open architecture to conduct a variety of multiplexed assays in microtiter plates. The goal was to extend the capabilities and information content of conventional drug discovery and development assays for two purposes. The first was to provide a technology to allow genomic and transcriptomic e orts to progress from target discovery to drug discovery, that is, from the description of diseasespecific signature patterns of gene expression to the identification of signaturemodulating compounds. How the multiplexed ArrayPlateTM mRNA assay achieves this is discussed. The second purpose was to provide screening laboratories with another means to increase their e ciency as multiplexing is synergistic with both automation and miniaturization to enhance productivity. The multiplexed ELISA serves as an example for this. ArrayPlateTM assays rely on a single hybridization to transition from an open to a closed architecture. The benefits of this hybridization step, termed “reagent programming”, that modifies the binding specificity of each element in a universal array, will be outlined. For the mRNA assay, a multiplexed nuclease protection assay is combined with the capture of processed nuclease protection probes on the array. Enzyme-mediated chemiluminescent detection subsequently quantifies probes in the mRNA assay and antigens in the multiplexed ELISA.
1.5.1 Materials and Methods
ArrayPlateTM Manufacture
The 96–well ArrayPlatesTM contained at the bottom of each well of flatbottom poly-styrene microtiter plate (FalconTM) modified with N–oxysuccini- mide ester, a four–by–four array of 16 distinct oligonucleotide elements 100 µm in diameter and spaced 800 µm on center. Each of the 16 anchor oligonucleotides incorporated a unique 25–mer sequence and was 3 -modified with heptylamine. Arrays were printed with a PixSys 3000 microarrayer equipped with 85 µm inner diameter ceramic dispensing tips (Cartesian Technologies, Irvine, CA) in an environmental chamber (26◦C and 80% relative humidity).
Oligonucleotides and Antibodies
The 16 target human mRNA species each required three oligonucleotides: A nuclease protection probe, a programming linker and a detection linker. These oligonucleotides were designed using ArrayPlateTM Oligo v.3.0 software (HTG, Tucson, AZ) and synthesized (Epoch Biosciences, San Diego, CA and Sigma–Genosys, The Woodlands, TX) as detailed elsewhere [25]. The 16 genes examined were glyceraldehyde 3–phosphate dehydrogenase (GAPDH), interleukin–1β (IL–1β), tumor necrosis factor–α (TNF–α), tubulin, cathepsin G (catG), cyclooxygenase–2 (cox–2), granulocyte colony stimulating factor (G–CSF), granulocyte macrophage colony stimulating factor (GM–CSF),
10 Ralph R. Martel et al.
glutathione S–transferase Pi–1 (GST Pi–1), high mobility group 17 (HMG– 17), cyclophilin (cyclo), β–thromboglobulin (bTG), lactate dehydrogenase (LDH), tissue inhibitor metalloprotease 1 (TIMP–1), matrix metaloproteinase 9 (MMP–9) and β–actin.
Briefly, each programming linker was a 50–mer comprising a 5 25–mer complementary to one of the 16 anchor oligonucleotides and a 3 25–mer complementary to one of the 16 target-specific nuclease protection probes. Each nuclease protection probe was a 65–mer composed of a 50–base sequence with 48% to 52% GC content, complementary to the target mRNA. Each protection probe also incorporated a target-independent 15–mer control sequence. Each detection linker oligonucleotide was a 50–mer designed with a common 3 25–mer sequence and a unique 5 25–mer complementary to the 5 –terminal 25–mer of the corresponding nuclease protection probe. Finally, a detection conjugate of horseradish peroxidase labelled with the 25–mer sequence complementary to the common 3 -end of all detection linkers was used to generate a luminescent signal.
All oligonucleotides were tested before use in an assay by means of a design of experiments protocol that ensured that each oligonucleotide hybridized as intended without showing unintended and interfering binding. The behavior of individual oligonucleotide species was deduced from the observed behavior of predefined oligonucleotide mixtures.
For the antibody assays, ELISA-ready antibody sets, recombinant antigen standards and streptavidin–peroxidase were obtained from R&D Systems (Minneapolis, MN).
Cell Culture and Treatments
The human THP–1 acute monocytic leukemia cell line (ATCC, Manassas, VA) was grown in either T–175 culture flasks or in 96–well V–bottom cell culture plates (Falcon) at 37◦C with 4% (v/v) CO2 and 80% relative humidity in RPMI 1640 medium supplemented with 10% (v/v) fetal bovine serum, 100 U/ml penicillin and 100 µg/ml streptomycin (Hyclone, Logan, UT). Phorbol merystil acetate (PMA) treatment (0.1 µg/ml in RPMI for 48 hours) caused the cells to di erentiate to adherent monocytes.
Cells activation was induced with four hours of treatment with 1 µg/ml bacterial lipopolysaccharide (LPS) (Sigma, St. Louis, MO) in culture medium. Dexamethasone (Sigma, St. Louis, MO) treatments were with compound dissolved at various concentrations in culture medium. Cells growing in suspension in microtiter plates were harvested by centrifugation at 180× g for 5 minutes (GS15, Beckman Coulter, Fullerton, CA). Removal of culture medium from cell pellets and from adherent cells in wells was by aspiration.
Multiplexed Nuclease Protection Assay
All reagent additions were performed with a 96–channel Biomek FX automated pipettor (Beckman Coulter, Fullerton, CA). Media-free THP–1 cells
1 Array Formats |
11 |
in 96–well culture plates received in rapid succession 30 l/well lysis solution (HTG, Tucson, AZ) that contained each of the 16 nuclease protection probes at 30 pM and 60 l/well mineral oil (Sigma, St. Louis, MO). The plates were incubated for 10 minutes at 95◦C, for 6 hours at 70◦C and were allowed to cool to room temperature for 10 minutes. The plates received 20 l/well S1 nuclease solution (50 S1 units in 1.4 M sodium chloride, 22.5 mM zinc sulfate, 250 mM sodium acetate, pH 4.5) (Promega, Madison, WI) and were incubated for 30 minutes at 50◦C. The plates received 10 l/well 1.6 M sodium hydroxide, 135 mM EDTA and were heated for 15 minutes at 95◦C. After cooling at room temperature for 15 minutes, the plates received 10 l/well Neutralizing Solution (1 M HEPES, pH 7.5, 1.6 M HCl, 6× SSC). For each well, 60 l of the 70 l aqueous subphase was transferred from the cell culture plate to a programmed (i.e. programming linker-modified) ArrayPlateTM, followed immediately by the additional transfer of 60 l of aqueous subphase and overlayering oil.
Reagent Modification of Universal Arrays
The washing of ArrayPlatesTM was completed in 60 seconds with a 96–channel plate washer (ELx405 Auto Plate Washer, Bio–Tek Instruments, Minooski, VT) and consisted of six dispenses and aspirations of 300 l/well 1× SSC (150 mM sodium chloride, 15 mM sodium citrate, pH 7) with 0.1% (v/v) Tween–20 (Sigma, St. Louis, MO).
Following a wash cycle, the ArrayPlatesTM received 50 l/well programming linker solution that consisted of each of the 16 programming linker oligonucleotides at 5 nM in SSCS (1× SSC, 0.1% (w/v) SDS). After a onehour hybridization at 50◦C, the ArrayPlatesTM were washed again. These were programmed (i.e. programming linker-modified) ArrayPlatesTM.
Capture and Detection of Protection Probes on the ArrayPlateTM
Programmed ArrayPlatesTM containing nuclease protection-processed cell lysates were incubated overnight at 50◦C and washed. The ArrayPlatesTM received 50 l/well detection linker solution that contained each of the 16 detection linker oligonucleotides 5 nM in SSCS. The plates were incubated for one hour at 50◦C and washed. Next, the ArrayPlatesTM received 50 l/well detection enzyme conjugate solution and were incubated for 30 minutes at 37◦C followed by a wash. Detection enzyme conjugate solution contained 10 nM detection enzyme conjugate in SSCS. The ArrayPlatesTM received 50 l/well chemiluminescent peroxidase substrate (Atto–PSTM Lumigen, Southfield, MI) and were imaged from the bottom with an Omix CCD imager (HTG, Tucson, AZ) for 30 seconds to 6 minutes, depending on signal intensity, within 30 minutes of substrate addition.
12 Ralph R. Martel et al.
Image Analysis
Digital images of ArrayPlatesTM were analyzed with software (ArrayPlateTM Fit v.3.31a, HTG, Tucson, AZ) that extracted luminescence intensity data for each array element in a plate. The resulting data were exported as comma-separated value (CSV) files that were processed further with software (ArrayPlateTM Crunch, HTG, Tucson, AZ) that allowed manipulation of the intensity data, for instance, to normalize signals within arrays to any combination of array elements. Intensity data CSV files were also imported into Excel spreadsheets (Microsoft, Redmond, WA) for further analysis.
1.5.2 Results and Discussion
Reagent Programming of Universal Arrays
The 96–well ArrayPlatesTM contain the same universal array of 16 distinct elements printed at the bottom of each well. Each element consists of a positionspecific, covalently bound ‘anchor’ species that incorporates an oligonucleotide 25–mer recognition feature. Since identical arrays are printed across all wells of all plates, the manufacture of ArrayPlatesTM is standardized and subject to rigorous quality control procedures.
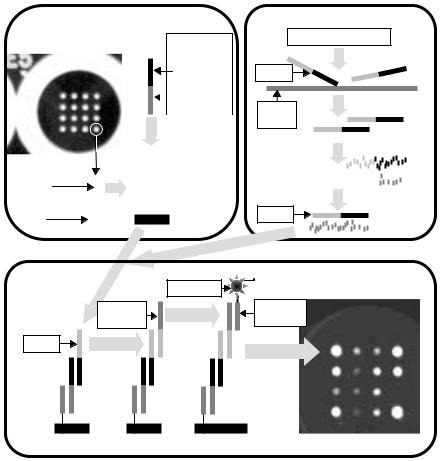
In spite of this standardized production, ArrayPlatesTM provide an open architecture to allow customized assays: A ‘reagent programming’ hybridization immobilizes specific capture reagents at preselected positions in the universal array. This is achieved using a cocktail that contains 16 bifunctional ‘programming linker’ species. Each programming linker contains both an oligonucleotide complementary to a specific anchor and an analyte-specific region. Thus, the hybridization of linkers to anchors immobilizes analyte-specific reagents at predetermined positions within the array (Fig. 1.1, top left panel).
Reagent programming provides versatility. The analyte-specific region of a programming linker can be an oligonucleotide, a peptide, a protein or a chemical compound, depending upon the type of assay that is to be performed: Programming linkers that consist of antibody conjugated to anchor-binding oligonucleotide are suited for multiplexed ELISAs or for setting up arrays of antigens. Programming linkers that have two oligonucleotide regions serve to capture target RNA, DNA or oligonucleotides. Conjugates of anchor-binding oligonucleotide and substrate peptides can be used for instance, for multiplexed kinase and phosphatase assays. With reagent programming, di erent combinations of assay capacity versus content become possible. For example, the user can program all the wells in a plate identically to measure 16 targets per sample across 96 samples. Alternatively, by programming arrays in pairs and splitting samples across two wells, 32 targets (16×2) can be measured in 48 samples (96÷2).
Reagent Programming
Programming
Linker
3’
ArrayPlate Well
Analyte-Binding
Domain
 Anchor-Binding
Domain
|
|
|
|
|
|
|
|
5’ |
|
|
|||
|
|
|
|
|
|
|
|
|
|
||||
|
|
|
|
|
|
|
Hybridization |
||||||
|
|
|
|
|
|
|
|
|
|
|
|
3’ |
|
|
|
|
|
|
|
|
|
|
|
|
|
||
|
|
|
|
|
|
|
|
|
|
|
|
||
Position-Specific |
|
|
|
|
|
|
|
|
|
|
|
||
|
Anchor |
5’ |
|
|
5’ |
|
I |
|
|
|
|
||
|
|
|
|
|
|
|
|||||||
|
Oligonucleotide |
|
|
|
|
|
|
I I |
|
|
|
|
|
|
|
|
3’ |
|
|
3’ |
|
I I I |
|
|
5’ |
||
|
|
|
|
|
|
|
|
||||||
|
Plate |
|
|
|
|
||||||||
|
|
|
|
|
|
|
|
|
|
|
|
|
|
|
Surface |
|
|
|
|
|
|
|
I I |
|
|
||
|
|
|
|
|
|
|
|
|
|
||||
|
|
|
|
|
|
|
|
|
I I I |
|
|
||
1 Array Formats |
13 |
Nuclease Protection Assay
Cells in Microplate Wells
Denaturation in Lysis Buffer with Probes
Probe
Hybridization
Target
mRNA
II |
I |
IIII |
IIII |
III |
II |
IIIII |
|
|
|
|
|
|
|
S1 Nuclease Digestion
II |
III |
IIII |
|
II |
|
|
|
|
|
|||
|
IIIII |
III |
II |
|
|
|||||||
|
|
|
|
|
|
|
|
|
|
|
|
|
Alkaline Hydrolysis
Probe
Probe Quantification |
Light |
|
Peroxidase |
|
|
|
|
|
|
|
3’ |
|
|
|
|
3’ |
I |
5’ |
|
|
|
|
Detection |
|
|
Hybridization |
|
I |
Detection |
||||
|
|
|
|
Linker |
|
|
|
|
I I |
Conjugate |
||||
|
|
|
|
|
|
|
|
|
|
|
|
|||
|
|
5’ |
|
|
|
5’ |
I |
|
|
|
5’ |
I |
I I |
3’ |
Probe |
|
|
|
Hybridization |
|
I I |
|
|
|
|
I I |
I I |
|
|
|
|
|
|
|
|
|
I |
|
|
|
|
I |
I |
Image |
|
|
II |
|
|
|
II |
II I |
5’ |
|
|
II |
II I |
II |
|
|
3’ |
|
|
3’ |
|
3’ |
5’ |
|||||||
|
|
|
|
|
|
|
|
|
|
|||||
5’ |
|
I I I |
3’ |
5’ |
|
I I I |
I I I |
|
5’ |
|
I I I |
I I I |
3’ |
|
I I |
I I |
I I |
I I |
3’ |
|
I I |
I I |
|
|
|||||
|
|
|
I |
|
|
I |
|
|
||||||
3’ |
I I I |
I I I |
|
3’ |
I I I |
I I I |
5’ |
|
3’ |
I I I |
I I I |
5’ |
|
|
I |
5’ |
|
I |
I |
|
I |
|
|
|
|||||
|
I |
|
|
|
|
|
I |
|
|
|
||||
|
I I I I I |
|
|
|
I I I I I |
|
|
|
|
I I I I I |
|
|
|
|
Fig. 1.1. ArrayPlateTM mRNA Assay Principles. Upper left: Reagent programming modifies the binding specificity of each array element via the hybridization of a bifunctional programming linker to an anchor oligonucleotide. Upper right: A multiplexed nuclease protection assay preserves a stoichiometric quantity of oligonucleotide probe while destroying target mRNA. Bottom: Probe surviving the nuclease protection assay is immobilized by hybridization with its corresponding array-bound programming linker. Probe bound to the array in this manner is labelled in succession with detection linker oligonucleotide and peroxidase-containing detection conjugate. The light generated upon the addition of chemiluminescent peroxidase substrate is imaged with a CCD camera

14 Ralph R. Martel et al.
Table 1.1. ArrayPlateTM mRNA Assay Protocol Multiplexed Nuclease Protection
Media-free cells in a 96–well plate
Add |
30 l/well |
Lysis Solution with NPA Probes |
Add |
60 l/well |
Overlayering Oil |
Incubate |
for 10 minutes |
at 95◦C |
Incubate |
for 6 hours |
at 70◦C |
Add |
20 l/well |
S1 Nuclease Solution |
Incubate |
for 30 minutes |
at 50◦C |
Add |
10 l/well |
Hydrolysis Solution |
Incubate |
for 15 minutes |
at 95◦C |
Incubate |
for 15 minutes |
at RT |
Add |
10 l/well |
Neutralizing Solution |
Probe Detection in ArrayPlateTM |
||
|
|
|
Add |
50 l/well |
Programming Linker Solution |
Incubate |
for 1 hour |
at 50◦C and wash |
Transfer |
60 l/well |
aqueous phase to ArrayPlateTM |
Receive |
60 l/well |
aqueous phase from culture plate |
Transfer |
60 l/well |
Overlayering Oil to ArrayPlateTM |
Receive |
60 l/well |
Overlayering Oil from culture plate |
Incubate |
overnight |
at 50◦C and wash |
Add |
50 l/well |
Detection Linker Solution |
Incubate |
for 1 hour |
at 50◦C and wash |
Add |
50 l/well |
Detection Probe Solution |
Incubate |
for 30 minutes |
at 37◦C and wash |
Add |
50 l/well |
Luminescent Substrate |
Image
Expression Profiling
The multiplexed mRNA assay is a cell-based assay designed for the primary and follow-up screening of compound libraries. This required that the assay be capable of establishing structure–activity relationships (SAR) to correlate molecular features of screened compounds with their e ects on the expression of target genes. Furthermore, assay protocols had to be automation-friendly. Both were achieved with a multiplexed solution–phase nuclease protection assay (NPA) that required only reagent additions and incubations and that avoided RNA isolation, reverse transcription, target amplification and fluorescent labelling.
The NPA served to convert labile target mRNA molecules to stoichiometric amounts of stable oligonucleotide probes (Fig. 1.1, top right panel); protocol details are provided in Table 1.1 Cells were grown in 96–well plates and treated with compounds. Following the treatment, culture media was removed and the cells were lysed with a solution that contained a large excess of nuclease protection probes complementary to each of the 16 target mRNA
1 Array Formats |
15 |
species. A heat denaturation step served to inactivate endogenous nucleases and to remove secondary structure in the target mRNA species. During a subsequent incubation, probe hybridized to mRNA. S1 nuclease, an enzyme that specifically cleaves single-stranded nucleic acids [26–28], was added to digest excess probes and unhybridized mRNA, leaving only duplexes of probe and mRNA intact. An alkaline hydrolysis simultaneously inactivated the S1 nuclease and destroyed the RNA component of the mRNA:probe duplexes. Upon neutralization of the samples, nuclease protection probes remained in amounts proportional to the concentration of the complementary target mRNA species that had been present in the original cell sample. These probes were subsequently quantified with an ArrayPlateTM. Since all nuclease protection probes were designed to have similar lengths and GC content regardless of their target genes, various probes showed similar behaviors in the assay and consequently, a standardized NPA protocol could be used.
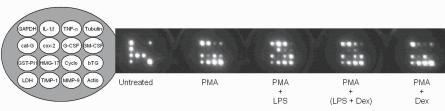
Fig. 1.2. Treatment-Dependent Gene Expression Patterns. The 16 genes that were measured are shown on the left. Five adjacent wells in an ArrayPlateTMare shown on the right. Each well contained sample from 30,000 THP–1 monocytes subjected to a particular regimen involving combinations of treatment with the phorbol ester PMA, with bacterial lipopolysaccharide (LPS) and with dexamethasone (Dex). Each treatment resulted in a distinct pattern of gene expression
The probe-containing hydrolysate resulting from the NPA was transferred from the cell culture plate to a reagent-programmed ArrayPlateTM (Fig. 1.1, lower panel). Array-bound programming linkers captured the various nuclease protection probes at specified elements within the array. Each 50–mer nuclease protection probe was bound by its 3 –terminal 25–mer to its complementary programming linker. The exposed 5 –terminal 25–mer of each probe was subsequently labelled by hybridization with a specific detection linker oligonucleotide. Each of the 16 di erent 50–mer detection linkers contained a common 3 25–mer in addition to a 5 25–mer specific to one of the probes. The common 3 25–mer of the detection linkers served to bind a final oligonucleotide that was conjugated to horseradish peroxidase. Thus, a five-layered sandwich hybridization took place at each element: Anchor to programming linker to nuclease protection probe to detection linker to peroxidase conjugate. The amount of peroxidase immobilized at a given array element was
16 Ralph R. Martel et al.
determined by the amount of nuclease protection probe bound there as this probe was the limiting reagent.
Upon the addition of chemiluminescent peroxidase substrate, light was generated at each array element in proportion to the amount of peroxidase immobilized there. Within 30 minutes of substrate addition, the entire ArrayPlateTM was imaged for 30 seconds to 6 minutes with a high resolution CCD imager. The digital images of ArrayPlatesTM were analyzed with image analysis software that reported the signal intensity for each element in a plate after correcting the intensity for local background and, when applicable, for the contribution of adjacent elements.
Changes in the patterns of expression of 16 genes in THP–1 monocytes subjected to various treatment regimens are shown in Fig. 1.2. Various treatments were useful to establish performance characteristics for the assay.
Performance Characteristics
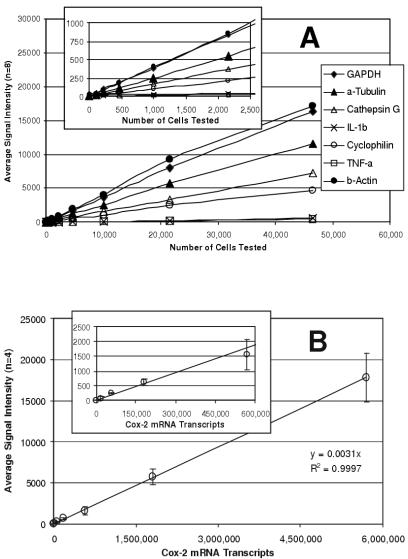
Sensitivity was determined by examining serial dilutions of a bulk lysate of LPS-stimulated THP–1 monocytes. The assay was linear for all expressed target genes over a broad range of sample sizes (Fig. 1.3a) and, more importantly, expression ratios between genes remained constant. Useful gene expression data could be obtained from samples of 1,000 cells or fewer. However, the assay was most robust for samples ranging from 25,000 to 50,000 cells.
To determine the absolute sensitivity of the assay, quantified cox–2 mRNA obtained by in vitro transcription was tested (Fig. 1.3b). Here too, assay response was linear over the entire range that was tested (up to nearly 6,000,000 molecules) with the best fit linear regression showing a coe cient of correlation greater than 0.99. As few as 150,000 cox–2 mRNA molecules were detectable. Similar sensitivities were observed with in vitro transcripts of other genes (data not shown). The reproducibility of the mRNA assay was determined for each target using 30,000 cells/well samples of untreated THP–1 cells (n=48) and cells treated with PMA and LPS (n=48). The data for each well were normalized to GAPDH (the housekeeping gene for these experiments) and the coe cient of variability (CV, i.e. standard deviation as a percentage of the average) was determined for each gene (Table 1.2). The average CV was 6.4% for untreated cells and 7.6% for treated cells, ranging from a low of 3% for cathepsin G in untreated cells to a high of 13% for GST Pi–1 and cyclophilin in treated cells.
Antibody Array
In a proof–of–principle study, a companion multiplexed ELISA was established to simultaneously quantify five antigens (IL–1β, TNFα, G-CSF, MCP–1 and IL–8). The antigens were selected based on the availability of an ArrayPlateTM mRNA assay for the corresponding genes and of commercial ELISA reagents. The commercial kits contained capture antibody, biotinylated detection antibody, streptavidin–peroxidase conjugate and recombinant antigen standard.
1 Array Formats |
17 |
(a)
(b)
Fig. 1.3. Sensitivity of the mRNA Assay. (a) Serial dilutions of LPS-stimulated cells were analyzed. The linear response for seven of the target genes is shown with the low range enlarged in the insert. (b) Serial dilutions of cox–2 mRNA obtained by in vitro transcription were analyzed. The error bars show the standard deviation (n=4) of signal intensity at each concentration

18 Ralph R. Martel et al.
Table 1.2. Reproducibility of the mRNA Assay
GENE |
|
UNTREATED CELLS TREATED CELLS |
|||
|
|
|
|
|
|
|
|
Average |
|
Average |
|
Name |
Accession Signal |
%CV |
Signal |
%CV |
|
|
Number |
(n=48) |
|
(n=48) |
|
GAPDH |
M17851 |
1000 |
6% |
1000 |
9% |
IL–1β |
M15840 |
– |
– |
1778 |
5% |
TNF–α |
M10988 |
– |
– |
1416 |
4% |
Tubulin |
AF141347 |
224 |
7% |
80 |
10% |
Cathepsin G |
M16117 |
510 |
3% |
– |
– |
Cox 2 |
M90100 |
– |
– |
791 |
6% |
G–CSF |
E01219 |
– |
– |
103 |
8% |
GM–CSF |
E02975 |
– |
– |
77 |
10% |
GST Pi–1 |
X06547 |
79 |
10% |
35 |
13% |
HMG–17 |
M12623 |
541 |
6% |
– |
– |
Cyclophilin |
X52851 |
333 |
10% |
251 |
13% |
β–Thromboglobulin M17017 |
– |
– |
895 |
6% |
|
LDH |
X02152 |
228 |
5% |
268 |
7% |
TIMP–1 |
X03124 |
– |
– |
833 |
6% |
MMP–9 |
J05070 |
– |
– |
1117 |
4% |
Actin |
M10277 |
1231 |
4% |
1000 |
5% |
AVERAGE: |
|
|
6.4% |
|
7.6% |
|
|
|
|
|
|
Performance Characteristics
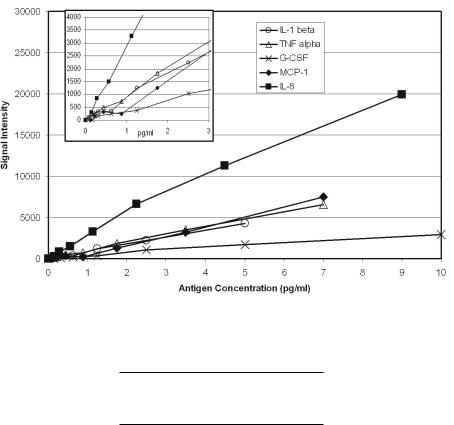
The recombinant standards were used to establish the specificity of each of the five antibody sets in the array and to determine the sensitivity and reproducibility of the assay. Figure 1.4 shows the five sensitivity curves that were obtained. For each of the five antigens, the sensitivity of the multiplexed assay was approximately the same as reported by the antibody supplier for the corresponding traditional ELISA and ranged from less than 0.5 pg/ml for IL–8 to approximately 2 pg/ml for G–CSF. To determine the reproducibility of the multiplexed ELISA, a solution that contained each of the five antigens at 5 pg/ml was analyzed in 36 replicate wells. Data were normalized to 10,000 luminescence counts per well and assigned to each of the five elements according to their relative intensities. CV values ranged from 7% for IL–8 to 15% for MCP–1 (Table 1.3).
Examples
To illustrate the high content that is achievable with multiplexed assays, samples of 30,000 THP–1 cells per well were treated with PMA and examined over time. Secreted and intracellular protein profiles were obtained with the multiplexed ELISA while the ArrayPlateTM mRNA assay served to monitor gene expression. Secreted proteins were measured in the culture medium
1 Array Formats |
19 |
Fig. 1.4. Sensitivity of the Multiplexed ELISA. Serial dilutions of recombinant antigen standards were tested. The sensitivity curves are shown
Table 1.3. Reproducibility of the multiplexed ELISA
AVERAGE
ANTIGEN SIGNAL S.D. %C.V. (Normalized)
IL–1β |
1,646 |
192 |
12% |
TNF–α |
1,685 |
129 |
8% |
G–CSF |
973 |
102 |
10% |
MCP–1 |
1,415 |
214 |
15% |
IL–8 |
4,281 |
280 |
7% |
|
|
|
|
while mRNA and intracellular proteins were measured in cell lysate. Eight replicates (one column in a 96– well plate) were examined at each of six time points. Results for IL–1β are shown in Fig. 1.5. The induction of IL–1β mRNA, the intracellular accumulation IL–1β and the secretion of protein could all be measured for samples derived from individual wells. Additionally, similar data were obtained for four other proteins and 15 additional genes.
1.6 Conclusion
Arrays encompass a range of technologies to conduct multiplexed assays. The ArrayPlateTM platform is aimed at bringing the benefits of arrays to the
20 Ralph R. Martel et al.
Fig. 1.5. mRNA and Protein Levels Following Treatment. THP–1 monocytes were examined at di erent intervals following treatment with PMA. mRNA and intracellular proteins were measured in cell lysate while secreted proteins were measured in the culture media. The results obtained for IL–1β are shown. The error bars show the standard deviations for eight replicates at each time point
drug discovery process. The ArrayPlateTM mRNA assay is an automationcompatible method for quantifying 16 genes simultaneously with a sensitivity of 150,000 molecules and reproducibility of <10% average CV. The use of reagent-modifiable arrays and of whole–plate imaging of chemiluminescent read-out signals are features that will allow this multiplexed format to be applied to a variety of high throughput screening assays.
References
1.Lockhart DJ, Dong H, Byrne MC, Follettie MT, Gallo MV, Chee MS, Mittmann M, Wang C, Kobayashi M, Horton H, Brown EL (1996) Expression monitoring by hybridization to high–density oligonucleotide arrays. Nat Biotechnol 14:1675– 80
2.Wodicka L, Dong H, Mittmann M, Ho MH, Lockhart DJ (1997) Genome–wide expression monitoring in Saccharomyces cerevisiae. Nat Biotechnol 15:1359–67
3.Schweitzer B, Kingsmore SF (2002) Measuring proteins on microarrays. Curr Opin Biotechnol 13:14–9
4.Love KR, Seeberger PH (2002) Carbohydrate arrays as tools for glycomics. Angew Chem Int Ed Engl 41:3583–6, 3513
5.Lam KS, Renil M (2002) From combinatorial chemistry to chemical microarray. Curr Opin Chem Biol 6:353–8
1 Array Formats |
21 |
6.Wu RZ, Bailey SN, Sabatini DM (2002) Cell–biological applications of transfected–cell microarrays. Trends Cell Biol 12:485–8
7.Fejzo MS, Slamon DJ (2001) Frozen tumor tissue microarray technology for analysis of tumor RNA, DNA, and proteins. Am J Pathol 159:1645–50
8.Yang L, Tran DK, Wang X (2001) BADGE, Beads Array for the Detection of Gene Expression, a high–throughput diagnostic bioassay. Genome Res 11:1888– 98
9.Tung WS, Lee JK, Thompson RW (2001) Simultaneous analysis of 1176 gene products in normal human aorta and abdominal aortic aneurysms using a membrane–based complementary DNA expression array. J Vasc Surg 34:143– 50
10.Golub TR, Slonim DK, Tamayo P, Huard C, Gaasenbeek M, Mesirov JP, Coller H, Loh ML, Downing JR, Caligiuri MA, Bloomfield CD, Lander ES (1999)
Molecular classification of cancer: class discovery and class prediction by gene expression monitoring. Science 286:531–7
11.Hedenfalk I, Duggan D, Chen Y, Radmacher M, Bittner M, Simon R, Meltzer P, Gusterson B, Esteller M, Kallioniemi OP, Wilfond B, Borg A, Trent J (2001)
Gene–expression profiles in hereditary breast cancer. N Engl J Med 344:539–48
12.Heller RA, Schena M , Chai A, Shalon D, Bedilion T, Gilmore J, Woolley DE, Davis RW (1997) Discovery and analysis of inflammatory disease–related genes using cDNA microarrays. Proc Natl Acad Sci USA 94:2150–5
13.Blackwell HE, Perez L, Stavenger RA, Tallarico JA, Cope Eatough E, Foley MA, Schreiber SL (2001) A one–bead, one–stock solution approach to chemical genetics: part 1. Chem Biol 8:1167–82
14.LeProust E, Pellois JP, Yu P, Zhang H, Gao X, Srivannavit O, Gulari E, Zhou X (2000) Digital light–directed synthesis. A microarray platform that permits rapid reaction optimization on a combinatorial basis. J Comb Chem 2:349–54
15.Fodor SP, Read JL, Pirrung MC, Stryer L, Lu AT, Solas D (1991) Light–directed, spatially addressable parallel chemical synthesis. Science 251:767–773
16.David CA, Middleton T, Montgomery D, Lim HB, Kati W, Molla A, Xuei X, Warrior U, Kofron JL, Burns DJ (2002) Microarray compound screening (microARCS) to identify inhibitors of HIV integrase. J Biomol Screen 7:259–66
17.Heller JH (2002) DNA microarray technology: devices, systems, and applications. Annu Rev Biomed Eng 4:129–53
18.Shoemaker DD, Linsley PS (2002) Recent developments in DNA microarrays. Curr Opin Microbiol 5:334–337
19.Oliphant A, Barker DL, Stuelpnagel JR, Chee MS (2002) BeadArray technology: enabling an accurate, cost–e ective approach to high–throughput genotyping. Biotechniques Suppl 32:56–61
20.Umek RM, Lin SW, Vielmetter J, Terbrueggen RH, Irvine B, Yu CJ, Kayyem JF, Yowanto H, Blackburn GF, Farkas DH, Chen YP (2001) Electronic detection of nucleic acids: a versatile platform for molecular diagnostics. J Mol Diagn 3:74–84
21.Velculescu VE, Zhang L, Vogelstein B, Kinzler KW (1995) Serial Analysis of Gene Expression. Science 270: 484–487
22.Bertelson AH, Velculescu VE (1998) High–throughput Gene Expression Analysis Using SAGE. Drug Discovery Today 3:152–159
23.Haab BB, Dunham MJ, Brown PO (2001) Protein microarrays for highly parallel detection and quantitation of specific proteins and antibodies in complex solutions. Genome Biol 2:research0004.1–0004.13
22 Ralph R. Martel et al.
24.Kodadek T (2002) Development of protein–detecting microarrays and related devices. Trends Biochem Sci 27:295–300
25.Martel RR, Botros IW, Rounseville MP, Hinton JP, Staples RR, Morales DA, Farmer JB, Seligmann BE (2002) Multiplexed screening assay for mRNA combining nuclease protection with luminescent array detection. Assay Drug Dev Tech 1:61–71
26.Berk AJ, Sharp PA (1977) Sizing and mapping of early adenovirus mRNAs by gel electrophoresis of S1 endonuclease–digested hybrids. Cell 12:721–32
27.Maxwell IH, Van Ness J, Hahn WE (1978) Assay of DNA–RNA hybrids by S1 nuclease digestion and adsorption to DEAE–cellulose filters. Nucleic Acids Res 5:2033–8
28.Wittelsberger SC, Hansen JN (1977) The specificity of S1 nuclease toward RNA– DNA hybrids as studied using isotopes of phosphorus–32 and phosphorus–33. Nucleic Acids Res 4:1829–35