


13
Analysis of Gene Regulatory Circuits
Zirong Li
13.1 Introduction
The gene regulatory circuitry controls the gene expression programs and permits a cell to grow, di erentiate, and maintain normal functions within the tissues and organs [1]. It consists of two components: the transcription factors that bind to DNA and regulate expression of neighboring genes, and the cisregulatory elements that are bound by transcription factors. Typically, a gene has a promoter that can be recognized by multiple transcription factors, and specific expression of the gene is determined by a combination of these factors that bind to the promoter [2, 3]. Simultaneous binding of multiple transcription factors to the promoter is usually required to turn the gene on or o . Once bound to the target genes, the transcription factors recruit chromatin modification complexes or the transcription machinery to activate or repress gene expression [4].
Malfunction of the gene regulatory circuitry is a major cause of human diseases. More than 50 transcription factors have now been linked to genetic lesions that occur in human cancers. In order to understand the molecular basis of cancer, it is necessary to identify the set of genes directly controlled by these regulators. The analysis of the gene regulatory network is not only of substantial medical importance, but also a central problem in biology. Identification of the complete set of target genes for a transcription factor is essential to decode the gene expression programs that produce living cells.
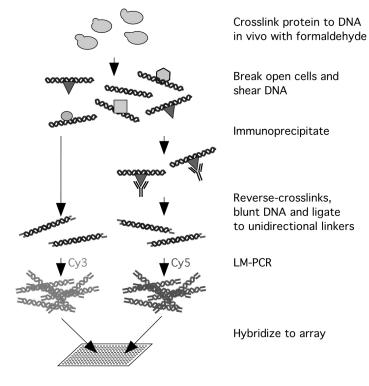
With the availability of complete genome sequences for many organisms and advances in DNA microarray technologies, a method has recently been developed to directly examine the interactions between transcription factors and their target sites in the genome [5, 6]. This technique, known as genome wide location analysis, combines a conventional chromatin immunoprecipitation protocol with microarray technologies to determine the genomic regions that a DNA binding protein recognizes in vivo. It contains four steps: chromatin immunoprecipitation (ChIP), ligation-mediated PCR (LM–PCR), hybridization and microarray analysis (Fig. 13.1).
266 Zirong Li
Fig. 13.1. A schematic diagram of the genome wide location analysis
Chromatin immunoprecipitation (ChIP) is a method widely used to study in vivo protein–DNA interactions [7, 8]. Traditionally, this approach has been used to confirm whether a transcription factor is binding to a particular DNA sequence in vivo. Using this method, living cells are first treated with formaldehyde, and then broken apart. The chromosomes are sheared by sonication, and the cross-linked chromatin DNA fragments are immunoprecipitated using a specific antibody against the transcription factor. The enrichment of a particular sequence in the immunoprecipitates is tested by PCR with a pair of gene-specific primers and visualized using gel electrophoresis.
To identify the genomic regions enriched through the ChIP procedure, the immunoprecipitated DNA is amplified through ligation-mediated PCR. Then the DNA is labelled with fluorescent dyes and hybridized to DNA microarrays representing genomic regions of an organism. As a control, the genomic DNA prior to immunoprecipitation is processed in parallel, labelled using a di erent fluorescent dye and hybridized to the same array. The spots that show a significantly stronger signal in the IP-enriched DNA channel would indicate that the corresponding genomic regions are bound by the transcription factor in vivo.
13 Analysis of Gene Regulatory Circuits |
267 |
The genome wide location analysis is emerging as a powerful approach to analyze the genetic regulatory network in cells. It has been successfully used to identify target genes for a number of yeast and mammalian transcription factors [5, 6, 9–11]. For example, the method was first used to characterize the yeast Gal4 protein, a transcription regulator of the galactose metabolism pathway. All of the previously known Gal4 targets were identified, and three novel targets were found and confirmed by independent methods [5]. In another study, Simon [10] used the genome wide location analysis to investigate nine transcription factors that play a role during the yeast cell cycle progression. The results revealed a genetic regulatory network that appears to control the sequential activation of cyclins and other cell cycle regulators. Interestingly, each of these nine transcription factors was found to be a transcriptional target for this network.
Most recently, more than 100 known yeast transcription regulators were characterized using the genome wide location analysis and their targets identified [12]. The target genes for these regulators, which account for nearly all the known yeast transcription factors, were experimentally mapped. The information led to the discovery of six types of regulatory circuitry motifs, which appear to be the basic unit of genetic regulatory networks. This work represents the first comprehensive description of a genetic regulatory network in an organism [12].
The genome wide location analysis has also proved useful to study mammalian transcription factors [11, 13]. One of the main challenges in applying genome wide location analysis to mammalian cells is the availability of DNA microarrays that represent the whole genome. Because the human cells contain more than three billion base pairs per haploid genome, the cost to manufacture DNA microarrays to cover the entire genome is currently very high. Alternatives to the whole genome arrays have been developed. For example, Ren [11] developed DNA microarrays that represent human gene promoters, based on the assumption that these are the most important regulatory regions in the genome [11]. These arrays have been used to identify the target genes for E2F, regulators of mammalian DNA replication and cell cycle [11]. Most known E2F targets were identified in this study. In another approach, genomic DNA libraries enriched for CpG islands were used to make DNA microarrays [13]. Since most human genes have CpG islands in their promoters, such arrays can also be used to identify potential target genes for human transcription factors.
In this chapter, a genome wide location analysis protocol is described. The application of this protocol to the human E2F factor is also demonstrated.
268 Zirong Li
13.2 An Experimental Protocol
for Genome Wide Location Analysis
This section describes a detailed protocol for genome wide location analysis. The protocol has been used to analyze the in vivo DNA binding sites for human transcription factors. With minor modifications, this protocol can also be used to study DNA binding proteins in other cell types or organisms.
13.2.1 Materials
•Distilled water (dH2O)
•5 × 10⁸ WI38 cells, of human lung fibroblast origin
•DNA microarrays containing DNA fragments corresponding to human gene promoters
•Rabbit polyclonal antibodies against the transcription factor of interest
•Sheep anti-rabbit IgG conjugated dynabeads (Dynal, Cat# 112.04)
•Crosslinking solution (11% formaldehyde, 0.1 M NaCl, 1 mM Na–EDTA,
0.5mM Na–EGTA, 50 mM Hepes, pH 8.0)
•2.5 M glycine solution
•PBS (137 mM NaCl, 2.7 mM KCl, 10 mM Na2HPO4, 2 mM KH2PO4)
•Lysis Bu er 1 (0.05 M Hepes–KOH, pH 7.5, 0.14 M NaCl, 1 M EDTA, 10% glycerol, 0.5% NP–40, 0.25%, Triton X–100, protease inhibitor cocktail (Roche Applied Science, CAT# 1836170) added prior to use)
•Lysis Bu er 2 (0.2 M NaCl, 1 M EDTA, 0.5 M EGTA, 10 M Tris, pH 8, protease inhibitor cocktail (Roche Applied Science, CAT# 1836170) added just prior to use)
•Lysis Bu er 3 (1 M EDTA, 0.5 M EGTA, 10 M Tris–HCl, pH 8, protease inhibitor cocktail (Roche Applied Science, CAT# 1836170) added just prior to use)
•RIPA bu er (50 mM Hepes, pH 7.6, 1 mM EDTA, 0.7% DOC, 1% NP–40,
0.5M LiCl, protease inhibitor cocktail (Roche Applied Science, CAT# 1836170) added prior to use)
•Elution bu er (50 mM Tris, pH 8, 10 mM EDTA, 1% SDS)
•Proteinase K stock solution (20 mg/ml proteinase K (Sigma), 50 mM Tris– HCl, pH 8.0, 1.5 mM Calcium Acetate)
•TE (10 mM Tris–HCl, pH 8.0, 1 mM EDTA, pH 8.0)
•Proteinase K solution (2% glycogen, 5% proteinase K stock solution, TE)
•Linker oligo (oJW102: GCGGTGACCCGGGAGATCTGAATTC; oJW103:
GAATTCAGATC; these two oligos are dissolved in dH2O and annealed to make a 15 M solution in 0.25 M Tris–HCl, pH 8.0)
•Hybridization bu er 1 (2.2 × SSC, 0.22% SDS)
•Hybridization bu er 2 (70% formamide, 3 × SSC, 14.3% dextran sulfate)
•Pre-hybridization bu er (2 × SSC, 0.05% SDS, 0.2% BSA)
•Wash bu er 1 (2 × SSC, 0.1% SDS)
•Wash bu er 2 (0.2 × SSC, 0.1%SDS)
•Wash bu er 3 (0.2 × SSC)
13 Analysis of Gene Regulatory Circuits |
269 |
13.2.2 Procedures
Chromatin Immunoprecipitation
Formaldehyde Cross–linking of Cells. The cells grown in plastic dishes are first re-suspended and transferred as 40 ml aliquots into 50 ml tubes. The tubes are placed on ice for 10 minutes, then 1/10 volume, i.e. 4 ml, crosslinking solution is added directly to each tube. The cross–linking reaction is allowed to continue for 10 minutes before being stopped by the addition of 1/20 volume, i.e. 2.2 ml, of 2.5 M glycine solution to each tube. The fixed cells in each tube are harvested by centrifugation at 2000 g for 10 minutes at 4◦C. The cell pellets are re-suspended and pooled together with a total of 50 ml cold PBS. These cells are centrifuged again at 2000 g for 5 minutes at 4◦C, and the supernatant is removed. After repeating the washing cycle once more, the final cell pellet is snap frozen in liquid nitrogen and stored at –80◦C.
Extraction and Fragmentation of Chromatin. The frozen cell pellet from the previous step is re-suspended in 30 ml of Lysis Bu er 1 and incubated for 10 minutes at 4◦C on a rocking platform. The cell mixture is then centrifuged at 2000 g for 10 minutes at 4◦C. After removing the supernatant, the cell pellet is re-suspended in 24 ml Lysis Bu er 2 and mixed gently at room temperature for 10 minutes on a rocking platform. The cells are then centrifuged at 2000 g for 10 minutes at 4◦C. The cell pellet is finally re-suspended in 10 ml of Lysis Bu er 3.
To obtain small chromatin fragments from the above cell extracts, physical shearing forces generated by a sonicator are used. The cell mixture from the previous step is divided into 5 ml aliquots and placed in 15 ml tubes. These tubes are then placed on ice. Cells are continuously sonicated for 25 seconds using a Branson Sonifier 450 with power setting at 5. The sonication is followed by at least 1 minute of incubation on ice to avoid accumulation of heat. The cell mixture is sonicated and chilled for a total of eight cycles (Note that the number of sonication cycles varies with di erent cell types and cross–linking conditions). E ciency of sonication can be checked by taking 10 l of cell extract out for gel analysis after each cycle, with the optimal chromatin DNA around 500–1000 bp. After sonication, the chromatin samples are pooled together, adjusted to 0.5% Sarkosyl (sodium lauryl sarcosine) and gently mixed for 10 minutes at room temperature on a rocking platform. The chromatin solution is then transferred to a centrifuge tube and spun for 10 minutes at 10,000 g to remove cell debris. The supernatant is collected for chromatin immunoprecipitation, or stored at –80◦C as 1 ml aliquots.
Immunoprecipitation of Chromatin. The chromatin immunoprecipitation is performed using anti-rabbit IgG-conjugated magnetic beads (Dynal) that are coupled to the polyclonal antibodies. To prepare this material, magnetic beads (100 l) are centrifuged at 2000 g for 3 minutes at 4◦C. After
270 Zirong Li
removing the supernatant, the beads are re-suspended in 5 ml cold PBS containing 5 mg/ml Bovin Serum Albumin (BSA, Sigma Cat# A–7906) made immediately before use. This washing cycle is repeated a total of 3 times, and the magnetic beads are re-suspended in 5 ml of cold PBS with BSA. 10 g rabbit polyclonal antibody is added to the beads mixture and mixed overnight on a rotating platform at 4◦C. The following day, the magnetic beads are collected by centrifugation at 2000 g for 5 minutes, washed 3 times with 5 ml cold PBS with 5 mg/ml BSA and re-suspended in 100 l cold PBS with 5 mg/ml BSA.
The soluble chromatin solution from Step 2 is first adjusted to 0.1% Triton X–100, 0.1% sodium deoxycholate, and 1 mM PMSF. To 1 ml of this mixture, 100 l of magnetic beads pre-coupled with the antibody are then added. The mixture is incubated at 4◦C overnight in a rotating platform. The following day, the magnetic beads are collected using a magnet MPC–E from Dynal, and the supernatant removed by aspiration. The beads are re-suspended in 1 ml RIPA bu er. After incubation on a rotating platform at 4◦C for 3 minutes, the magnetic beads are collected with MPC–E again. This washing process is repeated 5 times followed by a wash with 1 ml TE. The beads are collected by centrifugation at 2000 g for 3 minutes and re-suspended in 50 l elution bu er. To elute the precipitated chromatin, the beads are incubated at 65◦C for 10 minutes with constant agitation, then 40 l of supernatant are collected after a 30 second centrifugation at 2000 g. The eluted chromatin is mixed with 120 l of TE (1% SDS) and incubated at 65◦C overnight to reverse the cross– links.
Purification of Immunoprecipitated DNA. To purify the immunoprecipitated DNA, 120 l Proteinase K solution is added to the chromatin solution. The mixture is incubated for 2 hours at 37◦C to allow digestion of proteins in the precipitates. The sample is then extracted twice with phenol (Sigma, cat# P–4557), once with 24:1 chloroform/isoamyl alcohol (Sigma cat# C– 0549). The sample is adjusted to 200 mM NaCl. 2 volumes of ethanol are added to the mixture, which is then incubated for 15 minutes at –80◦C or on dry ice. The DNA is then precipitated by centrifugation at 14,000 rpm at 4◦C in a micro–centrifuge. The DNA pellet is washed with 70% ethanol and re-suspended in 30 l TE containing 10 g DNase-free RNase A (Sigma, cat# 6513) and incubated for 2 hours at 37◦C. After the incubation, the DNA is purified with Qiagen PCR kit (Qiagen, cat# 28106) and re-suspended in 50 l elution bu er included with the kit.
As a control, DNA from an aliquot of chromatin solution is reverse crosslinked and purified in a similar fashion. At this step, PCR reactions using specific primers to amplify certain known target regions can be performed to check whether the chromatin immunoprecipitation is successful. A detailed description of such tests can be found in other publications [8].
13 Analysis of Gene Regulatory Circuits |
271 |
Ligation-mediated PCR
Blunting Reaction. The immunoprecipitated DNA obtained from the previous steps usually needs to be amplified and labelled for DNA microarray analysis. To achieve this, a ligation-mediated PCR (LM–PCR) method is used. First, the DNA is treated with T4 DNA polymerase to form blunt ends. The reaction is assembled as follows:
40 l immunoprecipitated DNA (or 20 ng of control input DNA) 11 l (10×) T4 DNA pol bu er (NE Biolabs cat # 007–203)
0.5 l BSA (10 mg/ml) (NE Biolabs cat # 007–BSA) 0.5 l dNTP mix (20 mM each)
0.2 l T4 DNA pol (3 U/ l) (NE Biolabs cat # 203L) add dH2O to a total 112 l.
The reaction is carried out for 20 minutes at 12◦C. Afterwards, the sample is adjusted with 1/10 volume of 3 M sodium acetate (pH 5.2), 1 g of glycogen (Roche Applied Sciences, cat# 0901393) and is extracted with phenol:chloroform:isoamyl alcohol (25:24:1) (Sigma, cat# P–3803) once, followed by ethanol precipitation (see above). The final DNA pellet is dissolved in 25 l dH2O.
Ligation Reaction. Assemble the following reaction:
25 l of DNA
8 l dH20
10 l 5× ligase bu er (Invitrogne, cat# 46300–018) 6.7 l annealed linkers (15 M)
0.5 l T4 DNA ligase (New England Biolabs, cat# 202L) 50.2 l Total
The ligation reaction is allowed to continue for over night at 16◦C. On the next day, the DNA is purified by ethanol precipitation and dissolved in 25 l dH2O.
PCR. The ligated DNA sample is used as template in the following polymerase chain reaction:
25 l DNA
4 l 10× ThermoPol reaction bu er (New England Biolabs, cat# B9004S) 4.75 l ddH2O
5 l 10× dNTP mix (2.5 mM each dATP, dTTP, dGTP, dCTP) 1.25 l oligo oJW102 (40 M stock)
add dH2O to final volume of 40 l.
The sample is first incubated at 55◦C for 2 minutes, then 10 l of an enzyme mix [8 l dH2O, 1 l Taq DNA polymerase (5 U/ l), 1 l ThermalPol reaction bu er, and 0.025 unit of Pfu polymerase (Stratagene, cat #
272 Zirong Li
600250–51)] is added to the sample. Subsequently, the following PCR cycle is performed:
step 1: 72◦C for 5 minutes; step 2: 95◦C for 2 minutes; step 3: 95◦C for 1 minute; step 4: 60◦C for 1 minute; step 5: 72◦C for 1 minute;
step 6: go to step 3 for 22 times; step 7: 72◦C for 5 minutes;
step 8: 4◦C forever;
Afterwards, the DNA is purified using the Qiaquick PCR purification kit (Qiagen, cat# 28106) and eluted in 60 l elution bu er provided with the kit.
DNA Microarray Hybridization
Labelling Immunoprecipitated DNA. To 200 ng of DNA from the previous step, 20 l of 2.5× random primer solution (from the BioPrime kit, Invitrogen, Cat# 18094–011) and dH2O are added to a final volume of 42.5 l. The mixture is boiled for 5 minutes and then immediately placed on ice. To initiate the labelling reaction, 5 l of 10× low dCTP mixture (2.5 mM each for dATP, dTTP and dGTP, and 0.6 mM for dCTP), 1.5 l of Cy5–dCTP (Amersham, Cat# PA55021) or Cy3–dCTP (Amersham, Cat# PA53021), 40 unit of Klenow DNA polymerase are added to the mixture. The reaction is carried out at 37◦C for 2 hours. Finally, the labelled DNA is purified using the Qiagen PCR kit (Qiagen, Cat# 28106).
DNA Microarray Hybridization. 2.5 g of Cy5-labelled ChIP DNA, 2.5 g of Cy3-labelled genomic DNA and 36 g human Cot–1 DNA (Invitrogen, Cat# 15279–011) are mixed together and concentrated by ethanol precipitation. The DNA pellet is dissolved in 22.4 l of hybridization bu er 1. Then 20 l of hybridization bu er 2 is added to the mixture, and the sample is incubated first at 95◦C for 5 minutes then 42◦C for 2 minutes. Subsequently, 4 l of yeast tRNA (Sigma, cat# R9001 at 10 g/ l) and 3 l of 2% BSA are used to adjust the hybridization reaction to 50 l. This mixture is added to a DNA microarray slide that has been incubated with the pre-hybridization solution for 40 minutes at 42◦C. A 25 mm × 60 mm cover slip is then gently placed on top of the sample, and the hybridization is carried out in a hybridization chamber (Corning, cat# 07–200–271) at 60◦C overnight in a water bath.
Washing Microarrays. After the hybridization, the microarray slide is washed once with washing bu er 1 at 60◦C for 5 minutes, once with washing bu er 2 for 10 minutes at room temperature, and three times with washing bu er 3 at room temperature.
13 Analysis of Gene Regulatory Circuits |
273 |
Microarray Analysis and Identification of in vivo DNA Binding Sites
To collect the microarray data, a microarray scanner (GenePix 4000B, Axon Instrument) is used to scan the microarray slide. The microarray image is first analyzed with the image analysis software GenePix pro 3.0 to derive the Cy3 and Cy5 fluorescent intensity and background noise at each spot. Then background intensity is subtracted from the fluorescent intensity at the spot for both Cy3 and Cy5. Normally, the signal from Cy3 is normalized to the Cy5 based on median spot intensities for the entire image. The ratio of Cy5 intensity (usually corresponding to ChIP DNA) over Cy3 intensity (corresponding to input genomic DNA) is calculated, and a P value is calculated using an error model [14]. The genomic regions that have at least 2 fold Cy5/Cy3 ratio with P values less than 0.001 are usually considered as significant binding sites.
13.3 Example: Identifying the Target Genes
of Human E2F4
The E2F4 transcription factor plays an important role in cell cycle progression. E2F4 is thought to function by regulating genes involved in G1/S transition, and chromatin immunoprecipitation (ChIP) experiments have shown that E2F4 binds to genes that are activated at the G1/S boundary [15]. Entry of E2F4 into the nucleus is restricted in G0 and early G1, and binding of E2F4 to promoters in quiescent cells coincides with recruitment of p130, diminished acetylation of histone at the promoters, and gene repression. The human promoter microarray we developed recently allows us to systematically identify the direct E2F4 targets.
13.3.1 Experimental Procedures
Primary human fibroblast (WI38) is synchronized to G0 through serum starvation. These G0 cells were fixed by formaldehyde, harvested, and disrupted by sonication. E2F4 bond chromatin was enriched by chromatin immunoprecipitation with E2F4 specific antibody SC–1082 (Santa Cruz Biotechnology). E2F4 bond DNA was then purified after proteinase K and RNase A treatment, and amplified by ligation-mediated PCR (LM–PCR). Amplified DNA was subsequently labelled with Cy5–dCTP using the BioPrime Kit (Invitrogen). In the mean time, input DNA that has not been enriched by chromatin immunoprecipitation was labelled with Cy3–dCTP. Cy5 and Cy3 labelled DNA were mixed and hybridized to the human 5K–promoter array in the presence of human Cot–1 DNA under stringent conditions overnight. The DNA microarray was washed and scanned using a GenePix 4000 scanner.
274 Zirong Li
(A)
(B)
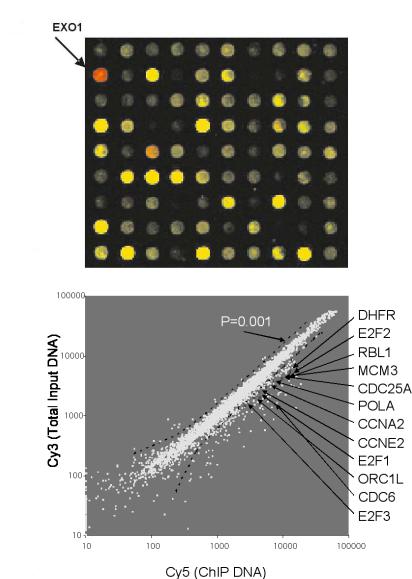
Fig. 13.2. Identification of the E2F4 target genes in WI38 cell. (a) A close-up of a scanned image of the human DNA array that contains promoter regions of 5000 human genes. The arrow points to a spot where the red intensity is significantly higher than the green intensity, indicating that the promoter region of that gene (EXO1) is bound in vivo by E2F4. (b) Scatter plot of Cy3-labelled total genomic DNA versus Cy5-labelled E2F4 CHIP-enriched DNA. A P-value cuto of 0.001 is shown. The red spots represent some previously confirmed E2F4 targets, listed next to the plot
13 Analysis of Gene Regulatory Circuits |
275 |
13.3.2 Results and Discussion
The result of the E2F4 location analysis experiment is shown in Fig. 13.2. Our results suggest that the genome wide location analysis procedure is a powerful method to identify in vivo targets of transcription factors. When using the criteria: P–value ≤ 0.001, channel intensity ≥ 200 and ratio ≥ 2, we found 143 genes whose promoters were occupied by E2F4 in physiological condition, indicating that they are putative E2F4 targets. Most of these 143 genes were confirmed earlier by either chromatin immunopreciptation or A ymetrix cDNA expression arrays [11, 16]. We also identified some novel E2F4 targets that fall into several function groups related to cell cycle regulation, DNA replication, DNA repair, G2/M checkpoints and mitotic regulation.
13.4 Summary
Genome wide location analysis is a general method to identify the in vivo binding sites for transcription regulators. The recent use of this method to map the genetic regulatory network in yeast demonstrated that this method is an essential tool for us to understand the mechanisms of gene regulation in cells [12]. Applying this approach to mammalian transcription factors is expected to yield important information about the mechanisms of animal development and pathology of human diseases.
References
1.Davidson, E. H. (2001). Genomic Regulatory Systems:development and evolution
(San Diego, Academic Press)
2.Tjian, R., and Maniatis, T. (1994). Transcriptional activation: a complex puzzle with few easy pieces, Cell 77, 5–8
3.Ptashne, M., and Gann, A. (1997). Transcriptional activation by recruitment, Nature 386, 569–77
4.Orphanides, G., and Reinberg, D. (2002). A Unified Theory of Gene Expression, Cell 108, 439–451
5.Ren, B., Robert, F., Wyrick, J. J., Aparicio, O., Jennings, E. G., Simon, I., Zeitlinger, J., Schreiber, J., Hannett, N., Kanin, E., et al. (2000). Genome–wide location and function of DNA binding proteins, Science 290, 2306–9
6.Iyer, V. R., Horak, C. E., Scafe, C. S., Botstein, D., Snyder, M., and Brown, P. O. (2001). Genomic binding sites of the yeast cell–cycle transcription factors SBF and MBF, Nature 409, 533–8
7.Solomon, M. J., Larsen, P. L., and Varshavsky, A. (1988). Mapping protein–DNA interactions in vivo with formaldehyde: evidence that histone H4 is retained on a highly transcribed gene, Cell 53, 937–47
8.Orlando, V. (2000). Mapping chromosomal proteins in vivo by formaldehyde– crosslinked–chromatin immunoprecipitation, Trends Biochem Sci 25, 99–104
276 Zirong Li
9.Lieb, J. D., Liu, X., Botstein, D., and Brown, P. O. (2001). Promoter–specific binding of Rap1 revealed by genome–wide maps of protein–DNA association, Nat Genet 28, 327–34
10.Simon, I., Barnett, J., Hannett, N., Harbison, C. T., Rinaldi, N. J., Volkert, T. L., Wyrick, J. J., Zeitlinger, J., Gi ord, D. K., Jaakkola, T. S., and Young, R.
A.(2001). Serial regulation of transcriptional regulators in the yeast cell cycl e, Cell 106, 697–708
11.Ren, B., Cam, H., Takahashi, Y., Volkert, T., Terragni, J., Young, R. A., and Dynlacht, B. D. (2002). E2F integrates cell cycle progression with DNA repair, replication, and G(2)/M checkpoints, Genes Dev 16, 245–56
12.Lee, T. I., Rinaldi, N. J., Robert, F., Odom, D. T., Bar-Joseph, Z., Gerber, G. K., Hannett, N. M., Harbison, C. T., Thompson, C. M., Simon, I., et al. (2002).
Transcriptional regulatory networks in Saccharomyces cerevisiae, Science 298, 799–804
13.Weinmann, A. S., Yan, P. S., Oberley, M. J., Huang, T. H., and Farnham, P.
J.(2002). Isolating human transcription factor targets by coupling chromatin immunoprecipitation and CpG island microarray analysis, Genes Dev 16, 235– 44
14.Roberts, C. J., Nelson, B., Marton, M. J., Stoughton, R., Meyer, M. R., Bennett,
H.A., He, Y. D., Dai, H., Walker, W. L., Hughes, T. R., et al. (2000). Signaling and circuitry of multiple MAPK pathways revealed by a matrix of global gene expression profiles, Science 287, 873–80
15.Takahashi, Y., Rayman, J. B., and Dynlacht, B. D. (2000). Analysis of promoter binding by the E2F and pRB families in vivo: distinct E2F proteins mediate activation and repression, Genes Dev 14, 804–16
16.Iyer, V. R., Eisen, M. B., Ross, D. T., Schuler, G., Moore, T., Lee, J. C., Trent,
J.M., Staudt, L. M., Hudson, J., Jr., Boguski, M. S., et al. (1999). The transcriptional program in the response of human fibroblasts to serum, Science 283, 83–7
Part III
Protein Microarrays

14
Protein, Antibody and Small Molecule
Microarrays
Hendrik Weiner, J¨orn Gl¨okler, Claus Hultschig, Konrad B¨ussow, and Gerald Walter
14.1 Introduction
New and rapidly spreading infectious and lifestyle diseases, together with known killers like cancer and heart disease, particularly threaten older populations and put enormous pressure on our medical capabilities. Today’s drug arsenal attacks about 400 targets, while the human genome sequence revealed at least 30,000 genes. The expression of these genes creates a complex puzzle of millions of products and points of interaction between them. Every one of these products is a potential drug or target, provided that the corresponding drug can be shown to be specific and safe in a patient’s organism. And as individual patients are di erent, tests need to be extended to whole populations. Clearly, this can only be handled using high throughput approaches, looking at large numbers of genes and their products simultaneously.
The array format enables miniaturized and parallel analysis of large numbers of diagnostic markers in complex samples [1,2]. The concept of the arrayed library [3] allows gene expression analysis and protein interaction screening on a whole–genome scale. Using automated colony picking and gridding, cDNA or antibody libraries can be expressed and screened as clone arrays [4, 5]. As discussed in this chapter, protein microarrays are constructed from recombinantly expressed and purified proteins, using a range of expression systems. Gene product action can be studied directly if the proteins’ structure and functionality is maintained. This requires novel systems for high throughput protein expression that produce su cient amounts of properly modified and folded molecules. Large numbers of proteins must be arrayed at high density, keeping them intact and biologically active. That is most easily achieved if molecules of the same general structure (e.g. antibodies) are arrayed. Antibody arrays are now becoming an important screening tool for a wide range of molecules in complex mixtures and a robust format for expression profiling of whole genomes. Alternative systems such as nucleotide aptamers should be able to mimic certain protein functions, and as nanoand microfluidic arrays, can make very robust array formats in the future. Di erential protein profiles
280 Hendrik Weiner et al.
have been used as molecular diagnostics for cancer [6] and might soon be applied to screen high risk populations for tumor markers. In the format of high throughput arrays, di erential protein profiles may eventually arrive at the doctor’s o ce and as over–the–counter devices.
14.2 Protein Microarrays
14.2.1 Introduction
A protein microarray is a highly ordered pattern of proteins immobilized on a pre-treated surface of a small and planar metal, plastic, or glass support [7–9]. Microarrays, like microprocessors, use parallelism, miniaturization and automation as three conceptual cornerstones [10]. However, unlike microprocessors, microarrays are not designed to take input signals and, using preprogrammed instructions, convert them into meaningful output. Protein microarray technology enables high throughput analysis of protein functions, such as interactions between proteins, catalysis, binding to drugs and other biochemical reactions [11]. The speed, precision, a ordability and e ciency of microarray analysis o er a tremendous experimental advantage over traditional, rather cumbersome, analytical tools using columns, gels, filters and microplates. Microarrays lend themselves to a plethora of applications in biomedical research, clinical diagnostics and in the pharmaceutical industry. This can be inferred from more than 100 protein array-oriented scientific publications in the past two years [12, 13]. Ultimately, a single microarray containing the complete set (not taking into account covalently modified isoforms) of 20,000–40,000 proteins expressed in human cells would allow comprehensive assessment of a given protein function. However, as outlined below, such a proteome–wide microarray is not yet on the horizon.
14.2.2 Protein Production, Purity and Printing
Putting diverse protein repertoires on a microarray requires the simultaneous and quality-assured production of many recombinant proteins of high purity. This is a non-trivial exercise that requires an appropriate infrastructure plus expertise, both of which often do not exist in regular and otherwise wellequipped molecular laboratories. Usually, recombinant proteins are produced in a soluble form in Escherichia coli, yeast, mammalian or insect cells. In vitro translation is an alternative option since most microarray-based applications require less than 100 g protein. Current practice in our laboratory involves a long list of quality control steps for the production and isolation of recombinant proteins to assure their purity and fidelity. This list includes the PCR product, vector design, entry clone, expression clone, DNA sequencing of cloned insert and, eventually, the solubility, size and electrophoretic homogeneity of the purified protein product. Such attention to quality is most
14 Protein, Antibody and Small Molecule Microarrays |
281 |
often very critical for interpretable results from microarray-based binding experiments. Even if induction can significantly increase the abundance of a recombinant protein over background, binding to impurities in the protein preparation, when placed onto an array, can heavily contaminate a true signal.
After being standardized with respect to homogeneity, purity and concentration, the recombinant proteins are ready to be immobilized onto an array support, most often a standard microscope format. Di erent support designs and surface chemistries have been described in preceding Chaps. 1–3. Established spotting technologies, including needle printing, piezo or solenoid dispensing have been discussed in Chaps. 4 and 5. Contact printing robots allow for up to 50,000 di erent elements on a slide. Nanotechnology and noncontact printing techniques can further increase the number of elements on an array (Chap. 6). If robotic spotting is unavailable or if only a small subset of proteins are to be analyzed, manual spotting can be an appropriate alternative, e.g. with the apparatus from Schleicher & Schuell or Greiner. The former allows for almost 800 elements on the slide and is originally designed for the company’s proprietary slides containing a thin nitrocellulose layer. However, after minor adjustments, this apparatus is also applicable for printing nonlayered microscope slides. Whenever an isolated protein is being immobilized it might alter its binding properties with respect to in-solution conditions. This can be minimized through the use of random immobilization as opposed to site-specific immobilization that leaves only a certain part of the molecules accessible for binders. Alternatively, one can immobilize the proteins on a slide that carries a highly hydrophilic layer of nitrocellulose (‘Fast Slides’, Schleicher & Schuell Bioscience) or polyacrylamide (‘Hydrogel’, Perkin Elmer Life Sciences). The latter are thought to nicely emulate solution like properties.
In summary, the virtues of functional assays with well constructed protein microarrays include ensured purity, standardized protein amounts and accessibility, on array replicates, ranking of signals possible and an inclusion of both positive and negative controls.
14.2.3 Detection of Small or Large Ligands
Numerous detection strategies have evolved over the years to detect and amplify signals associated with intermolecular binding events. These will not be reviewed here. The advent of fluorescent detection in combination with perfectly flat supports has greatly contributed to the popularity of DNA microarrays. Because of the almost ubiquitous nature of fluorescent detection systems, and because many molecular laboratories are already equipped with the infrastructure for the detection of fluorescent dyes on DNA microarrays, one might choose to concentrate on labelling proteins with the same or similar dyes to those employed for di erential analysis on DNA microarrays, namely Cy3/Cy5 dyes (Amersham Biosciences) or Alexa 488/530 dyes (Molecular Probes). Fluorophore labels on proteins can be detected with a sensitivity
282 Hendrik Weiner et al.
superior to many other labels. In addition, fluorophore labelled proteins can easily be quantified, e.g. one can easily detect as low as 1 attomol of a fluorophore labelled antigenic protein bound on an antibody immobilized on a microarray (H. Weiner and K. B¨ussow, unpubl.). However, fluorophore labelling of peptides or small molecules is often not practical due to steric hindrance by labels as large or bigger than the molecule being analyzed. Small molecule binding usually becomes accessible through radiolabels, that can now be detected with suitable microarray-based readers, e.g. from Fuji or Zinsser. Steric hindrance in the microenvironment around a binding site can also be problematic for protein–protein interactions. As a solution, proteins can be radio-labelled metabolically [14, 15], ex vivo [16] or at a single site after purification [17]. Such radiolabelling usually prevents the problems associated with multisite–labelling (biotinylation, fluorophorylation) or secondary detection (antibodies). To radiolabel a protein site–specifically, the protein probe can be constructed as a gluthatione–S–transferase (GST) fusion in that a phosphorylation site for protein kinase A (PKA) is inserted between the GST and the protein part of interest. Vectors for the expression of a nitytagged fusion proteins that contain a PKA–site are commercially available (Novagen, Amersham Biosciences). The fusion protein has to be phosphorylated by PKA [17] and can then be used as a probe to decorate the microarray. Label-free approaches including mass spectrometry [18, 19] or surface plasmon resonance [20, 21] should be attractive alternatives to detect small or large molecule binding events, as discussed in Chap. 9. Unfortunately, none of these approaches are currently applicable to the detection of binding events on microarrays containing a large set of di erent proteins.
14.2.4 Caveats
The main challenge for all recombinant techniques is to synthesise properly folded and conformationally correct recombinant proteins, i.e. to emulate the structural integrity of the native protein [22]. This can often not be fully warranted, even if one tries to incorporate coand post-translational modifications during the production of the protein, e.g., through its expression in insect or mammalian cells. Another problematic aspect is surface denaturation upon spotting, immobilization, storage and assay [18]. Surface denaturation, at least to some extent, always occurs and is often di cult to control, in particular if a variety of proteins is to be treated in parallel and under identical conditions, while each protein requires a particular environment to be fully active; for details see Chaps. 2 and 3. As a result, a given protein function detected on a microarray may be a false positive and not physiologically relevant. Any such result should therefore be confirmed using an in-solution assay, preferably in vivo in an appropriate cellular system.
14 Protein, Antibody and Small Molecule Microarrays |
283 |
14.2.5 Conclusions
Almost every cellular process depends on protein activities that are probably controlled by highly specific interactions between proteins and between proteins and other molecules [23,24]. It is therefore not surprising that proteomics is currently being hailed as the next phase of genomic activity [25] and that therapeutic molecules most often are directed to proteins [26]. Appropriately designed protein microarrays are likely to find immediate applications in analytical protein biochemistry and can complement or even replace traditional technologies employed in protein characterization. One of the most promising features of protein microarrays is their potential to serve as a reliable ‘early catch’ format to fish out a given protein function that can then be characterized more deeply using classical non-array-based protein techniques. This feature is reminiscent to the recently developed high density protein arrays that are constructed from cDNA expression libraries and that are printed on large membranes [27]. Although very useful for certain functional studies [28], such protein arrays are often not acceptable because they carry a redundant set of only unpurified and at least partially denatured recombinant proteins produced in E. coli. Clearly, the construction of properly designed protein microarrays often requires hundreds or thousands of di erent recombinant proteins, non-denatured, of su cient purity and in workable amounts. As outlined above, the cloning, expression and isolation of such proteins represents the biggest obstacle in the production of a protein microarray, even if only a small set of recombinant proteins is to be arrayed.
14.3 Antibody Microarrays
14.3.1 Introduction
What Are Antibody Microarrays?
Antibody arrays constitute a subset of protein arrays, displaying a certain type of protein in terms of structure and function. Antibodies are here defined as immunoglobulins or their di erent fragments, such as Fab’s, or (reduced to their antigen binding domains) single-chain (sc)Fv’s. It is essential that the immobilized antibodies retain their native structure in order to bind their cognate antigen specifically.
Applications
DNA–arrays and PCR have been widely applied to study the transcriptional level of gene expression and correlate patterns to certain phenotypes. However many features of gene function can only be assessed after translation, including modification and intracellular localization of proteins. Even the level of translation may di er from the transcription level of a gene [29]. If we take a look at
284 Hendrik Weiner et al.
the diversity of human gene transcripts of currently more than 37,000 [30], the number of possible post-translational modifications on the resulting proteins may increase this complexity beyond a million [31]. Functionally, phosphorylation states can indicate the status of a protein in the signal transduction pathway. Glycosylation of extracellular proteins is decreased or altered in certain types of cancer [32]. Antibodies can detect the three–dimensional conformation of a protein, which is most important for the screening of prions in TSEs (transmissible spongiform diseases) [33]. Antibodies can assess a multitude of other post-translational modifications, emphasizing the demand for antibody arrays to analyze complex protein samples in an e cient manner similar to DNA microarrays.
14.3.2 Current Technology
Originally, antibody arrays have been developed in 96 well–microtitre plates, based on the classical ELISA format. Miniaturization has increased the number of simultaneously detectable antigens, while still using wells to provide for separate incubation chambers. To further integrate the complexity of ELISA experiments, a multiplicity of di erent antibodies was immobilized in defined spots on the bottom of these wells, hence creating a micro–ELISA format [34]. In order to apply greater amounts of di erent antibodies to a surface, membrane filters were used as support for recombinant scFv’s [5] or antibodies to detect cytokines in patient sera [35].
Microarrays
Early approaches to generate antibody arrays for high throughput screening used either expensive new materials such as specialized ELISA plates and machinery adapted to this format, or a relatively high amount of antibodies and analyte consumed by filter assays. As a consequence, a new format was introduced for microarrays based upon the already well-established microscope glass slide as a basis. Such slides have been extensively used for cDNA microarrays, but then adapted to protein microarrays by Mirzabekov, using gel–pads for the immobilization of protein samples [36]. The robotic equipment developed for cDNA microarray technology was adapted to the production of protein arrays, using glass surfaces to covalently anchor proteins. This enabled the spotting of proteins at a density of 10,000 di erent samples [11]. Early antibody microarrays were created using poly–L–lysine surfaces as adopted from DNA array technology [37]. However, it became apparent that of the 115 antibody–antigen pairs in these experiments, only half of the immobilized antigens and 20% of the immobilized antibodies remained active.
As antibodies constitute the active part in an immunoassay, special care must be taken to keep these in a native state on the microarrays. Several studies have been focused on finding optimal storage conditions and appropriate surfaces [38, 39]. Of the materials tested, those which covalently immobilism
14 Protein, Antibody and Small Molecule Microarrays |
285 |
antibodies via epoxy–groups in combination with a surface gave the best results with respect to detection limits and signal to noise ratio. Before such antibody microarrays are created, it is advisable to check the functionality of each antibody individually [38]. Indirect immobilization by biotinylation and streptavidin may improve the performance of antibody arrays up to 10– fold [40]. However to introduce this modification to all antibodies individually would make this approach more costly and time–consuming.
Labelling and Detection
Starting from classical radioactive and enzymatic labelling techniques, covalent fluorescent labels have become standard for the detection of analytes in microarray technology, but see Chaps. 8 and 9 for a detailed review of this and other labelling or label-free techniques. Isothermal rolling–circle amplification has been developed to further increase the sensitivity of fluorescent detection [41]. Preferably, N–succinimide-activated esters of fluorophores such as Cy3 and Cy5 are used in combination, allowing for easy comparison by internal control. For antibody microarrays, either the analyte or a secondary antibody (sandwich assays) must be labelled. However, complex analyte samples are di cult to label homogeneously, preserving epitopes recognized by the immobilized antibodies. Even properties like solubility of the modified proteins might be a ected. Alternatively, the application of secondary antibodies matching the primary antibodies on the chip is limited to a small number of di erent molecules to be screened before the background exceeds the signal. Therefore, sandwich assays could not so far be applied to complexities beyond 38 di erent sets of antibodies [42].
High sensitivity of detection and minute amounts of sample required are main advantages of microarrays as compared to the classical ELISA. Nanoliter amounts of sample can be applied and immobilized on the support. Putting a cover slide on top of the chip surface during incubation can reduce the amount of analyte. The absolute detection level is dependent on the binding properties of the applied antibody and the complexity of the analyzed sample, but may well reach down to 1 pg/mL using the rolling circle amplification detection [42].
Microwells and Microfluidic Chips
While conventional microarrays only allow the simultaneous screening of two samples at a time, e orts have been made to introduce true multiplexing (as in microtitre ELISA) to the microarray technology. This was achieved partly as described above, by printing small arrays in microtitre wells. However, a true multiplexing is only achieved if all samples are kept in separate compartments, which can be achieved by the synthesis of microchip surfaces bearing microwells, or microfluidic chips that have channels etched on the surface by which all points on the chip can be addressed individually [43].
286 Hendrik Weiner et al.
14.3.3 Current Deficiencies
Source of Antibodies
A major problem of antibody microarrays is the standardized production of many di erent antibodies. As commercially available monoclonal and polyclonal antibodies can make an array exceedingly expensive, attempts have been made to isolate recombinant antibodies by phage display [44], ribosomal display [45] or even aptamers from nucleic acid libraries [46].
Antibody Performance on Microarrays
Previous studies have demonstrated that there is a widely varying performance of antibodies on microarrays. Many do not show any activity, decreased specificity or a lowered a nity [37,38]. Optimizing the surface and applying indirect immobilization can increase performance. However it would be advantageous to determine and include additional information regarding the suitability of a commercially available antibody in a similar manner as currently available for the application in immunoblotting, indirect ELISA or dot blot. As for antibody fragments in single–chain format derived from phage display libraries, we have found that stability is often impaired by immobilization. While Fab fragments are often found to be more stable than scFv’s [47], it remains to be demonstrated that these are better suited for the microarray format.
Surfaces and Hardware
Although a large portion of the hardware equipment was adopted from cDNA microarray technology, such as the microscope slide format, fluorescent detection, microspotting devices and scanners, many of these will have to be optimized to meet the requirements of antibody arrays. Keeping the immobilized antibodies hydrated and reducing the denaturing contact with the surface seems to be necessary to retain these in an active state. Introducing microwells to reduce evaporation may be helpful, but also requires alignment of the handling robots with the surface grid. The same holds true for the microfluidic chips that need a greater extent of additional hardware and protocols to be applied.
14.3.4 Conclusions
Despite the technology of antibody microarrays still being in its infancy, rapid progress has been made. Depending on the application, the diversity and dimension of such microarrays will be ranging from 100 to 10,000 di erent binders. It will be interesting to see whether the recombinant molecules derived from combinatorial libraries are going to replace the currently favored
14 Protein, Antibody and Small Molecule Microarrays |
287 |
antibodies in the future. New detection techniques may obviate the need to label the analyte or secondary antibody. Direct in vitro synthesis of the binding molecules on the chip may solve storage and activity problems faced today [48]. In summary, the impact antibody microarrays will have on diagnostics and drug discovery is yet to be conceived.
14.4 Peptide and Other Synthetic Arrays
14.4.1 Combinatorial Peptide and Non-Peptide Libraries
Structure determination is a powerful approach to molecular interaction analysis. Techniques such as X–ray crystallography and nuclear magnetic resonance (NMR) o er insights into the spatial arrangement of macromolecules and their complexes. However, since structure determination of biological macromolecules is time consuming and cumbersome, empirical combinatorial methods were developed in parallel to the structure determination methods to address the important topic of structure/activity relationship [49]. These methods mimic natural selection, the driving force behind evolution. They rely on the creation of many di erent variants of one molecule of interest and the selection of those variants by certain functional criteria. Both combinatorial chemistry and combinatorial biology provide suitable strategies for the creation of and selection from large libraries of diverse but comparable molecules. In these approaches, a library consisting of many di erent molecules is created and those members with an anticipated property are selected. A variety of di erent methods for the creation of and the selection from combinatorial libraries have been reviewed exhaustively [50–52].
In combinatorial chemistry, combining di erent building blocks with suitable chemical reactions creates large numbers of variants. The resulting individual compounds are used to study structure activity relationships of one target molecule systematically. However, the number of compounds that can be individually synthesized is limited. Progress in solid phase synthesis, originally introduced by Merrifield [53–55], gave fast and automated access to individual oligomeric compounds. For the creation of large numbers of individual sequences of monomeric building blocks, various techniques of chemical synthesis have been developed. These fall into two groups, multiple synthesis and parallel synthesis. A good overview of the di erent building blocks used for combinatorial chemistry has been provided by Hogan [56]. In multiple synthesis, mobile support elements are employed. After each reaction cycle, the segments are separated and regrouped for the next coupling. Examples are the Tea Bag method [57], the use of segmented cellulose filters [58, 59] and the one–bead–one–compound approach [60], combined with the mix–and–split approach [61]. Parallel synthesis uses arrays of fixed reactors. Today, several thousand syntheses can be run in parallel due to miniaturization and rapid reagent application. The pin method [62] demonstrated the success of this
288 Hendrik Weiner et al.
approach in a convincing way. Geyen et al. performed their reactions on a replicating gadget that was dipped into a microtitre plate filled with reagents for peptide synthesis according to the anticipated sequence. Parallel synthesis on flat supports is another elegant and fast strategy of generating microarrays of biological macromolecules. Its most prominent examples [62] are the macroscopic DNA arrays on glass support, first described by Maskos & Southern [63], the photolithographic A ymax (later A ymetrix) technique [64], and the SPOT method [65–67].
The resulting libraries of natural or artificial building blocks can be screened for active compounds in hybridization or western blotting experiments, while still bound to the solid support used for their synthesis. Their respective position of synthesis is used for the identification of each binding partner. Alternatively, library members are transferred into solution, followed by testing them individually or as pools.
The techniques described above can either be used for synthesis of individual compounds or pools, by using mixtures of building blocks for the coupling reactions. This results in libraries of potential ligands in one reactor. An example for such a pooling strategy is the ‘mimotope’ approach [68] in which hexameric peptide sequences binding to a certain target structure are determined ab initio. This approach involves iterative testing of pools of peptides at randomized positions and leads to a hexameric peptide sequence with maximal binding strength to the target protein. Frank et al. [69] have proposed a modified version of the ‘mimotope’ approach that circumvents the iterative screening but allows for direct access to the optimal peptide sequence.
14.4.2 Peptide Libraries to Study Protein–Protein Interactions
Protein–protein interactions are generally believed to be conformationally defined. The contact area between proteins in a complex is often only small and comprises only a short sequence motif. Typical examples include SH3, WW, EBVH1, PDZ and armadillo repeat domains of signalling and structural proteins [70–72]. All these domains bind to short sequence motivs of certain target proteins. Such binding can be mimicked with short synthetic peptides that, however, have a much larger conformational freedom than the respective sequence motive of the target protein.
14.4.3 SPOT Method for the Creation of Peptide Arrays
Among the positionally addressable solid phase synthesis methods, the SPOT synthesis, developed by Ronald Frank [63], is an easy and flexible method for simultaneous, parallel chemical synthesis on membrane supports [66, 67]. SPOT synthesis is used for synthesis of di erent peptides or peptide mixtures at clearly defined positions on a modified cellulose membrane. These peptide arrays were used to study protein–protein and protein–peptide interactions [73]. In a western blot-like manner, the analyte is incubated with the
14 Protein, Antibody and Small Molecule Microarrays |
289 |
array on which potential binding partners were synthesized. The positions of binding of the analyte are detected with methods adapted from western blots, and signals can be directly translated into the sequence of the respective peptides.
Epitope mapping of antibodies [63, 74–76] was the first application of this technique. In addition, three di erent proline-rich repeats of Acta (actin assembly inducing protein A) were identified to be the ligands of VASP (vasodilator stimulated phosphoprotein) and other cellular proteins by Niebuhr et al. [77]. Furthermore, this technique was used to determine the peptide binding motifs of streptavidin [78], which eventually led to the development of the StrepTag [79, 80]. Protein–DNA [81] and protein–metal interactions [82] were studied using peptide arrays prepared by the SPOT method. An investigation of the CaM-regulated activity of the STOP protein in tubulin stabilization has been described recently [83]. A comprehensive review of applications of the SPOT method was published by Frank and Schneider-Mergener [84].
For manufacturing peptide arrays using the SPOT method, N–terminally and side chain-protected amino acids are dissolved in a solvent of low volatility. This solution is distributed by pipetting to defined positions on a modified cellulose membrane. Arrays of ninety–six spots of the size of a standard microplate can be generated manually. For the generation of arrays with more spots, up to 2,000 on a membrane of 20 ×20 cm, automated SPOT synthesizers have been developed in cooperation between Ronald Frank and Abimed GmbH Langenfeld, Germany. This robot is currently distributed by Intavis (http://www.intavis.com). In the original approach, the entire cellulose membrane was modified by coupling β–alanine (Fmoc–β–alanine) and removing the Fmoc protection group after completion of the coupling reaction. Today, more robust supports suitable for SPOT–synthesis are commercially available (e.g., AIMS Scientific, http://www.aims-scientific-products.de). A kit for the SPOT synthesis is available from Sigma Genosys (http://www.sigmagenosys.com/spot.asp). Technical details of the SPOT synthesis have been reviewed elsewhere [63, 85–87].
14.4.4 Alternative Peptide Array Technology
The throughput of the SPOT synthesis was increased with the introduction of the BioDisk Synthesizer [88]. In this approach, a rotating disk, made of a non-porous polymer, is used as support for the synthesis. Inkjet technology is employed for the delivery of activated protected amino acids and the deprotection reagents. Centrifugal force is used for the removal of the di erent reagents.
Photolithographic synthesis of peptide arrays was first described by Fodor et al. [64]. The application of this technology to the deprotection of oligonucleotide monomers bound to a suitable solid support resulted in the wellestablished A ymetrix oligonucleotide arrays. For the synthesis of such arrays, defined photomasks are used, limiting the flexibility of the approach.
290 Hendrik Weiner et al.
Pellois et al. [89] described recently the synthesis of peptide arrays relying on the highly flexible digital micromirror array [90] and conventional peptide chemistry with in-solution removal of acid–labile protecting groups using photogenerated reagents [91–94]. These arrays were used for mapping an antibody with natural and non-natural amino–acids.
Alternative arraying technologies are currently developed aiming at an increased spotting density and production rate of ligands. Various nanodispensing devices for microarrays have been developed recently (e.g., [95]). Laser printer technology has been used as an alternative approach to prepare peptide arrays on paper [96, 97]. Twenty toners are being developed containing Fmoc protected amino acids in a solvent that is solid at room temperature. During standard laser printing, the particles are heated on the paper and the amino acids are coupled to the paper support. The paper is washed to remove uncoupled monomers and subsequently N–terminal protection groups. The next amino acids are coupled to free amino groups of the first immobilized amino acids in the next printing cycle. Laser printing relies on the induction of positive charge by laser or LCD light. Negatively charged toner particles are attracted onto the paper by the positive charges underneath it. Therefore, it should be possible to replace the paper with a computer chip, while charged spots on such chips can be electronically ‘switched’.
References
1.Walter G, B¨ussow K, Cahill D, Lueking A, Lehrach H (2000) Protein arrays for gene expression and molecular interaction screening. Current Opinion in Microbiology 3(3): 298–302
2.Walter G, B¨ussow K, Lueking A, Glokler J (2002) High–throughput protein arrays: prospects for molecular diagnostics. Trends in Molecular Medicine 8(6): 250–253
3.Lennon GG, Lehrach H (1991) Hybridization analyses of arrayed cDNA libraries. Trends Genet 7(10): 314–317
4.B¨ussow K, Cahill D, Nietfeld W, Bancroft D, Scherzinger E, Lehrach H, Walter G (1998) A method for global protein expression and antibody screening on high– density filters of an arrayed cDNA library. Nucleic Acids Res 26(21): 5007–5008
5.de Wildt RM, Mundy CR, Gorick BD, Tomlinson IM (2000) Antibody arrays for high–throughput screening of antibody–antigen interactions. Nat Biotechnol 18(9): 989–994
6.Petricoin EF, et al. (2002) Use of proteomic patterns in serum to identify ovarian cancer. Lancet 359(9306): 572–577
7.Jenkins RE, Pennington SR (2001) Arrays for protein expression profiling: towards a viable alternative to two–dimensional gel electrophoresis? Proteomics 1(1): 13–29
8.Templin MF, Stoll D, Schrenk M, Traub PC, Vohringer CF, Joos TO (2002) Protein microarray technology. Trends Biotechnol 20(4): 160–166
9.Zhu H, Snyder M (2001) Protein arrays and microarrays. Curr Opin Chem Biol 5(1): 40–45

14 Protein, Antibody and Small Molecule Microarrays |
291 |
10.Schena M, Shalon D, Davis RW, Brown PO (1995) Quantitative monitoring of gene–expression patterns with a complementary–DNA microarray. Science 270(N5235): 467–470
11.MacBeath G, Schreiber SL (2000) Printing proteins as microarrays for high– throughput function determination. Science 289(5485): 1760–1763
12.BioChipNet [http://www.biochipnet.de/]
13.Microarray Electronic Library [http://www.arrayit.com/e–library/]
14.Conrads TP, Issaq HJ, Veenstra TD (2002) New tools for quantitative phosphoproteome analysis. Biochem Biophys Res Comm 290(3): 885–890
15.Ong SE, Blagoev B, Kratchmarova I, Kristensen DB, Steen H, Pandey A, Mann M (2002) Stable isotope labeling by amino acids in cell culture, SILAC, as a simple and accurate approach to expression proteomics. Mol Cell Proteomics 1(5): 376–386
16.Glover JF, Wilson TM (1982) E cient translation of the coat protein cistron of tobacco mosaic virus in a cell–free system from Escherichia coli. Eur J Biochem 122(3): 485–492
17.Blanar MA, Rutter WJ (1992) Interaction cloning: identification of a helix–loop– helix zipper protein that interacts with c–Fos. Science 256(5059): 1014–1018
18.Aebersold R, Mann M (2003) Mass spectrometry–based proteomics. Nature 422(6928): 198–207
19.Borrebaeck CA, Ekstrom S, Hager AC, Nilsson J, Laurell T, Marko-Varga G (2001) Protein chips based on recombinant antibody fragments: a highly sensitive approach as detected by mass spectrometry. Biotechniques 30(5): 1126–1130, 1132
20.Karlsson R, Kullman-Magnusson M, Hamalainen MD, Remaeus A, Andersson K, Borg P, Gyzander E, Deinum J (2000) Biosensor analysis of drug–target interactions: direct and competitive binding assays for investigation of interactions between thrombin and thrombin inhibitors. Anal Biochem 278(1): 1–13
21.Myszka D, Rich R (2000) Implementing surface plasmon resonance biosensors in drug discovery. Pharm Sci Technol Today 3: 310–317
22.Sali A, Glaeser R, Earnest T, Baumeister W (2003) From words to literature in structural proteomics. Nature 422(6928): 216–225
23.Gavin AC, et al. (2002) Functional organization of the yeast proteome by systematic analysis of protein complexes. Nature 415(6868): 141–147
24.Ho Y, et al. (2002) Systematic identification of protein complexes in Saccharomyces cerevisiae by mass spectrometry. Nature 415(6868): 180–183
25.Tyers M, Mann M (2003) From genomics to proteomics. Nature 422(6928): 193– 197
26.Mitchell P (2002) A perspective on protein microarrays. Nat Biotechnol 20(3): 225–229
27.B¨ussow K, Nordho E, L¨ubbert C, Lehrach H, Walter G (2000) A human cDNA library for high–throughput protein expression screening. Genomics 65(1): 1–8
28.Weiner H, Faupel T, B¨ussow K (2004) Protein arrays for cDNA expression libraries. In: Protein Arrays. Humana Press Inc
29.Anderson L, Seilhamer J (1997) A comparison of selected mRNA and protein abundances in human liver. Electrophoresis 18(3–4): 533–537
30.Ensembl Database [http://www.ensembl.org/Homo sapiens]
31.Cahill DJ (2001) Protein and antibody arrays and their medical applications. J Immunol Methods 250(1–2): 81–91
292 Hendrik Weiner et al.
32.Burchell JM, Mungul A, Taylor-Papadimitriou J (2001) O–linked glycosylation in the mammary gland: changes that occur during malignancy. J Mammary Gland Biol Neoplasia 6(3): 355–364
33.Safar JG, et al. (2002) Measuring prions causing bovine spongiform encephalopathy or chronic wasting disease by immunoassays and transgenic mice. Nat Biotechnol 20(11): 1147–1150
34.Mendoza LG, McQuary P, Mongan A, Gangadharan R, Brignac S, Eggers M (1999) High–throughput microarray–based enzyme–linked immunosorbent assay (ELISA). Biotechniques 27(4): 778–780, 782–776, 788
35.Huang RP, Huang R, Fan Y, Lin Y (2001) Simultaneous detection of multiple cytokines from conditioned media and patient’s sera by an antibody–based protein array system. Anal Biochem 294(1): 55–62
36.Arenkov P, Kukhtin A, Gemmell A, Voloshchuk S, Chupeeva V, Mirzabekov A (2000) Protein microchips: use for immunoassay and enzymatic reactions. Anal Biochem 278(2): 123–131
37.Haab BB, Dunham MJ, Brown PO (2001) Protein microarrays for highly parallel detection and quantitation of specific proteins and antibodies in complex solutions. Genome Biology 2(2): RESEARCH0004
38.Angenendt P, Gl¨okler J (2003) submitted
39.Angenendt P, Gl¨okler J, Murphy D, Lehrach H, Cahill DJ (2002) Toward optimized antibody microarrays: a comparison of current microarray support materials. Anal Biochem 309(2): 253–260
40.Peluso P, et al. (2003) Optimizing antibody immobilization strategies for the construction of protein microarrays. Anal Biochem 312(2): 113–124
41.Schweitzer B, Wiltshire S, Lambert J, O’Malley S, Kukanskis K, Zhu Z, Kingsmore SF, Lizardi PM, Ward DC (2000) Inaugural article: immunoassays with rolling circle DNA amplification: a versatile platform for ultrasensitive antigen detection. Proc Natl Acad Sci USA 97(18): 10113–10119
42.Schweitzer B, Kingsmore SF (2002) Measuring proteins on microarrays. Curr Opin Biotechnol 13(1): 14–19
43.Bernard A, Michel B, Delamarche E (2001) Micromosaic immunoassays. Anal Chem 73(1): 8–12
44.Hallborn J, Carlsson R (2002) Automated screening procedure for high– throughput generation of antibody fragments. Biotechniques Suppl: 30–37
45.Hanes J, Scha tzel C, Knappik A, Pluckthun A (2000) Picomolar a nity antibodies from a fully synthetic naive library selected and evolved by ribosome display. Nat Biotechnol 18(12): 1287–1292
46.Smith D, Collins BD, Heil J, Koch TH (2003) Sensitivity and specificity of photoaptamer probes. Mol Cell Proteomics 2(1): 11–18
47.Kramer K, Fiedler M, Skerra A, Hock B (2002) A generic strategy for subcloning antibody variable regions from the scFv phage display vector pCANTAB 5 E into pASK85 permits the economical production of F(ab) fragments and leads to improved recombinant immunoglobulin stability. Biosens Bioelectron 17(4): 305–313
48.He M, Taussig M (2001) Single step generation of protein arrays from DNA by cell–free expression and in situ immobilisation (PISA method). Nucleic Acids Res 29(15): e73
49.Petsko GA (1996) For medicinal purposes. Nature 384(6604 Suppl): 7–9
50.Abelson JN, ed (1996) Combinatorial Chemistry. Methods in Enzymology. Vol. 267, Academic Press: San Diego
14 Protein, Antibody and Small Molecule Microarrays |
293 |
51.Cortese R, ed (1996) Combinatorial Libraries; Synthesis, Screening and Application Potential. , Walter de Gruyter & Co: Berlin
52.Famulok M, Winnaker E-L, Wong C-H, eds (1999) Combinatorial Chemistry in Biology. , Springer Verlag: Berlin
53.Merrifield B (1986) Solid phase synthesis. Science 232(4748): 341–347
54.Merrifield RB (1963) Solid phase peptide synthesis. I. The synthesis of a tetrapeptide. J Am Chem Soc 85: 2149–2154
55.Merrifield RB (1965) Automated synthesis of peptides. Science 150(693): 178–185
56.Hogan JC, Jr. (1996) Directed combinatorial chemistry. Nature 384(6604 Suppl): 17–19
57.Houghten RA, Pinilla C, Blondelle SE, Appel JR, Dooley CT, Cuervo JH (1991)
Generation and use of synthetic peptide combinatorial libraries for basic research and drug discovery. Nature 354(6348): 84–86
58.Frank R, D¨ohring R (1988) Simultaneous multiple synthesis under controlled flow conditions on cellulose paper disks as segmental solid supports. Tetrahedron 44(19): 6031–6040
59.Frank R, Heikens W, Heisterberg-Moutsis G, Blocker H (1983) A new general approach for the simultaneous chemical synthesis of large numbers of oligonucleotides: segmental solid supports. Nucleic Acids Res 11(13): 4365–4377
60.Lam KS, Salmon SE, Hersh EM, Hruby VJ, Kazmierski WM, Knapp RJ (1991)
A new type of synthetic peptide library for identifying ligand–binding activity. Nature 354(6348): 82–84
61.Furka A, Sebestyen F, Asgedom M, Dibo G (1991) General method for rapid synthesis of multicomponent peptide mixtures. Int J Pept Protein Res 37(6): 487–493
62.Geysen HM, Meloen RH, Barteling SJ (1984) Use of peptide synthesis to probe viral antigens for epitopes to a resolution of a single amino acid. Proc Natl Acad Sci USA 81(13): 3998–4002
63.Maskos U, Southern EM (1992) Oligonucleotide hybridizations on glass supports: a novel linker for oligonucleotide synthesis and hybridization properties of oligonucleotides synthesised in situ. Nucleic Acids Res 20(7): 1679–1684
64.Fodor SP, Read JL, Pirrung MC, Stryer L, Lu AT, Solas D (1991) Light–directed, spatially addressable parallel chemical synthesis. Science 251(4995): 767–773
65.Frank R (1992) Spot synthesis: an easy techique for the positionally addressable parallel chemical synthesis on a membrane support. Tetrahedron 48: 9217–9232
66.Frank R (2002) High–density synthetic Peptide microarrays: emerging tools for functional genomics and proteomics. Comb Chem High Throughput Screen 5(6): 429–440
67.Frank R (2002) The SPOT–synthesis technique. Synthetic peptide arrays on membrane supports–principles and applications. J Immunol Methods 267(1): 13–26
68.Geysen HM, Rodda SJ, Mason TJ (1986) A priori delineation of a peptide which mimics a discontinuous antigenic determinant. Mol Immunol 23(7): 709–715
69.Frank R (1995) Simultaneous and combinatorial chemical synthesis techniques for the generation and screening of molecular diversity. J Biotechnol 41(2–3): 259–272
70.Cantley LC, Songyang Z (1994) Specificity in recognition of phosphopeptides by srchomology 2 domains. J Cell Sci 18: 121–126
294 Hendrik Weiner et al.
71.Macias M, Hyv¨onen M, Baraldi E, Schultz J, Sudol M, Saraste M, Oschkinat M (1996) Structure of the WW domain of a kinase–associated protein complexed with a proline–rich peptide. Nature 382: 646–649
72.Spink KE, Fridman SG, Weis WI (2001) Molecular mechanisms of beta–catenin recognition by adenomatous polyposis coli revealed by the structure of an APC– beta–catenin complex. EMBO J 20(22): 6203–6212
73.Reineke U, Kramer A, Schneider-Mergener J (1999) Antigen sequence– and library–based mapping of linear and discontinuous protein–protein–interaction sites by spot synthesis. Comb Chem Biol 243: 23–36
74.Darji A, Niebuhr K, Hense M, Wehland J, Chakraborty T, Weiss S (1996)
Neutralizing monoclonal antibodies against listeriolysin: mapping of epitopes involved in pore formation. Infect Immun 64(6): 2356–2358
75.Hohne WE, et al. (1993) Structural base of the interaction of a monoclonal antibody against p24 of HIV–1 with its peptide epitope. Mol Immunol 30(13): 1213–1221
76.Martens W, Greiser-Wilke I, Harder TC, Dittmar K, Frank R, Orvell C, Moennig V, Liess B (1995) Spot synthesis of overlapping peptides on paper membrane supports enables the identification of linear monoclonal antibody binding determinants on morbillivirus phosphoproteins. Vet Microbiol 44(2–4): 289–298
77.Niebuhr K, Ebel F, Frank R, Reinhard M, Domann E, Carl UD, Walter U, Gertler FB, Wehland J, Chakraborty T (1997) A novel proline–rich motif present in ActA of Listeria monocytogenes and cytoskeletal proteins is the ligand for the EVH1 domain, a protein module present in the Ena/VASP family. Embo J 16(17): 5433–5444
78.Schmidt TGM, Koepke J, Frank R, Skerra A (1996) Molecular interaction between the Strep–tag a nity peptide and its cognate target, streptavidin. J Mol Biol 255(5): 753–766
79.Schmidt TG, Koepke J, Frank R, Skerra A (1996) Molecular interaction between the Strep–tag a nity peptide and its cognate target, streptavidin. J Mol Biol 255(5): 753–766
80.Voss S, Skerra A (1997) Mutagenesis of a flexible loop in streptavidin leads to higher a nity for the Strep–tag II peptide and improved performance in recombinant protein purification. Protein Eng 10(8): 975–982
81.Kramer A, Volkmer-Engert R, Malin R, Reineke U, Schneider-Mergener J (1993)
Simultaneous synthesis of peptide libraries on single resin and continuous cellulose membrane supports: examples for the identification of protein, metal and DNA binding peptide mixtures. Pept Res 6(6): 314–319
82.Malin R, Steinbrecher A, Semmler W, Noll B, Johannson B, Fr¨ommel C, Schneider-Mergener J (1995) Identification of technetium–99m binding peptides using cellulose–bound combinatorial peptide libraries. J Am Chem Soc 117: 11821–11822
83.Bosc C, Frank R, Denarier E, Ronjat M, Schweitzer A, Wehland J, Job D (2001) Identification of novel bifunctional calmodulin–binding and microtubule– stabilizing motifs in STOP proteins. J Biol Chem 276(33): 30904–30913
84.Frank R, Schneider-Mergener J (2002) SPOT–synthesis – scope and applications. In: Kocj J, Mahler M (eds) Peptide arrays on membrane supports: a laboratory manual. Springer Verlag, Heidelberg
85.Frank R, Ho mann S, Kieb M, Lahmann H, Tegge W, Behm C, Gausepohl H (1996) Combinatorial synthesis on membrane supports by the SPOT technique:
14 Protein, Antibody and Small Molecule Microarrays |
295 |
imaging peptide sequence space. In: Jung G (ed) Combinatorial peptide and non-peptide libraries – a handbook. Verlag Chemie. pp 363–386
86.Frank R, Overwin H (1996) SPOT synthesis. Epitope analysis with arrays of synthetic peptides prepared on cellulose membranes. Methods Mol Biol 66: 149– 169
87.Kramer A, Schneider-Mergener J (1998) Synthesis and screening of peptide libraries on continuous cellulose membrane supports. Methods Mol Biol 87: 25–39
88.Adler F, T¨urk G, Frank R, Zander N, Wu W, Volkmer-Engert R, SchneiderMergener J, Gausepohl H (1999) A new array format for the automated parallel combinatorial synthesis by the SPOT–technique. In: Epton R (ed) Proc. International Symp. on ‘Innovation and Perspectives in Solid Phase Synthesis 2000 ’. Mayflower Worldwide, Kingswinford, York. pp 221
89.Pellois JP, Zhou X, Srivannavit O, Zhou T, Gulari E, Gao X (2002) Individually addressable parallel peptide synthesis on microchips. Nat Biotechnol 20(9): 922– 926
90.Singh-Gasson S, Green RD, Yue Y, Nelson C, Blattner F, Sussman MR, Cerrina F (1999) Maskless fabrication of light–directed oligonucleotide microarrays using a digital micromirror array. Nat Biotechnol 17(10): 974–978
91.Gao X, LeProust E, Zhang H, Srivannavit O, Gulari E, Yu P, Nishiguchi C, Xiang Q, Zhou X (2001) A flexible light–directed DNA chip synthesis gated by deprotection using solution photogenerated acids. Nucleic Acids Res 29(22): 4744–4750
92.Gao X, Yu P, LeProust E, Sonigo L, Pellois JP, Zhang H (1998) Oligonucleotide Synthesis Using Solution Photogenerated Acids. J Am Chem Soc 120(48): 12698– 12699
93.LeProust E, Pellois JP, Yu P, Zhang H, Gao X, Srivannavit O, Gulari E, Zhou X (2000) Digital Light–Directed Synthesis. A Microarray Platform That Permits Rapid Reaction Optimization on a Combinatorial Basis. J Comb Chem 2(4): 349–354
94.Pellois JP, Wang W, Gao X (2000) Peptide Synthesis Based on t–Boc Chemistry and Solution Photogenerated Acids. J Comb Chem 2(4): 355–360
95.Hughes TR, et al. (2001) Expression profiling using microarrays fabricated by an ink–jet oligonucleotide synthesizer. Nat Biotechnol 19(4): 342–347
96.Bischo FR, Stadler V, Breitling F (2003) Hochkomplexe Peptidarrays – Techniken, Anwendungen und Perspektiven. BioSpektrum 8:654-657
97.Breitling F, Breitling F, Felgenhauer T, Fernandez S, Leibe K, Beyer M, Stadler V, Bischo FR, Poustka A (2003) Hochkomplexe Peptidarrays auf Computerchips. : in press
98.Hultschig C, Two Dimensional Screening: Towards Establishing a Novel Technique to Study Biomolecular Interactions, in Gemeinsame naturwis-
senschaftliche Faklut¨at. 2000, Technische Universit¨at Carolo-Wilhelmina zu Braunschweig; Germany; available under: http://www.biblio.tu– bs.de/ediss/data/20000207a/20000207a.html

15
Photoaptamer Arrays
for Proteomics Applications
Drew Smith and Chad Greef
15.1 Introduction
In this chapter we describe the use of photoaptamers for protein detection in microarray format. We begin with a short review of aptamer technology in general, and a summary description of current methods for high throughput generation of photoaptamers. This section is followed by a description of making and using photoaptamer arrays for proteomics analysis.
Aptamers are nucleic acids that fold into complex shapes and have desirable properties such as ligand binding or catalysis. Aptamer technology was foreshadowed by the discovery of catalytic RNA [1,2] and was enabled by the development of e cient methods for chemical synthesis of DNA [3,4], in vitro transcription to produce RNA [5], reverse transcription of RNA to DNA [6,7] and DNA amplification by PCR [8]. These methods, combined with techniques to select interesting and useful nucleic acids, constitute the basis of SELEX, the process by which aptamers are generated [9, 10].
The basic principles and practice of SELEX have been described elsewhere [11–13]. Briefly, a library of randomized sequences (typically 30–60 nt) is synthesized. Flanking the randomized region are regions of fixed sequence that serve as primer binding sites for PCR and for transcription initiation if an RNA library is to be generated. Much of the power of the SELEX process is due to the size of the starting libraries that can be generated. A library of 30 nt contains 430 (1018) distinct sequences; in practice, about 1014 sequences (1 nmol, or 25 g) are conveniently used – a ‘genome’ orders of magnitude larger than any biological genome. This library can be used directly for DNA SELEX, or is transcribed for RNA SELEX. Partitioning more-active from less-active sequences is the most critical step in a SELEX experiment, and constitutes much of the art of the process. Since most SELEX experiments are aimed at obtaining ligand binders, partitioning schemes typically exploit physical di erences between free and ligand-bound aptamers as their basis. Partitioning methods include filter–binding, electrophoretic and chromatographic mobility shifts, capture by immobilized targets (including cells and
298 Drew Smith et al.
tissues) and variations of these techniques. Once separated, the enriched pools are recovered, reverse-transcribed (if RNA) and amplified by PCR to begin another cycle. SELEX experiments typically require 6–12 cycles to converge upon a few tens of active sequences.
Aptamers have been developed for use as therapeutic agents [14], as in vivo imaging agents [15, 16], as intraand extra-cellular inhibitors of protein function in vivo and in tissue culture [17–22], as cell–surface labels [23,24], as probes for target validation and drug design [25–27], as a nity purification reagents [28], and as diagnostic reagents in microwell [29–33] and microarray format [34].
The use of aptamers in the latter format is the subject of this chapter. The use of aptamers in microarray format for protein detection is a natural extension of both aptamer and microarray technologies. Like antibodies, aptamers have been discovered for a broad range of target proteins (see the Aptamer Database http://aptamer.icmb.utexas.edu/index.html), have a nities that are typically nanomolar or better, and show excellent discrimination between their targets and closely related proteins [35–40]. However, the nature of aptamers lends itself to microarray applications: nucleic acids, especially DNA, are chemically stable and resistant to degradation (except by nucleases); DNA molecules are readily synthesized by automated methods; the incorporation of modifications for array attachment is simple; and the SELEX process itself can be automated for high throughput discovery [41–43].
Our approach to microarray detection employs photoaptamers as capture agents. Photoaptamers are photoactivated crosslinking aptamers [44,45]. The covalent complex that is generated between aptamer capture agent and target protein simplifies processing and analysis of the microarray: unbound protein can be washed away using denaturing conditions, and the captured protein can be labelled in situ for detection [46,47]. The photocrosslinking reaction is quite specific and aids in the rejection of non-specific binding, particularly by proteins with high a nity for DNA [48]. Photocrosslinking activity is imparted by incorporating BrdU into SELEX libraries. Irradiation at 300 nm or longer wavelengths generates the 5–uridinyl radical which will react with proximal electron-rich amino acids, causing covalent complex formation [49–51].
15.2 Overview of Photoaptamer Discovery
and High Throughput Production
The first photoSELEX experiments exploited electrophoretic mobility shifts to partition crosslinked from free DNA or RNA [44, 45]. Although e ective, this method is time–consuming and is di cult to scale. Microbead partitioning can be adapted to a 96–well format, because suspensions of beads can be easily mixed and transferred by standard liquid handling equipment. Bead suspensions can then be converted from liquid to solid phase by filtration or magnetic
15 Photoaptamer Arrays for Proteomics Applications |
299 |
partitioning. This versatility has led to the choice of microbeads for SELEX scale–up and automation at SomaLogic and in the Ellington group [41–43].
We employ three types of partitioning protocols in microbead format: protein immobilization on beads followed by photo–crosslinking of the SELEX library to the protein (bead photoSELEX); protein immobilization on beads followed by binding without crosslinking of the SELEX library to the protein (bead a nity SELEX); and photocrosslinking of the SELEX library to the target protein, followed by immobilization of the protein–DNA complexes on the beads (solution photoSELEX). These three protocols are outlined in Fig. 15.1.
|
|
ssDNA pool + bead:protein |
|
or, |
|
ssDNA pool + protein |
|
|||||||||||||
|
|
|
|
|
||||||||||||||||
|
|
|
|
|
|
|||||||||||||||
|
|
|
|
|
|
|
|
|
|
|
|
|
|
|
|
|
|
|
|
|
|
|
|
|
|
|
|
|
|
|
|
|
|
|
|
|
|
|
|
|
|
|
|
|
|
|
|
|
|
|
|
|
|
|
|
|
|
|
|
|
|
|
|
|
|
|
|
|
|
|
|
|
|
|
|
|
|
|
|
|
|
|
|
|
|
Bind |
|
|
Bind and irradiate |
|
|
|
|
Irradiate |
||||||||||
|
(bead affinity SELEX) |
|
|
(bead photoSELEX) |
|
|
(solution photoSELEX) |
|||||||||||||
|
|
|
|
|
|
|
|
|
|
|
|
|
|
|
|
|
|
|
|
|
|
|
|
Native wash |
|
|
|
|
Denaturating |
|
|
|
|
|
|
|
|||||
|
|
|
|
|
|
|
|
|
|
|
|
|||||||||
|
|
|
followed by |
|
|
|
|
|
|
|
|
|
|
|
||||||
|
|
|
|
|
|
|
wash |
|
Protein:DNA |
|
|
|||||||||
|
|
|
denaturating elution |
|
|
|
|
|
|
|
||||||||||
|
|
|
|
|
|
|
|
|
|
|
|
|
||||||||
|
|
|
|
|
|
|
|
|
|
|
|
|
|
|
|
|
|
|
|
|
|
|
|
|
|
|
|
|
|
|
|
|
|
|
|
Capture on tosyl beads |
|||||
|
|
|
|
|
Bead Protein:DNA |
|
|
|
||||||||||||
|
|
|
|
|
|
|
Denaturating wash |
|||||||||||||
|
|
|
|
|
|
|
|
|
|
|
|
|
|
|
||||||
Protease digest to elute crosslinked DNA Capture on primer beads,
Recovered ssDNA
PCR
dsDNA pool
Capture on streptavidin beads
Elute sense strand
Clone, sequence analyze
Fig. 15.1. Automated SELEX schemes. A ssDNA pool is mixed with beadimmobilized protein (the two left tracks) or with free protein (right track) and allowed to bind to target protein. For a nity selection, the beads are washed under native conditions, and sequences with binding activity are recovered by elution under denaturing conditions (bead a nity SELEX). Alternatively, the protein:DNA complexes on the beads are irradiated to form a covalent bond (bead photoSELEX). In the third alternative (solution photoSELEX) the soluble protein:DNA complexes are irradiated to form a covalent bond, and this complex is captured through the protein moiety on to tosyl-activated beads. The covalently-bound DNA is recovered by protease digestion. This DNA is then amplified and purified to start a successive round
300 Drew Smith et al.
These protocols share many common steps, and di er principally by covalent vs non-covalent binding of DNA to the target protein, and by the respective order of protein:DNA crosslinking vs protein:bead immobilization in the process. All of these processes are fully automated in 96–well format with the exception of moving plates to and from the PCR thermal cycler. The photoSELEX protocols are performed on a Cavro pipetting station modified to handle a fiber optic tool for the irradiation step. The a nity SELEX protocol can be performed on the Cavro or, more readily, on a TomTech 96–channel pipetting robot. A round of photoSELEX using these procedures requires 10–14 hours for a full 96–well plate. A nity SELEX requires 6–8 hours per round.
Successful SELEX experiments are typically completed in 6–9 cycles; additional cycles rarely improve aptamer pool activity. Because so many SELEX experiments can be performed in parallel, the task of identifying and synthesizing active sequences generally requires much more time and e ort than the selection process itself. We start by winnowing out those pools that have not converged from the 1014 sequences in the starting library to a few tens of sequences. This convergence is conveniently monitored by assessing the rate of reannealing of the double-stranded DNA products of the PCR step – a C0t assay [52]. The PCR sample is denatured by heating to 98◦ in the presence of the dye SYBR Green I, which fluoresces when bound to double-stranded DNA. The DNA is cooled to a temperature that allows reannealing of fully complementary sequences ( 87◦), and the gain in fluoresecence over time is monitored with a CCD camera. Converged pools typically regain full fluorescence in < 10 minutes. These pools are carried forward for activity analysis.
Photoaptamer pools can be screened for activity in solution or in microarray format. Because photoaptamers require a stable protein:DNA complex for photocrosslinking [49], active pools can be identified on the basis of their a n- ity for their target proteins. This is conveniently done by the nitrocellulose filter–binding assay, where radiolabelled DNA and excess protein are mixed and filtered, and the fraction of DNA bound is determined by scintillation counting or phosphorimaging of the filters [11].
The filter–binding assay yields a quantitative determination of protein– binding activity, typically expressed as a dissociation constant. A more qualitative assessment of activity can be determined in microarray format, as described below. With few exceptions, there is good agreement between the results of the two assays. The microarray assay is somewhat more stringent – pools and aptamers that have strong a nity for their target protein (< 10nM) show the best activity on microarrays, whereas lower a nity pools often (but not always) show little or no microarray activity. SELEX pools can be prepared for arraying by PCR with a 5 amino linker primer.
15 Photoaptamer Arrays for Proteomics Applications |
301 |
15.3 Using Photoaptamer Microarrays
Once pools from a SELEX experiment have been determined to have binding a nity and crosslinking activity to cognate protein they are cloned through a plasmid vector and individual sequences are determined. Alignment protocols identify sequence motifs among the di erent populations, as well as potential contaminants and spurious outliers. The sequences that are determined to have the greatest likelihood of representing the binding motif from the SELEX are chemically synthesized for activity screening by microarray and solution phase assays.
Chemical synthesis of photoaptamers is performed by standard phosphoramidite methods, with procedural modifications that have been optimized to maximize deprotection and recovery of full-length product. Aptamers are synthesized with appropriate attachment chemistries added as modified phosphoramidites. Product quality is confirmed with extensive HPLC, CGE, and ICR mass spec analysis. Since DNA synthesis is highly controllable the production of aptamers can be considered a very robust, manufacturable process, amenable to scale–up and quality control.
Synthetic photoaptamers are arrayed by standard contact printing methods with modifications that optimize loading, spot morphology, and aptamer activity. An important consideration is that the substrate must be chosen to minimize non-specific adsorption of DNA, as this will disrupt aptamer tertiary structure, limiting activity. We have found that commercially available microarray slides that present chemically functionalized polymer coatings allow high aptamer loading and activity. After printing, slides are processed by methods designed to render the remaining functional groups and the polymer coating inert to interaction with proteins and UPS (see below). Printed slides can be stored dry for extended periods with no loss of activity.
Photoaptamers arrays are used as discovery tools to screen pools for binding activity and individual cloned sequences for relative activity and cross– reactivity, but the ultimate goal is to evaluate protein levels in multiplex fashion from complex mixtures. In all cases the procedure to run a photoaptamer array assay is the same; protein samples are incubated over the array allowing a nity binding to occur, unbound protein is washed away, bound protein is photo–crosslinked to cognate aptamer, crosslinked protein is chemically labelled with a Universal Protein Stain (UPS), and the label is detected. Individual steps are detailed below:
Protein Binding
Protein samples are prepared in Protein Incubation Bu er (PIB) that matches as closely as possible the composition of the SELEX discovery bu er, in terms of bu er composition, salt content, and ionic strength. Carrier DNA is added, but has not been shown to be absolutely necessary. The photoaptamer arrays are prepared by equilibration in PIB for 15 minutes prior to introduction of
302 Drew Smith et al.
the protein mixture. Note that conventional, protein based blocking mixtures are not necessary. Once the protein mixture is applied to the array the mixture is allowed to incubate at 30◦C for at least 2 hours. For high sensitivity measurements longer incubation times may improve results. The protein incubation can be performed in either a static mode, in which the solution is allowed to interact with the array without dynamic movement, or in a flow mode, where solution is circulated over the array in either a continuous loop or a reciprocating fashion. For the static mode, simple reaction vessels are fashioned over the arrays by application of adhesive-backed wells or other similar devices, while for circulation mode more technically evolved solutions are required. Both methods yield equivalent results; the advantage of mixing is a reduction in the incubation time needed to reach maximal binding levels.
Pre-Crosslink Wash, Crosslinking, and Post-Crosslink Wash
At the end of the incubation period the protein solution is replaced with PIB, allowing removal of unbound protein while retaining cognate protein binding to aptamers through a nity interaction. The arrays are then exposed to UV irradiation, causing covalent crosslink formation between BrdU residues on the aptamers and proximal electron-rich amino acids of the cognate proteins. Optimal wavelength for the crosslink is 308 nm, which can be introduced by excimer laser excitation or broad spectrum UV which is filtered to eliminate sub–300 nm wavelengths. Optimal energy levels have been calibrated on the laser and empirically determined to be 3 J/cm2, which gives the highest levels of specific crosslinking.
The specificity imparted to the microarray assay in the crosslinking step is a key feature of photoaptamer technology. The photoSELEX process selects those aptamers that e ciently crosslink their target protein. Because the photoactivated complex is short-lived, e cient crosslinking requires close and stable contacts between BrdU and the target amino–acid, a requirement for π–bond orbital overlap has been proposed [50]. Although polyanion–binding proteins may bind to aptamer DNA, the probability that this binding will result in productive geometry for photocrosslinking is low. We have shown that the photocrosslinking step can improve aptamer specificity by an order of magnitude or more over the specificity due to a nity interactions alone [48]. Although these measurements were made in solution, they are consistent with results obtained on microarrays, both with simple protein mixtures and with target proteins spiked in to serum [48].
Since the crosslinked aptamer–protein complex is covalently linked to the substrate it is possible to use extremely rigorous denaturing conditions to fully remove any remaining proteins from the substrate or non-cognate array features. Examples of denaturing components of washing solutions include 0.02 M NaOH, 0.1 M AcOH, 1% SDS, 2% TritonX–100, 0.5 M NaCl, 0.02 M DTT, 8 M Urea, 4 M GuHCl, 50◦C, and sonication. However, since the binding interaction of aptamers to cognate proteins is extremely specific there is
15 Photoaptamer Arrays for Proteomics Applications |
303 |
generally little to be gained from stringent washes at this point, but eliminating non-specifically adsorbed protein from the substrate minimizes general background signal.
Signal Generation with Universal Protein Stain (UPS)
Because the only protein molecules present on the array at this point are those that are covalently crosslinked to their cognate aptamer, a global labelling step that targets protein-specific chemical moieties is employed. Generally, direct fluorescence detection provides adequate signal/noise, but alternative methods and/or signal amplification can boost response for high sensitivity applications. A number of methods to introduce fluorescent detection molecules have been used, including lysine-specific activated ester modified dyes, thiol specific maleimide modified dyes, nitrosylation of tyrosines followed by nitrotyrosine specific Ab, and biotinylation followed by TSA detection.
Fluorescence signal from photoaptamer arrays is measured by standard microarray scanning devices, providing raw data as 16–bit TIFF images. Data processing involves fitting ROI grids to the image via standard image processing software methods, extracting mean signal intensity from features, subtracting background signal derived from no–protein controls, and evaluating resultant values by comparing to standard curves generated through dose response control experiments. An internal database processes, collates, and stores data from experiments.
Figure 15.2 shows results from a model multiplex experiment in which a series of protein mixtures were created such that each mixture contained 14 proteins at di erent levels, each protein was represented at some level in each mixture, and the overall protein concentration of each mixture was constant. The mixtures were each assayed on discrete arrays, and the resultant data was deconvoluted to generate multiple standard curves from one assay series. The pseudo–color image shows boxed features corresponding to the endostatin standard curve series, while the other quadruplicate groupings correspond to other proteins in the mixtures.
15.4 Discussion
Development of microarray assays capable of rapid multplexed determination of absolute and relative levels of proteins in complex mixtures will enable many new capabilities in the fields of research proteomics, drug discovery, and clinical diagnostics. Multiplexed protein analysis in the microarray format will allow researchers to explore causal relationships between relative protein levels in samples and diseased states being studied while consuming far smaller volumes of precious samples than are required for current methods.
As the number of proteins available for study increases, unique signature patterns of protein levels in diseased state samples could become apparent,
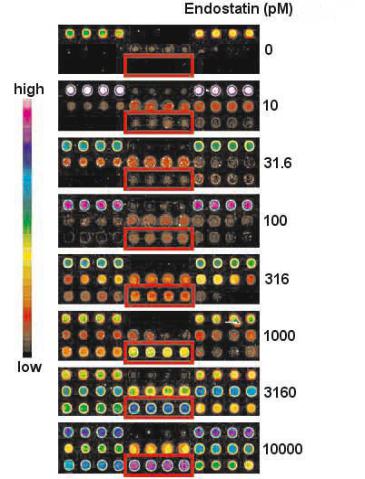
304 Drew Smith et al.
Fig. 15.2. |
Example of Multiplexed Standard Curve. Proteins were mixed |
in designed |
concentration combinations and assayed on photoaptamer arrays. |
Quadriplate photoaptamer features for Endostatin are highlighted, showing gradient in response over a range on concentrations
which will greatly expand the possibilities in early disease diagnosis, disease metabolism, and drug discovery. It is not di cult to imagine the application of diagnostic arrays in preventative medicine, in which pre-symptomatic diagnosis of many cancers and degenerative diseases will allow more e ective early treatments and greatly improve probabilities of successful outcomes.
Photoaptamer microarrays are a defining methodology in the field of proteomics. The ability to select highly specific binding reagents by directed methods provides a powerful tool for protein quantitation that has not yet been available. Further, ease of manufacture and photoaptamer stability al-
15 Photoaptamer Arrays for Proteomics Applications |
305 |
lows a wide range of applications that is unlimited by many of the constraints traditionally associated with biological reagents. The acquisition of photoaptamers is limited only by the availability of individual proteins, and as that repertoire and inventory increases the possibilities for photoaptamers will follow closely behind.
The obvious ambition for protein microarray technology is to supplant the laborious technologies now associated with proteomics: to make 2–D gel analysis and single–analyte ELISAs as obsolete for the study of protein expression as Northern blots have become for the study of mRNA expression. Microarray technology and its associated instrumentation are already cheaper, faster and more–robust than the suite of technologies associated with 2–D gel/mass spectrometry analysis. The acceptance of microarray technology for proteomic analysis now awaits the introduction of assay platforms that are as sensitive and comprehensive as the technologies we seek to replace.
The ideal microarray would combine the sensitivity of ELISA technology with the comprehensive proteome coverage of 2–D gel/MS technology. Antibody-based arrays have already shown impressive ELISA-like sensitivity in small multiplex arrays [53,54]. However, the need to identify and apply secondary labelling antibodies will soon become an important constraint on the degree of proteome coverage that can be achieved. Multiplexing with antibodies may fall well short of the coverage provided by 2–D gels. Photoaptamers start from a narrower technology base than do antibodies, but dispense with the need for a secondary reagent. As the degree of multiplexing becomes more critical in the development of protein microarray technology, the advantages of a format based on a single capture and detection reagent will become more important.
References
1.Guerrier-Takada, C., Gardiner, K. J., Marsh, T. L., Pace, N. R., and Altman, S. (1983). The RNA Moiety Of RNase P Is The Catalytic Subunit Of The Enzyme. Cell 35, 849–857
2.Kruger, K., Grabowski, P. J., Zaug, A. J., Sands, J., Gottschling, D. E., and Cech, T. R. (1982). Self-splicing RNA: autoexcision and autocyclization of the ribosomal RNA in-tervening sequence of Tetrahymena. Cell 31, 147–157
3.Beaucage, S. L., and Caruthers, M. H. (1981). Studies on Nucleotide Chemistry V. Deoxynucleoside Phosphoramidites A New Class of Key Intermediates for Deoxypolynucleotide Synthesis. Tetrahedron Lett 22, 1859
4.Matteucci, M. D., and Caruthers, M. H. (1981). Studies on Nucleotide Chemistry IV. Synthesis of Deoxyoligonucleotides on a Polymer Support. J Am Chem Soc 103, 3185
5.Studier, F. W., and Mo att, B. A. (1986). Use of bacteriophage T7 RNA polymerase to direct selective high–level expression of cloned genes. J Mol Biol 189, 113–130
6.Baltimore, D. (1970). RNA–dependent DNA polymerase in virions of RNA tumour viruses. Nature 226, 1209–1211
306 Drew Smith et al.
7.Temin, H. M., and Mizutani, S. (1970). RNA–dependent DNA polymerase in virions of Rous sarcoma virus. Nature 226, 1211–1213
8.Saiki, R. K., Scharf, S., Faloona, F., Mullis, K. B., Horn, G. T., Erlich, H. A., and Arnheim, N. (1985). Enzymatic amplification of beta–globin genomic sequences and restriction site analysis for diagnosis of sickle cell anemia. Science 230, 1350–1354
9.Ellington, A. D., and Szostak, J. W. (1990). In vitro selection of RNA molecules that bind specific ligands. Nature 346, 818–822
10.Tuerk, C., and Gold, L. (1990). Systematic evolution of ligands by exponential enrichment: RNA ligands to bacteriophage T4 DNA polymerase. Science 249, 505–510
11.Fitzwater, T., and Polisky, B. (1996). A SELEX primer. Methods Enzymol 267, 275–301
12.Gold, L., Polisky, B., Uhlenbeck, O., and Yarus, M. (1995). Diversity of oligonucleotide functions. Annu Rev Biochem 64, 763–797
13.Tuerk, C. (1997). Using the SELEX combinatorial chemistry process to find high a nity nucleic acid ligands to target molecules. Methods Mol Biol 67, 219–230
14.Eyetech Study Group. (2002). Preclinical and Phase 1a Clinical Evaluation of an Anti-Vegf Pegylated Aptamer (Eye001) for the Treatment of Exudative Age– Related Macular Degeneration. Retina 22, 143–152
15.Charlton, J., Sennello, J., and Smith, D. (1997). In vivo imaging of inflammation using an aptamer inhibitor of human neutrophil elastase. Chem Biol 4, 809–816
16.Hicke, B. J., Marion, C., Chang, Y. F., Gould, T., Lynott, C. K., Parma, D., Schmidt, P. G., and Warren, S. (2001). Tenascin–C aptamers are generated using tumor cells and purified protein. J Biol Chem 276, 48644–48654
17.Bless, N. M., Smith, D., Charlton, J., Czermak, B. J., Schmal, H., Friedl, H. P., and Ward, P. A. (1997). Protective e ects of an aptamer inhibitor of neutrophil elastase in lung inflammatory injury. Curr Biol 7, 877–880
18.Blind, M., Kolanus, W., and Famulok, M. (1999). Cytoplasmic RNA modulators of an inside–out signal–transduction cascade. Proc Natl Acad Sci USA 96, 3606– 3610
19.Hicke, B. J., Watson, S. R., Koenig, A., Lynott, C. K., Bargatze, R. F., Chang, Y. F., Ringquist, S., Moon-McDermott, L., Jennings, S., Fitzwater, T., et al. (1996). DNA aptamers block L–selectin function in vivo. Inhibition of human lymphocyte tra cking in SCID mice. J Clin Invest 98, 2688–2692
20.Ostendorf, T., Kunter, U., Grone, H. J., Bahlmann, F., Kawachi, H., Shimizu, F., Koch, K. M., Janjic, N., and Floege, J. (2001). Specific Antagonism of PDGF Prevents Renal Scarring in Experimental Glomerulonephritis. J Am Soc Nephrol 12, 909–918
21.Shi, H., Ho man, B. E., and Lis, J. T. (1999). RNA aptamers as e ective protein antagonists in a multicellular organism. Proc Natl Acad Sci USA 96, 10033– 10038
22.Vuyisich, M., and Beal, P. (2002). Controlling protein activity with ligand– regulated RNA aptamers. Chem Biol 9, 907
23.Davis, K. A., Lin, Y., Abrams, B., and Jayasena, S. D. (1998). Staining of cell surface human CD4 with 2 –F–pyrimidine–containing RNA aptamers for flow cytometry. Nucleic Acids Res 26, 3915–3924
24.Homann, M., and Goringer, H. U. (1999). Combinatorial selection of high a nity RNA ligands to live African trypanosomes. Nucleic Acids Res 27, 2006–2014
15 Photoaptamer Arrays for Proteomics Applications |
307 |
25.Bergan, R., Connell, Y., Fahmy, B., Kyle, E., and Neckers, L. (1994). Aptameric inhibition of p210bcr–abl tyrosine kinase autophosphorylation by oligodeoxynucleotides of defined sequence and backbone structure. Nucleic Acids Res 22, 2150– 2154
26.Green, L. S., Bell, C., and Janjic, N. (2001). Aptamers as reagents for high– throughput screening. Biotechniques 30, 1094–1096, 1098, 1100 passim
27.Maurel, M. C., Biard, B., Moulinier, C., Braz, D., Nugier, J., Chaumas, I., Reboud-Ravaux, M., and Decout, J. L. (2002). RNA–acting antibiotics: in-vitro selection of RNA aptamers for the design of new bioactive molecules less susceptible to bacterial resistance. J Pharm Pharmacol 54, 1019–1031
28.Romig, T. S., Bell, C., and Drolet, D. W. (1999). Aptamer a nity chromatography: combinatorial chemistry applied to protein purification. J Chromatogr B Biomed Sci Appl 731, 275–284
29.Drolet, D. W., Moon-McDermott, L., and Romig, T. S. (1996). An enzyme– linked oligonucleotide assay. Nat Biotechnol 14, 1021–1025
30.Fredriksson, S., Gullberg, M., Jarvius, J., Olsson, C., Pietras, K., Gustafsdottir,
S.M., Ostman, A., and Landegren, U. (2002). Protein detection using proximity– dependent DNA ligation assays. Nat Biotechnol 20, 473–477
31.Kato, T., Yano, K., Ikebukuro, K., and Karube, I. (2000). Bioassay of bile acids using an enzyme–linked DNA aptamer. Analyst 125, 1371–1373
32.Rye, P. D., and Nustad, K. (2001). Immunomagnetic DNA aptamer assay. Biotechniques 30, 290–292, 294–295
33.Stojanovic, M. N., and Landry, D. W. (2002). Aptamer-Based Colorimetric Probe for Cocaine. J Am Chem Soc 124, 9678-9679
34.Lee, M., and Walt, D. R. (2000). A Fiber–Optic Microarray Biosensor Using Aptamers as Receptors. Anal Biochem 282, 142–146
35.Bridonneau, P., Chang, Y. F., Buvoli, A. V., O’Connell, D., and Parma, D. (1999). Site–directed selection of oligonucleotide antagonists by competitive elution. Antisense Nucleic Acid Drug Dev 9, 1–11
36.Daniels, D. A., Sohal, A. K., Rees, S., and Grisshammer, R. (2002). Generation of RNA aptamers to the G–protein–coupled receptor for neurotensin, NTS–1. Anal Biochem 305, 214–226
37.Kensch, O., Connolly, B. A., Steinho , H. J., McGregor, A., Goody, R. S., and Restle, T. (2000). HIV–1 reverse transcriptase–pseudoknot RNA aptamer interaction has a binding a nity in the low picomolar range coupled with high specificity. J Biol Chem 275, 18271–18278
38.O’Connell, D., Koenig, A., Jennings, S., Hicke, B., Han, H. L., Fitzwater, T., Chang, Y. F., Varki, N., Parma, D., and Varki, A. (1996). Calcium–dependent oligonucleotide antagonists specific for L– selectin. Proc Natl Acad Sci USA 93, 5883–5887
39.Rehder, M. A., and McGown, L. B. (2001). Open–tubular capillary electrochromatography of bovine beta–lactoglobulin variants A and B using an aptamer stationary phase. Electrophoresis 22, 3759–3764
40.Ruckman, J., Green, L. S., Beeson, J., Waugh, S., Gillette, W. L., Henninger,
D.D., Claesson-Welsh, L., and Janjic, N. (1998). 2 –Fluoropyrimidine RNA– based aptamers to the 165–amino acid form of vascular endothelial growth factor (VEGF165). Inhibition of receptor binding and VEGF–induced vascular permeability through interactions requiring the exon 7–encoded domain. J Biol Chem 273, 20556–20567
308 Drew Smith et al.
41.Cox, J. C., and Ellington, A. D. (2001). Automated selection of anti-protein aptamers. Bioorg Med Chem 9, 2525–2531
42.Cox, J. C., Rajendran, M., Riedel, T., Davidson, E. A., Sooter, L. J., Bayer, T. S., Schmitz-Brown, M., and Ellington, A. D. (2002). Automated acquisition of aptamer sequences. Comb Chem High Throughput Screen 5, 289–299
43.Gold, L., Zichi, D., Jenison, R., and Schneider, D. WO 00/43534, Method and Apparatus for the Automated Generation of Nucleic Acid Ligands Golden, M. C., Collins, B. D., Willis, M. C., and Koch, T. H. (2000). Diagnostic potential of PhotoSELEX–evolved ssDNA aptamers. J Biotechnol 81, 167–178
44.Golden, M. C., Collins, B. D., Willis, M. C., and Koch, T. H. (2000). Diagnostic potential of PhotoSELEX-evolved ssDNA aptamers. J Biotechnol 81, 167–178
45.Jensen, K. B., Atkinson, B. L., Willis, M. C., Koch, T. H., and Gold, L. (1995).
Using in vitro selection to direct the covalent attachment of human immunodeficiency virus type 1 Rev protein to high–a nity RNA ligands. Proc Natl Acad Sci USA 92, 12220–12224
46.Brody, E. N., and Gold, L. (2000). Aptamers as therapeutic and diagnostic agents. J Biotechnol 74, 5–13
47.Brody, E. N., Willis, M. C., Smith, J. D., Jayasena, S., Zichi, D., and Gold, L. (1999). The use of aptamers in large arrays for molecular diagnostics. Mol Diagn 4, 381–388
48.Smith, D., Collins, B. D., Heil, J., and Koch, T. H. (2003). Sensitivity and specificity of photoaptamer probes. Mol Cell Proteomics 2, 11–18
49.Koch, T., Smith, D., Tabacman, E., and Zichi, D. (2004). Kinetic Analysis of Site–specific Photoaptamer–Protein Crosslinking. J Mol Biol 336: 1159–1173
50.Meisenheimer, K. M., and Koch, T. H. (1997). Photocrosslinking of nucleic acids to associated proteins. Crit Rev Biochem Mol Biol 32, 101–140
51.Norris, C. L., Meisenheimer, K. M., and Koch, T. H. (1997). Mechanistic studies relevant to bromouridine enhanced nucleoprotein photocrosslinking. Possible involvement of an excited tyrosine residue of the protein. Photochem Photobiol 65, 201–207
52.Charlton, J., and Smith, D. (1999). Estimation of SELEX Pool Size by Measurement of DNA Renaturation Rates. RNA 5, 1326–1332
53.Moreno-Bondi, M. C., Alarie, J. P., and Vo-Dinh, T. (2003). Multi–analyte analysis system using an antibody–based biochip. Anal Bioanal Chem 375, 120–124
54.Schweitzer, B., Roberts, S., Grimwade, B., Shao, W., Wang, M., Fu, Q., Shu, Q., Laroche, I., Zhou, Z., Tchernev, V. T., et al. (2002). Multiplexed protein profiling on microarrays by rolling–circle amplification. Nat Biotechnol 20, 359–365