


18
Whole Cell Microarrays
Ravi Kapur
18.1 Introduction
The post-genomic revolution is changing the face of drug discovery into a cell centric focus. It is predicted that cell-based screening in biopharmaceuticals will increase from 30% to 50% of all screening activities by 2005. The mapping of the genome has created a significant challenge of validating gene targets for specific disease states. Functional genomics within living cells is seen as a solution. Industrialization of cell biology will follow the path of industrialization of molecular biology; development of tools and techniques to gather and manage data with high throughput. The market drivers of gene sequencing, faster and cheaper, will also be drivers for extraction of the knowledge of the cellome. Additionally, the emerging marketplace for point–of–care diagnostics (POCD) presently focused on DNA and protein analysis will rapidly evolve into cell-based point–of–care diagnostics. It is projected that the growth rate of cell-based POCD will eventually exceed the growth rate of adoption of cellbased screening in biopharmaceuticals. In the recent past, cell-based assays have been assessed for utility as functional assays for detection, classification and identification of chemical and biological agents considered to be environmental pollutants or toxicants. As detection elements, living cells may play a critical role in early detection of change in the cellular milieu a ected by chemical or biological threat agents.
The use of whole cells to screen and diagnose drugs, target disorders, or environmental toxicants is presently rate-limited by the throughput, cost and meaningful interpretation of the intracellular pathways modulated by such agents. The tools and techniques responsible for revolutionizing the genomic era will similarly come into play for cell-based screening: hardware for high throughput data generation, and software for data management, information extraction and knowledge generation towards diagnosis.
336 Ravi Kapur
18.2 The Need
Functional cell-based assays serve as an early biological filter in various stages of the drug discovery process. They can serve the role of assays to tease out the validity of gene targets implicated in disease state in addition to testing the drug–responsiveness of said targets; in secondary screening to screen and rank–list the in-vitro safety and e cacy of lead compounds; for early toxicity profiling of lead compounds; and for early adsorption, distribution, metabolism and excretion (ADME) profiling across cells from multiple tissue types.
Similarly cells captured from patients with pathological states can be probed for surface markers or intracellular chromosomal abnormalities to detect and diagnose the target disorder whether it be viral infection or fetal/maternal genetic disorders.
The use of a panel of cell types such as mucosal, endothelial, immune and neurological can be used to profile the cellular signature in response to known toxicants of chemical and biological origin for eventual use in detection and classification of unknown chemical/biological samples.
The ultimate success of cell-based assays as functional tools for screening, detection, and diagnosis requires building of a knowledge base of cellular responses across multiple cell types and multiple chemical/biological molecules. The ability to generate this cellular knowledge base to enable in the future either a priori prediction of cellular activity or minimization of empirical experiments requires generation of a massive quantity of cellular information; the shotgun approach to cell biology. The ability to generate, manage and extract information from massive amounts of data in a cost-e ective way from live whole cell-based experiments is the cornerstone of the knowledge base of the cellome. Tools to enable massively parallel number of experiments will be required to decipher the cell much like the automation approach to decipher its predecessor, DNA.
18.3 The Solution
18.3.1 High Density Microplates
Automation of processes is the cornerstone of enabling high throughput yield, while miniaturization positively impacts both throughput and cost. The adoption of 96 well microplates, designed for enzyme linked immunosorbent assays, for culturing cells for use in screening was an attempt to increase throughput of data by parallelization of experiments. The continued drive for higher throughput at lower cost is leading to the migration of cell-based assays onto 384 well plates, and it is projected that 50% of cell-based assays will have migrated to the 384 well plate format over the next 4 years.
18 Whole Cell Microarrays |
337 |
Though there have been attempts to migrate cellular assays onto even higher density microplate formats, such as 1536 and 3456 well reaction plates, the success has been variable and constrained. The physical geometry of the high density micro wells impedes homogenous distribution of cells due to surface tension forces pulling the liquid to the edges and walls of the cylindrical or rectangular wells. Additionally, the low volume of each well, 1 l–3 l, necessitates a very tight control on evaporation-mediated compromise in cellular viability. This limits the practical utility of these high density cellular assay platforms to a few robust cell types for short incubation experiments.
In addition to the constraints of surface tension artifacts, higher density microplate platforms are likely to have intrinsic engineering issues related to optical flatness resulting in sphericity and astigmatism. Additionally, the interstitial material between wells can contribute to light piping between wells. This problem is compounded when scanning multiple wells in one scan and limits the throughput of readout.
18.3.2 Microarrays
For ultra-high density cellular platforms to be successful, there will need to be a departure from the large area footprint of traditional high density microplates. New planar platforms such as glass slides or plastic substrates with small footprints engineered and optimized for cell adhesion and optical microscopy, coupled to fluid delivery platforms will provide the solution for high throughput and low cost cell screening. The microarrays of cells on said planar substrates will reduce cost by reduction in consumption of cells, reagents and compounds. Increased throughput of screening will result from increased density of the cellular islands on a small macroscopic footprint permitting imaging of all cellular domains in one optical pass. The addressability provided by distinct pre-defined geometric localization of the cells, will further enable rapid high resolution readout of cellular domains positive for target activity. The planar substrates engineered for optical microscopy (optically flat, thin, and with low autofluorescence) will further enhance the throughput and quality of collected data.
Two functional classes of cellular microarrays can be envisioned to meet the needs of biopharma and biotech: 1) Single cell type high density arrays of one cell type for high throughput screening of multiple compounds, and 2) Multiple distinct cellular populations on a single chip screened across a single compound. The former serves the high throughput screening e orts, while the latter supports assay development, target validation and ADME–Tox.
18.3.3 Single Cell Type High Density Microarrays
Arraying a single cell type in distinct domains on a planar substrate followed by addressing each cellular domain with a distinct compound can enable high throughput screening of multiple compounds. The cell domain size can be
338 Ravi Kapur
controlled to accommodate the required number of cells, and the interstitial space between domains can be adjusted depending on the modality of delivery of compounds and reagents to the cellular domains.
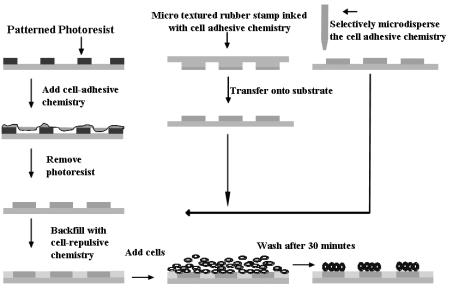
Microarray Fabrication can be achieved by selective deposition of celladhesive and cell-repulsive chemicals onto glass or plastic substrates. The cell adhesive chemistry can be deposited selectively via a stencil or mask using solution or vapor phase deposition. The cell repulsive chemistry can be backfilled in bulk. A cell adhesive molecule includes compounds that introduce charge or are polar, contain sulfur or amines, and are capable of binding cells or other cell binding molecules such as proteins, peptides and synthetic ligands for cell surface receptors. Cell repulsive molecules include hydrophobic organosilanes or hydrophilic molecules such as polyethylene glycol that repel protein adsorption. Surfaces with cell-repulsive and cell-adhesive chemistries when incubated with cells, will post-wash result in retention of cells on the adhesive regions.
Fig. 18.1. Schematic process of fabricating cellular arrays
There are many published methods for fabricating chemically modified substrates for formation of cellular microarrays, as reviewed in Chaps. 2, 3, 16 and 17 of this book and in [1–7]. The choice of thiols, organosilanes, cell adhesive peptides/proteins or other chemistries is dictated by access to technology, ease–of–use, desired pattern fidelity (ratio of number of cells in desired domains versus cells in interstitial regions), and desired time of retention of cells in domains (using chemistry as the barrier between 2 cellular domains is a time
18 Whole Cell Microarrays |
339 |
limited process; the chemical barrier degrades in its e ciency to resist protein adsorption and cell adhesion over time). The choice of micro–stamping, photoresist masking or micro–dispensing of the cell-adhesive chemistry is dictated by access to the technology, desired throughput and reliability, and desired density of cellular domains. Figure 18.1 is a schematic depiction of the various approaches to creating chemically selective surfaces to enable formation of microarrays of living cells.
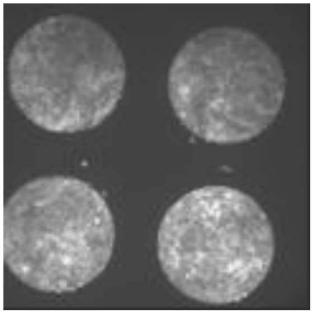
An additional emerging way of creating microarrays is to selectively micro– dispense the cells mixed with protein rich medium directly onto a highly hydrophobic and naturally cell repulsive substrate. A candidate material is poly(cyclic) olefin that appears to have fairly high resistance to breakdown of pattern fidelity of the microarrayed cells. Figure 18.2 shows an example of microarrayed cells on 1020R (polycyclic olefin available from Zeon Chemicals) fabricated by selective micro–dispensing. There is no cell-repulsive chemistry backfilled in the interstitial space. The cells are directly dispensed in fibronectin enriched medium onto spots of approximately 500–750 m diameter.
Fig. 18.2. Micro-dispensed cells on polycyclic olefin after 48 hours in culture
340 Ravi Kapur
18.3.4 Multiple Cellular Population Microarrays
For functional genomics, there is a need for high throughput analysis of gene function within living cells. Ziauddin and co-workers [8], using microarrays of full-length cDNA in expression vectors, demonstrated a recent innovation in high throughput functional genomics. Plating of living cells onto the cDNA arrayed glass slides resulted in uptake and expression of specific proteins in spatially distinct groups of cells residing on a common substrate. These 200 spatially distinct cell clusters, each expressing a unique intracellular or cell membrane protein, can be used to screen for the e ect of a single drug across 200 protein targets in one experiment. Additionally, the e ect of genes on cellular phenotype can be addressed with this model (see also Chap. 17).
Multiple tissue specific cell types can additionally be arrayed on a glass/ plastic substrate to serve in applications such as ADME–Tox (adsorption, distribution, metabolism, excretion and toxicology). The ability to measure the e ect of a single drug across multiple tissue specific cells enables an understanding of its side–e ects away from intended targets and generation of a toxicology profile across tissue types. Such arrays can be fabricated by microarraying cell-specific mono-clonal antibodies (mAB) onto a glass/ plastic substrate followed by incubation of cell–types with antigens specific to the arrayed antibodies. Eurogentec in collaboration with GenomicDevices & Diagnostics has developed a method of antibody based cell capture on chips which can be followed by a PCR or RT–PCR analysis [9]. The specificity of the antigen–antibody reaction will determine the e ciency of sorting of the cells and associated noise and cross–contamination within the array. This technique works well for sorting blood cells and is aided by the commercially available high purity antibodies for blood cell specific antigens. Incubating the mAB arrayed substrate with one cell type, followed by a wash, and incubation with a second cell type decreases the non-specific adsorption mediated cross–contamination as compared to incubating a mixture of all cell types on the substrate. Commercially available mAB arrays from Beckton Dickenson or home-brewed arrays (with control on spot size, type of antibody and array density) can be used to generate microarrays of multiple cell types on a common substrate.
A third approach to generating multi-cellular arrays with a wide bandwidth of cell types is the use of microarrays of cell di erentiating factors to induce on-chip di erentiation of totipotent/pluripotent cells into tissue specific cells [10]. In this approach, stem cell di erentiating factors are microarrayed on a glass/plastic substrate using commercial o –the–shelf automated liquid handling tools. The interstitial region between domains is chemically modified to prevent cell–adhesion. Totipotent or pluripotent cells are incubated with the substrate and bind to the domains containing distinct cell di erentiating factors. Interaction of the cells with the underlying di erentiating molecules results in each domain having a cellular phenotype and genotype corresponding to its di erentiated state.
18 Whole Cell Microarrays |
341 |
Figure 18.3 is a schematic depiction of the various approaches to creating microarrays of multiple cell types or single cell-type expressing distinct proteins in discrete clusters.
18.4 Challenges and Opportunities for Cellular Micrroarrays
18.4.1 Challenges
While it is easy to draw on the development and adoption of DNA microarray technology as a baseline guide for development and adoption of cellular microarrays, the distinction between the two technologies lies in the complexity of the biological entity being miniaturized. Cells–on–a–chip is not ‘lab–on–a– chip’ it is ‘life–on–a–chip’. The extreme sensitivity of cells to pH, temperature, humidity, nutrients, and waste products exponentially increases the challenge associated with creating stable and reproducible arrays. The di erential adhesivity of cells to surfaces and their change in functional response on adhesion to artificial substrates further compounds the complexity of using cellular microarrays for screening or diagnostics. Unlike DNA microarrays that can be stabilized for extended shelf life, cellular microarrays have a functional fi- nite life in culture (24–72 hours) further reducing their flexibility of use. The
Fig. 18.3. Schematic depiction of process of reverse transfection, Ziauddin et al.(a); monoclonal antibody mediated cell sorting (b); and cell–di erentiation mediated multi-cellular microarrays (c)
342 Ravi Kapur
density of cellular microarrays will be limited by the large biological variance in cell populations. The large baseline variance of functionality of cells in culture, more profound in primary cells, places sharp statistical limits on the minimum number of cells required to make an accurate determination of change in functionality in response to a compound. Theoretically, use of single cells for screening/diagnosis is feasible for highly controlled model cell systems exhibiting very low variance in baseline response. Practically, for real world cellular lines and primary cell types, a minimum of 100 cells is required to make a statistically relevant detection. This limits the absolute obtainable density for cellular microarrays. For open systems requiring exposure of the planar cellular microarrays to a liquid dispensing device for spatially controlled treatment of the cellular domains with distinct compounds, sterility and evaporation will require careful management. These requirements will add to the technical challenge and cost of developing the technology for adoption by mainstream markets. Lastly, to bring cellular microarrays to practice as a tool for high throughput screening and point–of–care diagnostics will require the development and standardization of hardware, software, biological reagents, cell lines, and processes.
18.4.2 Opportunities
The rapidly growing cell-based screening market (compound annual growth rate at 3%) in biopharma is the single most important determinant for the successful adoption of cellular microarrays. The present screening platforms are centered on use of high density microplates compatible with the liquid handling tools residing in biopharma. Eventually, the drive for higher throughput at lower cost will drive the momentum towards adoption of integrated, and miniaturized whole platform solutions centered on cellular microarrays on planar substrates. It is projected that 50% of all assays will migrate to cell-based assays in biopharma by 2005. Most of this conversion will be driven in 96 and 384 well microplates. The use of 1536 well microplates for cell-based assays is unsuitable, except for a few niche cell types and applications. As such, if the microarray driven platform is positioned correctly, its adoption into the early stage markets and eventually into the mainstream markets will be seamless with the needs of biopharma. This provides a 4–5 year window of opportunity for development and validation of the technology beyond its present prototype stage.
In parallel to the development of the core technology and product o ering, the ongoing commercial development of technologies centered on liquid handling, chemically modified surfaces and cell stabilization will positively impact the development and utility of the whole product o ering. Commercially available liquid handling tools (such as from Cartesian, Packard, Picoliter) to array cells on commercially available chemically microarrayed substrates [11] will hasten the development and standardization of tools and techniques to serve the core technology development. The ongoing development of technolo-
18 Whole Cell Microarrays |
343 |
gies for cell preservation and stabilization by means as varied as cryopreservation, freeze–drying or room temperature drying will dramatically impact the utility and flexibility of the whole product o ering by enabling extended shelf–life of the consumable microarrayed substrates.
The ultimate success of cellular microarrays will be driven by the ability of the technology to deliver on the promise of faster, cheaper, smaller and better to enable industrialization of cell biology.
References
1.Singhvi, Engineering cell shape and function, Science, Vol. 264, pp 696
2.Thomas, Surfaces designed to control the projected area and shape of individual cells, Journal of Biomechanical Engineering, Vol. 121, pp 40, 1994
3.Bhatia, Controlling cell interactions by micropatterning in co-cultures: Hepatocytes and 3T3 fibroblasts, J. Biomed. Mater. Res., Vol. 34, pp 189, 1997
4.Kapur, Cellular and cytoskeleton morphology and strength of adhesion of cells on self–assembled monolayers of organosilanes, Exp. Cell Res., Vol. 244, pp 275, 1998
5.Matsuda, Development of micropatterning technology for cultured cells, ASAIO Trans, Vol. 36, pp 559, 1990
6.Matsuda, Development of surface photochemical modification method for micropatterning of cultured cells, J. Biomed. Mater. Res., Vol. 29, pp 749, 1995
7.Mrksich, Using microcontact printing to pattern the attachment of mammalian cells to self–assembled monolayers of alkanethiolates on transparent films of gold and silver, Exp. Cell Res., Vol. 235, pp 305, 1997
8.Ziauddin, Microarrays of cells expressing defined cDNAs, Nature, Vol. 411, pp 107, 2001
9.Eurogentec Inc., http://www.eurogentec.be
10.Kapur, International Patent Publication Number WO 00/60356, October 12, 2000
11.Creative Scientific Methods– http://www.cre8ive–sci.com Erie Scientific Co., Schott Glass Co

19
Tissue Microarrays for Miniaturized High-Throughput Molecular Profiling of Tumors
Ronald Simon, Martina Mirlacher, and Guido Sauter
19.1 Introduction
High throughput expression screening methods, like cDNA microarrays which allow the simultaneous expression analysis of tens of thousands of genes in one experiment, have fundamentally changed the way potentially significant genes are discovered. More recently, modern proteomics tools have been employed to survey the expression of hundreds or thousands of genes at the protein level [1]. Such methods are now extensively used in both academic and industrial research. As a result, hundreds or thousands of ESTs, genes or gene products with a potential role in non-neoplastic or neoplastic diseases have been discovered.
Many of these findings may eventually lead to clinically useful applications. For example, disease specific overexpression of a gene can be exploited in a diagnostic test. In the best case, a gene being overexpressed or functionally altered in a particular disease could serve as a therapeutic target. To further investigate the potential utility of a newly detected gene alteration, it is important to collect profound information on the epidemiology of the candidate gene expression in a multitude of diseased and non-diseased tissues. New technology is also facilitating high throughput analysis of multiple di erent tissues. For example, this can be achieved by multi–tissue Northern blots, protein arrays, or high throughput real time PCR facilities [2–5]. However, all these methods share the disadvantage that disintegrated tissues are used and that the cell types expressing a gene of interest cannot be identified. This is problematic because candidate genes can be expressed in multiple di erent tissue compartments. In-situ technologies such as immunohistochemistry (IHC), RNA in-situ hybridization (RNA–ISH) or fluorescence in situ hybridization (FISH) are therefore optimal for molecular epidemiology studies. However, such large-scale in-situ tissue analyses were cumbersome and slow when traditional methods of molecular pathology were used. Moreover, cutting of traditional tissue sections for in-situ analysis would rapidly exhaust valuable tissue resources since not more than 200 sections can typi-
346 Ronald Simon et al.
cally be made from one tissue block. To overcome these shortcomings we have recently developed a tissue microarray (TMA) technique [6]. In this method up to 1,000 di erent tissue samples can be combined on one microscope glass slide and then be simultaneously analyzed by in-situ analysis methods.
19.2 The TMA Technology
The availability of a large collection of well-characterized tissues – optimally with attached clinical data – is the most important prerequisite to benefit from the TMA technology. Accordingly, most of the work related to the manufacturing of TMAs is similar to classical molecular pathology studies and includes collecting potentially relevant tissues, reviewing all the corresponding slides, and selecting blocks for subsequent arraying. Depending on the degree of organization of a tissue archive and its related databases, the time needed for this part of the project varies greatly.
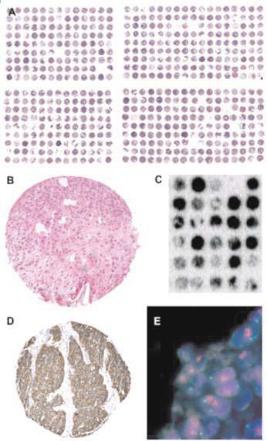
The tissue arraying process itself is simple. The key components of the commercially available tissue microarraying devices are two needles with a slightly di erent diameter. With the smaller needle (outer diameter 0.6 mm), holes are punched into empty ‘recipient’ para n blocks. Subsequently, a slightly larger needle (inner diameter 0.6 mm) is utilized to transfer tissue cylinders from preexisting ‘donor’ para n blocks into these pre-made holes at specific coordinates. Regular microtomes can then be used to cut tissue microarray sections. An adhesive coated slide system (Instrumedics, Hackensack, New Jersey) facilitates the cutting. TMA sections can be used for all types of in situ analyses including immunohistochemistry (IHC), fluorescence in situ hybridization (FISH) or RNA in situ hybridization. Figure 19.1 shows an overview of an H&E stained TMA section as well as examples of IHC and ISH results.
19.3 The Representativity Issue
The question of whether or not a small sample measuring 0.6 mm in diameter can be representative of an entire, potentially heterogeneous tumor has been a major concern in the early period of using TMAs [7–11]. At least 20 studies have compared IHC findings on TMAs and their corresponding traditional ‘large’ sections [7,9,10,12–28], with the vast majority of them revealing a high level of concordance of results [7,9,10,12,13,15,17,18,20,21,23–28]. In several of these studies, multiple samples were taken from the donor blocks in order to determine how many samples are needed to obtain results on TMAs that are su ciently concordant to those observed in large section analyses. In general, these studies found that two or three samples provided more representative information than a single sample [7, 9, 12, 13, 24] and that adding more than
19 Tissue Microarrays |
347 |
Fig. 19.1. Examples for TMAs. H&E stained bladder cancer tissue micro array section (a), and a magnification of one H&E stained tissue spot (b). (c) Autoradiography of RNA in-situ hybridization against Vimentin mRNA on a small TMA. The black staining intensity level indicates the Vimentin expression level. (d) Immunohistochemical detection of the Egfr protein. The panel E shows a FISH analysis of the Topoisomerase 2 alpha (TOP2A) gene. Blue staining indicates cell nuclei. Each nucleus contains 2 green (centromere 17) signals and multiple red (TOP2A) signals, indication TOP2A gene amplification
four or five samples would not lead to a massive improvement of the concordance level [7,24]. Camp et al. studied expression of ER, PR, and Her2 in 2–10 tissue cores obtained from the same donor blocks in a set of 38 invasive breast carcinomas. They found that analysis of 2 cores was su cient to obtain identical results as compared to the corresponding whole tissue sections in 95% of cases. 99% concordance was reached if 4 cores were analyzed, and analysis of additional cores did not result in a significant further increase of concor-
348 Ronald Simon et al.
dance [7]. Similarly, Hoos et al. analyzed 1–3 tissue cores from 59 fibroblastic tumors with heterogeneous Ki–67, p53, and pRB expression. Analysis of 3 tissue cores yielded concordance rates of 91% (pRB), 96% (Ki–67), and 98% (p53) respectively, compared to whole tissue sections [9]. Recently, Rubin et al. determined the optimal sample number for immunohistochemical Ki–67 measurement in 1–10 cores of 88 prostate cancers. In this study, 3 cores were required to optimally represent Ki–67 expression with respect to the standard tumor slide, whereas 3–4 cores gave the optimal predictive value for clinical outcomes. More than 4 cores did not add significant information [24].
However, all these studies were based on the assumption that classical large sections – the current gold standard for molecular tumor tissue analysis
– is representative of an entire tumor. It is very possible that this notion is not always true. In the optimal case, a ‘large’ section will contain tumor tissue measuring 3 × 2 cm in diameter. Given a section thickness of 3 m the examined tumor volume is about 0.0018 cm3. This volume represents only 1/19,000 of a tumor with a diameter of 4 cm or 1/150,000 of a tumor with a diameter of 8 cm. A TMA sample measuring 0.6 mm in diameter represents a tumor volume of 0.00000108 cm3 that is 1/1,600 of a 3 × 2 cm tumor area on a ‘large’ section. Considering these numbers, the representativity problem is about 1,000 times greater between the entire tumor and a traditional ‘large’ section than between a TMA sample and a ‘large’ section.
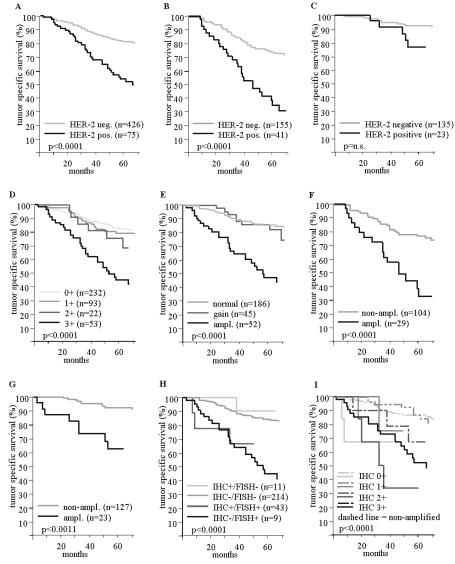
These calculations suggest that studies investigating the utility of molecular analysis methods should rather address the question of whether or not established associations between molecular features and tumor phenotype or clinical outcome can be found. In fact, all studies that we are aware of using TMAs to reproduce firmly established associations between molecular features and tumor phenotype or prognosis revealed the expected significant results. For example, expected associations with clinical outcome were found in TMA studies for the KI67 labelling index in urinary bladder cancer [10], soft tissue sarcoma [29], and in Hurthle cell carcinoma [30], for vimentin expression in kidney cancer [20], and for expression of estrogen and progesterone receptor proteins [26] or HER–2 alterations in breast cancer patients [31]. The associations with prognosis that were obtained in a TMA analysis are shown for HER2 overexpression and HER2 amplifications in a set of 553 breast cancers in Fig. 19.2. Another study confirmed the known frequencies of amplification for Cyclin–D1, c–myc and HER2 in various cancer types [32]. A multitude of studies found associations between gene amplification or protein overexpression and tumor phenotype, e.g. cyclin E [33], FGFR1, RAF1 [34], MDM2 or CDK4 [35] amplification or MAGE–A4 expression [36] and stage and grade in bladder cancer, CK7 and CK20 expression and grade in colorectal carcinoma [37], IGFBP2 expression and hormone–refractory state [38], EIF3S3 amplification and stage [39], aneusomy and grade [40] or E–cadherin expression and tumor size [41] in prostate cancer, aneusomy and tumor type in brain tumors [42], particular expression profiles and histological subtypes in breast cancer [43] and synovial sarcoma [44], or SHP1 expression and tumor devel-
19 Tissue Microarrays |
349 |
opment in lymphomas [45]. In addition, it has been demonstrated that TMAs can be utilized for comprehensive analyses of amplicon architecture [35, 46]. Overall, these data clearly show that relevant data can be obtained in TMA studies. This is especially true if the TMAs used are large enough to provide su cient power for statistical analyses.
19.4 TMA Applications
More than 100 publications reviewing or using the TMA approach had been published at the end of 2002. Obviously there is a large variety of possible TMA applications. Virtually all research involving in-situ tissue analysis can be done in a TMA format. Most published studies have utilized TMAs in cancer research. TMAs that were applied in these projects can be divided into 5 di erent categories: prevalence TMAs, normal tissue TMAs, progression TMAs, prognostic TMAs, and TMAs composed of experimental tissues. Prevalence TMAs contain tumor samples without clinico–pathological data attached. Despite this limitation, they are highly useful to determine the prevalence of a given alteration in tumor entities of interest. Remarkably, tumor entities that can be successfully analyzed on prevalence TMAs include Hodgkin’s lymphoma [14,17,27]. This could not necessarily be expected since these tumors predominantly consist of reactive inflammatory cells with only few dispersed neoplastic Hodgkin or Reed Sternberg cells. Prevalence TMAs can contain tissue samples from various di erent tumor entities. The largest ‘multitumor’ TMA manufactured in our laboratory contained 4,788 di erent samples from 130 di erent tumor types [47]. This TMA is currently utilized for the analysis of multiple di erent markers on the DNA and protein level. In one study the frequency of 17q23 amplifications, which is linked to poor prognosis in breast cancer, was analyzed using FISH. The multitumor TMA analysis revealed that 17q23 amplification can occur in 18 additional tumor categories besides breast cancer, including tumors of the adrenal gland, lung, ovary, skin, soft tissue, stomach, thyroid gland, urinary bladder, and uterus [47].
Normal TMAs are especially important if candidate genes are evaluated for their potential utility as diagnostic reagents or therapeutic targets. For such applications, it is important to see whether candidate genes are also expressed in normal tissues. In case of potential therapeutic targets it would be most important to know whether vital organs like brain, heart, kidney, liver or bone marrow cells expressed a candidate gene.
Progression TMAs contain samples of di erent stages of one particular tumor type [6, 48–50]. For example, an ideal prostate cancer progression TMA would contain samples of either normal prostate, benign prostatic hyperplasia (BPH), prostatic intraepithelial neoplasia (PIN), incidental carcinomas (stage pT1), organ confined carcinomas (pT2), or carcinomas with extraprostatic growth (pT3–4), as well as metastases and recurrences after androgen withdrawal treatment. TMAs are also suited to study progression within tu-
350 Ronald Simon et al.
Fig. 19.2. HER–2 protein overexpression / gene amplification and tumor specific survival in patients with ductal breast cancer. The curves show the associations of HER–2 protein overexpression with poor prognosis in all patients (a), and in the subgroups of nodal positive (b), and nodal negative tumors (c). The influence of the HercepTest score on prognosis is shown in (d). The relationship of HER–2 gene amplification with prognosis is shown for all patients (e), nodal positive (f), and nodal negative tumors (g). For (e) a HER–2 gain is defined as a HER–2/centromere 17 ration ratio of > 1 and < 3. The prognostic impact of combined FISH and IHC results is shown in (h) and (i)
19 Tissue Microarrays |
351 |
mors. TMAs can easily include large numbers of pairs of primary tumors and their non-invasive precursor lesions, metastases, or recurrences after specific treatment. In our laboratory we have constructed a TMA composed of tissues from 196 nodal positive breast carcinomas. From each tumor, one sample was taken from the primary tumor and from each of three di erent metastases. Together with samples from 196 nodal negative breast carcinomas this ‘breast cancer metastasis TMA’ contains almost 1000 tissue samples. In a recent study, we used this array to demonstrate a high concordance in the HER2 amplification/overexpression between primary tumors and their nodal metastases [51].
Prognosis TMAs contain samples from tumors with available clinical follow–up data. Molecular features were analyzed for their prognostic significance in bladder [33, 35, 52], breast [15, 26, 31, 53–55], prostate [56–58], brain [25,59,60], liver [61], kidney [20], and colorectal tumors [62–64], Hodgkin’s lymphoma [14], and malignant melanoma [65]. Although all recent prognosis TMAs comprised tissues from retrospective studies from heterogeneously treated patients, these TMAs proved to be highly useful. For example, significant associations were found between 17q23 amplifications [31] or Cox2 expression [55] and breast cancer prognosis, between Top2A expression and prognosis in glioblastoma [59], between MYC and AIB1 expression and prognosis in hepatocellular carcinoma [61], and between IGFBP2 and prostate cancer prognosis [38]. Future prognosis TMAs will increasingly contain homogeneously treated tumors as clinical trial groups are implementing the making of TMAs from patients included in clinical trials as part of their protocols.
TMAs can also be made from experimental tissues like cell lines [35,66] or xenografts. Cell line TMAs are especially useful for selections of optimal cell lines for subsequent functional analyses. For example, it is possible to screen hundreds of arrayed cell lines for amplification of a gene of interest. Amplified cell lines can then be ordered and, for example, utilized for testing potentially inhibiting drug candidates.
Obviously the use of TMAs is not limited to cancer research. TMAs have also been used in quality control. For example, TMAs can be used to compare the results of IHC analysis between di erent laboratories [67, 68]. It has also been suggested to place small TMAs containing a variety of normal tissues on slides that are used for diagnostic IHC thus providing optimal negative and positive controls [69].
19.5 Future Directions
TMA technology has become a widely accepted standard technology. Several attempts are under way to further improve and automate the technology. Prototype versions of automated tissue arrayers have now become commercially available. When they are operational, good quality TMAs can be produced.
352 Ronald Simon et al.
However, automated tissue arrayers will not noticeably improve the availability of TMAs since the assembling of a TMA is only a minor part of the entire TMA making process. Much more promising is the possibility of automated TMA analysis. Since one technician can manually stain more than 200,000 tissue samples per week, the reading of the TMA slides has become the major bottleneck in the system. In principle, TMAs are optimally suited for automated IHC analysis. The most critical step for automation of IHC analysis is the selection of the area to be analyzed. This selection has already taken place in TMAs. It is expected, that systems will soon become available that will automatically scan TMA slides and measure the intensity of staining for each individual TMA spot. In one of our studies we compared manual versus automated analysis of p21 staining on a colon cancer TMA, and we were able to identify a similar association with prognosis using our home made TMA analysis software to that detected after manual analysis (Marcel Ramseier, Simon H¨anggi, personal communication). In another study using a commercial system we found a 92.1% concordance in the interpretation of the Her2 status between manual and automated scoring [53]. However, Her2 is an easy to measure protein. Her2 is hardly expressed in non-neoplastic tissues, overexpression in tumors is usually at a high level, and excellent IHC staining kits are available. Automated measurement will be much more di cult for many other gene products, especially if expression occurs in multiple di erent cell types or cellular compartments or in case of significant background staining. Once automated imaging with or without image analysis can be performed, it is possible to link these data to other databases containing molecular, pathological or clinical data. For example, Manley et al. constructed an Internet based database comprised of interrelated data from 336 prostate cancer patients transferred into 19 TMA blocks with 5451 TMA biopsy cores. Automatically acquired digital images of the TMA spots were successfully analyzed over the Internet for several immunohistochemical biomarkers including E–cadherin, prostate-specific antigen, p27 (Kip1), and Ki–67 labelling index, and attached clinico–pathological data were used for subsequent statistical analyses [70]. This study shows nicely how TMA data with clinical and pathology information linked to an Internet database can assist collaborative multi–institutional studies.
19.6 Protocol
Manufacturing TMAs is a four–step process including sample collection, preparation of recipient blocks, construction of TMA blocks, and sectioning. The required materials and recommended laboratory procedures are briefly described below.
19.6.1 Sample Collection
• Exactly define the TMA to be made. Include normal tissues.
19 Tissue Microarrays |
353 |
•Collect all slides of these tissues from the archive.
•One pathologist must review all sections from all candidate specimens to select the optimal slide. Tissue areas suited for subsequent punching should be marked.
•Collect the tissue blocks that correspond to the selected slides. These blocks and their corresponding marked slides must be matched and sorted in the order of appearance on the TMA.
19.6.2 Preparing Recipient Blocks
•Melt para n at 60◦C, filtrate and pour it into a stainless steel mold. In contrast to normal para n blocks, tissue microarray blocks are cut at room temperature. Therefore, a special type of para n (‘Peel–A–Way’ para n;
Polysciences Inc., PA, USA) is recommended with a melting temperature between 53 and 55◦C.
•Place a slotted plastic embedding cassette (as used in every histology lab) on the top of the warm para n.
•Cool para n block down for 2 hours at room temperature and for 2 additional hours at 4◦C. Large recipient blocks (for example 30 ×45 ×10 mm) are easier to handle than the smaller blocks.
19.6.3 TMA Block Constuction
Only if all this preparatory work has been done can a tissue–arraying device be employed. At least two di erent tissue–arraying systems are now commercially available. Several groups have introduced inexpensive modifications to the existing commercially available manual non-automated arrayers, which markedly improve performance and facilitate arraying of frozen tissue. The TMA manufacturing process consists of five steps that are repeated for each sample placed on the TMA:
•punching a hole into an empty (recipient) para n block
•removing and discarding the wax cylinder from the needle used for recipient block punching
•removing a cylindrical sample from a donor para n block
•placing the cylindrical tissue sample in the pre-made hole in the recipient block
•proceeding to the new coordinates for the next tissue sample
Exact positioning of the tip of the tissue cylinder at the level of the recipient block surface is crucial for the quality and the yield of the TMA block. Placing the tissue too deeply into the recipient block results in empty spots in the first sections taken from the TMA block. Positioning the tissue cylinder not deep enough causes empty spots in the last sections taken from this TMA. As soon as all tissue elements are filled into the recipient block, the block is heated at 40◦C for 10 minutes. Protruding tissue cylinders are then gently pressed deeper into the warmed TMA block using a glass slide.
354 Ronald Simon et al.
19.6.4 TMA Block Sectioning
Regular sections can be taken from TMA blocks using standard microtomes. However, the more samples a TMA block contains, the more di cult regular cutting becomes. As a consequence, the number of slides of inadequate quality increases with the size of the TMA. In turn, fewer sections from the TMA block can e ectively be analyzed. Using a tape sectioning kit (Instrumedics Inc., NY, USA) facilitates cutting and leads to highly regular non-distorted sections (ideal for automated analysis). The use of the tape sectioning system is described below:
•Place an adhesive tape on the TMA block in the microtome immediately before cutting.
•Cut a section (usually 5 m). The tissue slice is now adhering to the tape.
•Place the tissue slice on a special ‘glued’ slide
•Expose the slide (tissue on the bottom) to UV light for 35 seconds (This leads to polymerization of the glue on the slide and on the tape).
•Dip the slide into TPC solution (Instrumedics) at room temperature for 5–10 seconds.
•Gently remove the tape from the glass slide leaving the tissue on the slide.
•Air dry slides at room temperature.
References
1.Schweitzer, B. and Kingsmore, S. F. Measuring proteins on microarrays. Curr Opin Biotechnol, 13: 14–19, 2002
2.Belin, D. The use of RNA probes for the analysis of gene expression. Northern blot hybridization and ribonuclease protection assay. Methods Mol Biol, 86: 87– 102, 1998
3.Bichsel, V. E., Liotta, L. A., and Petricoin, E. F., 3rd Cancer proteomics: from biomarker discovery to signal pathway profiling. Cancer J, 7: 69–78, 2001
4.Kallioniemi, O. P. Biochip technologies in cancer research. Ann Med, 33: 142– 147, 2001
5.Walker, N. J. Real–time and quantitative PCR: applications to mechanism–based toxicology. J Biochem Mol Toxicol, 15: 121–127, 2001
6.Kononen, J., Bubendorf, L., Kallioniemi, A., B¨arlund, M., Schraml, P., Leighton, S., Torhorst, J., Mihatsch, M., Sauter, G., and Kallioniemi, O. Tissue microarrays for high–throughput molecular profiling of hundreds of specimens. Nat Med, 4: 844–847, 1998
7.Camp, R. L., Charette, L. A., and Rimm, D. L. Validation of tissue microarray technology in breast carcinoma. Lab Invest, 80: 1943–1949, 2000
8.Gancberg, D., Di Leo, A., Rouas, G., Jarvinen, T., Verhest, A., Isola, J., Piccart, M. J., and Larsimont, D. Reliability of the tissue microarray based FISH for evaluation of the HER–2 oncogene in breast carcinoma. J Clin Pathol, 55: 315– 317, 2002
19 Tissue Microarrays |
355 |
9.Hoos, A., Urist, M. J., Stojadinovic, A., Mastorides, S., Dudas, M. E., Leung, D. H., Kuo, D., Brennan, M. F., Lewis, J. J., and Cordon-Cardo, C. Validation of tissue microarrays for immunohistochemical profiling of cancer specimens using the example of human fibroblastic tumors. Am J Pathol, 158: 1245–1251, 2001
10.Nocito, A., Bubendorf, L., Maria Tinner, E., Suess, K., Wagner, U., Forster, T., Kononen, J., Fijan, A., Bruderer, J., Schmid, U., Ackermann, D., Maurer, R., Alund, G., Knonagel, H., Rist, M., Anabitarte, M., Hering, F., Hardmeier, T., Schoenenberger, A. J., Flury, R., Jager, P., Luc Fehr, J., Schraml, P., Moch, H., Mihatsch, M. J., Gasser, T., and Sauter, G. Microarrays of bladder cancer tissue are highly representative of proliferation index and histological grade. J Pathol, 194: 349–357, 2001
11.Rimm, D. L., Camp, R. L., Charette, L. A., Costa, J., Olsen, D. A., and Reiss, M. Tissue microarray: a new technology for amplification of tissue resources. Cancer J, 7: 24–31, 2001
12.Engellau, J., Akerman, M., Anderson, H., Domanski, H. A., Rambech, E., Alvegard, T. A., and Nilbert, M. Tissue microarray technique in soft tissue sarcoma: immunohisto–chemical Ki–67 expression in malignant fibrous histiocytoma. Appl Immunohistochem Mol Morphol, 9: 358–363, 2001
13.Fernebro, E., Dictor, M., Bendahl, P. O., Ferno, M., and Nilbert, M. Evaluation of the tissue microarray technique for immunohistochemical analysis in rectal cancer. Arch Pathol Lab Med, 126: 702–705, 2002
14.Garcia, J. F., Camacho, F. I., Morente, M., Fraga, M., Montalban, C., Alavaro, T., Bellas, C., Castano, A., Diez, A., Flores, T., Martin, C., Martinez, M. A., Mazorra, F., Menarguez, J., Mestre, M. J., Mollejo, M., Saez, A. I., Sanchez, L., and Piris, M. A. Hodgkin’s and Reed–Sternberg cells harbor alterations in the major tumor suppressor pathways and cell–cycle checkpoints: analyses using tissue–microarrays. Blood, 12: 12, 2002
15.Ginestier, C., Charafe-Jau ret, E., Bertucci, F., Eisinger, F., Geneix, J., Bechlian, D., Conte, N., Adelaide, J., Toiron, Y., Nguyen, C., Viens, P., Mozziconacci, M. J., Houlgatte, R., Birnbaum, D., and Jacquemier, J. Distinct and complementary information provided by use of tissue and DNA microarrays in the study of breast tumor markers. Am J Pathol, 161: 1223–1233, 2002
16.Gulmann, C., Butler, D., Kay, E., Grace, A., and Leader, M. Biopsy of a biopsy: validation of immunoprofiling in gastric cancer biopsy tissue microarrays. Histopathology, 42: 70–76, 2003
17.Hedvat, C. V., Hegde, A., Chaganti, R. S., Chen, B., Qin, J., Filippa, D. A., Nimer, S. D., and Teruya-Feldstein, J. Application of tissue microarray technology to the study of non-Hodgkin’s and Hodgkin’s lymphoma. Hum Pathol, 33: 968–974, 2002
18.Hendriks, Y., Franken, P., Dierssen, J. W., De Leeuw, W., Wijnen, J., Dreef, E., Tops, C., Breuning, M., Brocker-Vriends, A., Vasen, H., Fodde, R., and Morreau, H. Conventional and tissue microarray immunohistochemical expression analysis of mismatch repair in hereditary colorectal tumors. Am J Pathol, 162: 469–477, 2003
19.Merseburger, A. S., Kuczyk, M. A., Serth, J., Bokemeyer, C., Young, D. Y., Sun, L., Connelly, R. R., McLeod, D. G., Mostofi, F. K., Srivastava, S. K., Stenzl, A., Moul, J. W., and Sesterhenn, I. A. Limitations of tissue microarrays in the evaluation of focal alterations of bcl–2 and p53 in whole mount derived prostate tissues. Oncol Rep, 10: 223–228, 2003
356 Ronald Simon et al.
20.Moch, H., Schraml, P., Bubendorf, L., Mirlacher, M., Kononen, J., Gasser, T., Mihatsch, M. J., Kallioniemi, O. P., and Sauter, G. High–throughput tissue microarray analysis to evaluate genes uncovered by cDNA microarray screening in renal cell carcinoma. Am J Pathol, 154: 981–986, 1999
21.Mucci, N. R., Akdas, G., Manely, S., and Rubin, M. A. Neuroendocrine expression in metastatic prostate cancer: evaluation of high throughput tissue microarrays to detect heterogeneous protein expression. Hum Pathol, 31: 406–414, 2000
22.Natkunam, Y., Warnke, R. A., Montgomery, K., Falini, B., and van De Rijn,
M.Analysis of mum1/irf4 protein expression using tissue microarrays and immunohistochemistry. Mod Pathol, 14: 686–694, 2001
23.Rassidakis, G. Z., Jones, D., Thomaides, A., Sen, F., Lai, R., Cabanillas, F., McDonnell, T. J., and Medeiros, L. J. Apoptotic rate in peripheral T–cell lymphomas. A study using a tissue microarray with validation on full tissue sections. Am J Clin Pathol, 118: 328–334, 2002
24.Rubin, M. A., Dunn, R., Strawderman, M., and Pienta, K. J. Tissue microarray sampling strategy for prostate cancer bio-marker analysis. Am J Surg Pathol, 26: 312–319, 2002
25.Sallinen, S. L., Sallinen, P. K., Haapasalo, H. K., Helin, H. J., Helen, P. T., Schraml, P., Kallioniemi, O. P., and Kononen, J. Identification of di erentially expressed genes in human gliomas by DNA microarray and tissue chip techniques. Cancer Res, 60: 6617–6622, 2000
26.Torhorst, J., Bucher, C., Kononen, J., Haas, P., Zuber, M., Kochli, O. R., Mross, F., Dieterich, H., Moch, H., Mihatsch, M., Kallioniemi, O. P., and Sauter, G.
Tissue microarrays for rapid linking of molecular changes to clinical endpoints. Am J Pathol, 159: 2249–2256, 2001
27.Tzankov, A., Zimpfer, A., Lugli, A., Krugmann, J., Went, P., Schraml, P., Maurer, R., Ascani, S., Pileri, S., Geley, S., and Dirnhofer, S. High–throughput tissue microarray analysis of G1–cyclin alterations in classical Hodgkin’s lymphoma indicates overexpression of cyclin E1. J Pathol, 199: 201–207, 2003
28.Yosepovich, A. and Kopolovic, J. Tissue microarray technology–a new and powerful tool for the molecular profiling of tumors. Harefuah, 141: 1039–1041, 1090, 2002
29.Hoos, A., Stojadinovic, A., Mastorides, S., Urist, M. J., Polsky, D., Di Como,
C.J., Brennan, M. F., and Cordon-Cardo, C. High Ki–67 proliferative index predicts disease specific survival in patients with high–risk soft tissue sarcomas. Cancer, 92: 869–874, 2001
30.Hoos, A., Stojadinovic, A., Singh, B., Dudas, M. E., Leung, D. H., Shaha, A. R., Shah, J. P., Brennan, M. F., Cordon-Cardo, C., and Ghossein, R. Clinical significance of molecular expression profiles of Hurthle cell tumors of the thyroid gland analyzed via tissue microarrays. Am J Pathol, 160: 175–183, 2002
31.Barlund, M., Forozan, F., Kononen, J., Bubendorf, L., Chen, Y., Bittner, M. L., Torhorst, J., Haas, P., Bucher, C., Sauter, G., Kallioniemi, O. P., and Kallioniemi, A. Detecting activation of ribosomal protein S6 kinase by complementary DNA and tissue microarray analysis. J Natl Cancer Inst, 92: 1252–1259, 2000
32.Schraml, P., Kononen, J., Bubendorf, L., Moch, H., Bissig, H., Nocito, A., Mihatsch, M., Kallioniemi, O., and Sauter, G. Tissue microarrays for gene amplification surveys in many di erent tumor types. Clin Cancer Res, 5: 1966–1975, 1999
19 Tissue Microarrays |
357 |
33.Richter, J., Wagner, U., Kononen, J., Fijan, A., Bruderer, J., Schmid, U., Ackermann, D., Maurer, R., Alund, G., Knonagel, H., Rist, M., Wilber, K., Anabitarte, M., Hering, F., Hardmeier, T., Schonenberger, A., Flury, R., Jager, P., Fehr, J. L., Schraml, P., Moch, H., Mihatsch, M. J., Gasser, T., Kallioniemi, O. P., and Sauter, G. High–throughput tissue microarray analysis of cyclin E gene amplification and over–expression in urinary bladder cancer. Am J Pathol, 157: 787–794, 2000
34.Simon, R., Richter, J., Wagner, U., Fijan, A., Bruderer, J., Schmid, U., Ackermann, D., Maurer, R., Alund, G., Knonagel, H., Rist, M., Wilber, K., Anabitarte, M., Hering, F., Hardmeier, T., Schonenberger, A., Flury, R., Jager, P., Fehr, J. L., Schraml, P., Moch, H., Mihatsch, M. J., Gasser, T., and Sauter, G.
High–throughput tissue microarray analysis of 3p25 (RAF1) and 8p12 (FGFR1) copy number alterations in urinary bladder cancer. Cancer Res, 61: 4514–4519, 2001
35.Simon, R., Struckmann, K., Schraml, P., Wagner, U., Forster, T., Moch, H., Fijan, A., Bruderer, J., Wilber, K., Mihatsch, M. J., Gasser, T., and Sauter,
G.Amplification pattern of 12q13–q15 genes (MDM2, CDK4, GLI) in urinary bladder cancer. Oncogene, 21: 2476–2483, 2002
36.Kocher, T., Zheng, M., Bolli, M., Simon, R., Forster, T., Schultz-Thater, E., Remmel, E., Noppen, C., Schmid, U., Ackermann, D., Mihatsch, M. J., Gasser, T., Heberer, M., Sauter, G., and Spagnoli, G. C. Prognostic relevance of MAGE– A4 tumor antigen expression in transitional cell carcinoma of the urinary bladder: a tissue microarray study. Int J Cancer, 100: 702–705, 2002
37.Park, S. Y., Kim, H. S., Hong, E. K., and Kim, W. H. Expression of cytokeratins 7 and 20 in primary carcinomas of the stomach and colorectum and their value in the di erential diagnosis of metastatic carcinomas to the ovary. Hum Pathol, 33: 1078–1085, 2002
38.Bubendorf, L., Kolmer, M., Kononen, J., Koivisto, P., Mousses, S., Chen, Y., Mahlamaki, E., Schraml, P., Moch, H., Willi, N., Elkahloun, A. G., Pretlow, T. G., Gasser, T. C., Mihatsch, M. J., Sauter, G., and Kallioniemi, O. P. Hormone therapy failure in human prostate cancer: analysis by complementary DNA and tissue microarrays. J Natl Cancer Inst, 91: 1758–1764, 1999
39.Saramaki, O., Willi, N., Bratt, O., Gasser, T. C., Koivisto, P., Nupponen, N. N., Bubendorf, L., and Visakorpi, T. Amplification of EIF3S3 gene is associated with advanced stage in prostate cancer. Am J Pathol, 159: 2089–2094, 2001
40.Skacel, M., Ormsby, A. H., Pettay, J. D., Tsiftsakis, E. K., Liou, L. S., Klein,
E.A., Levin, H. S., Zippe, C. D., and Tubbs, R. R. Aneusomy of chromosomes 7, 8, and 17 and amplification of HER–2/neu and epidermal growth factor receptor in Gleason score 7 prostate carcinoma: a di erential fluorescent in situ hybridization study of Gleason pattern 3 and 4 using tissue microarray. Hum Pathol, 32: 1392–1397, 2001
41.Rubin, M. A., Mucci, N. R., Figurski, J., Fecko, A., Pienta, K. J., and Day, M.
L.E–cadherin expression in prostate cancer: a broad survey using high–density tissue microarray technology. Hum Pathol, 32: 690–697, 2001
42.Fuller, C. E., Wang, H., Zhang, W., Fuller, G. N., and Perry, A. High–throughput molecular profiling of high–grade astro–cytomas: the utility of fluorescence in situ hybridization on tissue microarrays (TMA–FISH). J Neuropathol Exp Neurol, 61: 1078–1084, 2002
43.Korsching, E., Packeisen, J., Agelopoulos, K., Eisenacher, M., Voss, R., Isola, J., van Diest, P. J., Brandt, B., Boecker, W., and Buerger, H. Cytogenetic al-
358 Ronald Simon et al.
terations and cytokeratin expression patterns in breast cancer: integrating a new model of breast di erentiation into cytogenetic pathways of breast carcinogenesis. Lab Invest, 82: 1525–1533, 2002
44.Allander, S. V., Illei, P. B., Chen, Y., Antonescu, C. R., Bittner, M., Ladanyi, M., and Meltzer, P. S. Expression profiling of synovial sarcoma by cDNA microarrays: association of ERBB2, IGFBP2, and ELF3 with epithelial di erentiation. Am J Pathol, 161: 1587–1595, 2002
45.Oka, T., Yoshino, T., Hayashi, K., Ohara, N., Nakanishi, T., Yamaai, Y., Hiraki, A., Sogawa, C. A., Kondo, E., Teramoto, N., Takahashi, K., Tsuchiyama, J., and Akagi, T. Reduction of hematopoietic cell–specific tyrosine phosphatase SHP–1 gene expression in natural killer cell lymphoma and various types of lymphomas/leukemias : combination analysis with cDNA expression array and tissue microarray. Am J Pathol, 159: 1495–1505, 2001
46.Monni, O., Barlund, M., Mousses, S., Kononen, J., Sauter, G., Heiskanen, M., Paavola, P., Avela, K., Chen, Y., Bittner, M. L., and Kallioniemi, A. Comprehensive copy number and gene expression profiling of the 17q23 amplicon in human breast cancer. Proc Natl Acad Sci U S A, 98: 5711–5716, 2001
47.Andersen, C. L., Monni, O., Wagner, U., Kononen, J., Barlund, M., Bucher, C., Haas, P., Nocito, A., Bissig, H., Sauter, G., and Kallioniemi, A. High–throughput copy number analysis of 17q23 in 3520 tissue specimens by fluorescence in situ hybridization to tissue microarrays. Am J Pathol, 161: 73–79, 2002
48.Bubendorf, L., Kolmer, M., Kononen, J., Koivisto, P., Mousses, S., Chen1, Y., Mahlam¨aki, E., Schraml, P., Moch, H., Willi, N., Elkahlhoun, A., Pretlow, T., Gasser, T., Mihatsch, M., Sauter, G., and Kallioniemi, O. Molecular mechanisms of hormone therapy failure in human prostate cancer analyzed by a combination of cDNA and tissue microarrays. J Natl Cancer Inst, 91: 1758–1764, 1999
49.Bubendorf, L., Kononen, J., Koivisto, P., Schraml, P., Moch, H., Gasser, T., Willi, N., Mihatsch, M., Sauter, G., and Kallioniemi, O. Survey of gene amplifications during prostate cancer progression by high–throughput fluorescence in situ hybridization on tissue microarrays. Cancer Res, 59: 803–806, 1999
50.Richter, J., Wagner, U., Kononen, J., Fijan, A., Bruderer, J., Schmid, U., Ackermann, D., Maurer, R., Alund, G., Kn¨onagel, H., Rist, M., Wilber, K., Anabitarte, M., Hering, F., Hardmeier, T., Sch¨onenberger, A., Flury, R., Jager, P., Fehr, J. L., Schraml, P., Moch, H., Mihatsch, M. J., Gasser, T., Kallioniemi, O. P., and Sauter, G. High–throughput tissue microarray analysis of cyclin E gene amplification and over–expression in urinary bladder cancer. Am J Pathol, 157: 787–794, 2000
51.Simon, R., Nocito, A., Hubscher, T., Bucher, C., Torhorst, J., Schraml, P., Bubendorf, L., Mihatsch, M. M., Moch, H., Wilber, K., Schotzau, A., Kononen, J., and Sauter, G. Patterns of her–2/neu amplification and overexpression in primary and metastatic breast cancer. J Natl Cancer Inst, 93: 1141–1146, 2001
52.Rao, J., Seligson, D., Visapaa, H., Horvath, S., Eeva, M., Michel, K., Pantuck, A., Belldegrun, A., and Palotie, A. Tissue microarray analysis of cytoskeletal actin–associated bio-markers gelsolin and E–cadherin in urothelial carcinoma. Cancer, 95: 1247–1257, 2002
53.Bucher, C., Torhorst, J., Kononen, J., Haas, P., Askaa, J., Godtfredsen, S. E., Bauer, K. D., Seelig, S., Kallioniemi, O., and Sauter, G. Automated, High– Throughput Tissue Microarray Analysis for Assessing the Significance of HER– 2 In-volvement in Breast Cancer. In: Proceedings of the ASCO annual meeting, Abstr. #2388, New Orleans, LA, 2000
19 Tissue Microarrays |
359 |
54.Poremba, C., Heine, B., Diallo, R., Heinecke, A., Wai, D., Schaefer, K. L., Braun, Y., Schuck, A., Lanvers, C., Bank-falvi, A., Kneif, S., Torhorst, J., Zuber, M., Kochli, O. R., Mross, F., Dieterich, H., Sauter, G., Stein, H., Fogt, F., and Boecker, W. Telomerase as a prognostic marker in breast cancer: high– throughput tissue microarray analysis of hTERT and hTR. J Pathol, 198: 181– 189, 2002
55.Ristimaki, A., Sivula, A., Lundin, J., Lundin, M., Salminen, T., Haglund, C., Joensuu, H., and Isola, J. Prognostic significance of elevated cyclooxygenase–2 expression in breast cancer. Cancer Res, 62: 632–635, 2002
56.Bubendorf, L., Kononen, J., Koivisto, P., Schraml, P., Moch, H., Gasser, T. C., Willi, N., Mihatsch, M. J., Sauter, G., and Kallioniemi, O. P. Survey of gene amplifications during prostate cancer progression by high–throughout fluorescence in situ hybridization on tissue microarrays. Cancer Res, 59: 803–806, 1999
57.Dhanasekaran, S. M., Barrette, T. R., Ghosh, D., Shah, R., Varambally, S., Kurachi, K., Pienta, K. J., Rubin, M. A., and Chinnaiyan, A. M. Delineation of prognostic biomarkers in prostate cancer. Nature, 412: 822–826, 2001
58.Mousses, S., Bubendorf, L., Wagner, U., Hostetter, G., Kononen, J., Cornelison, R., Goldberger, N., Elkahloun, A. G., Willi, N., Koivisto, P., Ferhle, W., Ra eld, M., Sauter, G., and Kallioniemi, O. P. Clinical validation of candidate genes associated with prostate cancer progression in the CWR22 model system using tissue microarrays. Cancer Res, 62: 1256–1260, 2002
59.Miettinen, H. E., Jarvinen, T. A., Kellner, U., Kauraniemi, P., Parwaresch, R., Rantala, I., Kalimo, H., Paljarvi, L., Isola, J., and Haapasalo, H. High topoisomerase IIalpha expression associates with high proliferation rate and and poor prognosis in oligodendrogliomas. Neuropathol Appl Neurobiol, 26: 504–512, 2000
60.Miettinen, H. E., Paunu, N., Rantala, I., Kalimo, H., Paljarvi, L., Helin, H., and Haapasalo, H. Cell cycle regulators (p21, p53, pRb) in oligodendrocytic tumors: a study by novel tumor microarray technique. J Neurooncol, 55: 29–37, 2001
61.Wang, Y., Wu, M. C., Sham, J. S., Zhang, W., Wu, W. Q., and Guan, X. Y. Prognostic significance of c–myc and AIB1 amplification in hepatocellular carcinoma. A broad survey using high–throughput tissue microarray. Cancer, 95: 2346–2352, 2002
62.Chung, G. G., Provost, E., Kielhorn, E. P., Charette, L. A., Smith, B. L., and Rimm, D. L. Tissue microarray analysis of beta–catenin in colorectal cancer shows nuclear phospho–beta–catenin is associated with a better prognosis. Clin Cancer Res, 7: 4013–4020, 2001
63.Hoos, A., Nissan, A., Stojadinovic, A., Shia, J., Hedvat, C. V., Leung, D. H., Paty, P. B., Klimstra, D., Cordon-Cardo, C., and Wong, W. D. Tissue Microarray Molecular Profiling of Early, Node–negative Adenocarcinoma of the Rectum: A Comprehensive Analysis. Clin Cancer Res, 8: 3841–3849, 2002
64.Otsuka, M., Kato, M., Yoshikawa, T., Chen, H., Brown, E. J., Masuho, Y., Omata, M., and Seki, N. Di erential expression of the L–plastin gene in human colorectal cancer progression and metastasis. Biochem Biophys Res Commun, 289: 876–881, 2001
65.Kielhorn, E., Provost, E., Olsen, D., D’Aquila, T. G., Smith, B. L., Camp, R. L., and Rimm, D. L. Tissue microarray–based analysis shows phospho–beta– catenin expression in malignant melanoma is associated with poor outcome. Int J Cancer, 103: 652–656, 2003
66.Hoos, A. and Cordon–Cardo, C. Tissue microarray profiling of cancer specimens and cell lines: opportunities and limitations. Lab Invest, 81: 1331–1338, 2001
360 Ronald Simon et al.
67.Mengel, M., von Wasielewski, R., Wiese, B., Rudiger, T., Muller-Hermelink, H. K., and Kreipe, H. Inter–laboratory and inter–observer reproducibility of immunohistochemical assessment of the Ki–67 labelling index in a large multi– centre trial. J Pathol, 198: 292–299, 2002
68.von Wasielewski, R., Mengel, M., Wiese, B., Rudiger, T., Muller–Hermelink, H. K., and Kreipe, H. Tissue array technology for testing interlaboratory and interobserver reproducibility of immunohistochemical estrogen receptor analysis in a large multicenter trial. Am J Clin Pathol, 118: 675–682, 2002
69.Packeisen, J., Buerger, H., Krech, R., and Boecker, W. Tissue microarrays: a new approach for quality control in immunohistochemistry. J Clin Pathol, 55: 613–615, 2002
70.Manley, S., Mucci, N. R., De Marzo, A. M., and Rubin, M. A. Relational database structure to manage high–density tissue microarray data and images for pathology studies focusing on clinical outcome: the prostate specialized program of research excellence model. Am J Pathol, 159: 837–843, 2001