


9
Marker-free Detection on Microarrays
Matthias Vaupel, Andreas Eing, Karl-Otto Greulich, Jan Roegener, Peter Schellenberg, Hans Martin. Striebel, and Heinrich F. Arlinghaus
9.1 Introduction
The binding of oligomers or DNA are usually detected by fluorescence. To this end at least one binding partner is labelled with a fluorescence marker. This detection method cannot be used for protein reactions since biological and chemical properties of proteins are often changed by a bound marker. Marker-free observation of a protein reaction is favorable. We discuss imaging ellipsometry, as well as imaging surface plasmon resonance (SPR) and compare the results of both methods with scanning probe microscopy (SPM) and detection using fluorescence markers.
Intrinsic ultraviolet (UV) fluorescence is presented as an alternative method to classical two dimensional gel electrophoresis.
Time–of–flight secondary ion mass spectrometry (TOF–SIMS) is investigated in comparison to ultraviolet matrix-assisted laser desorption / ionization mass spectrometry (MALDI–MS) for read-out of peptide nucleic acid (PNA) microarray chips. All presented marker-free detection methods are intended for the development of a marker-free microarray reader for cancer detecting protein biochips [1].
9.2 Imaging Ellipsometry
and Imaging Surface Plasmon Resonance on Biochips
9.2.1 Imaging Null Ellipsometry
Ellipsometry is a non-destructive, label-free optical method for determining thickness and optical properties of thin films [2]. It measures the change in polarization of the light reflected by the surface of the film. Fast ellipsometry methods, single or multi-wavelength, have been adopted for monitoring film growth in situ, allowing the precise control of film deposition processes [3]. Commercial imaging ellipsometers, e.g. I–Elli2000 and EP3 from Nanofilm
182 M.Vaupel et al.
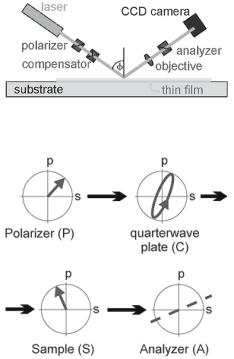
Technologie operate on the principle of null ellipsometry (Fig. 9.1b). The laser beam is elliptically polarized after passing through a linear polarizer (P) and a quarter-wave plate (Compensator, C). The elliptically polarized light is then reflected o the sample (S) through a second polarizer (analyzer, A) and imaged by a CCD camera through a long working distance objective. In this configuration (PCSA), the angles of P and C with respect to the plane of incidence are chosen in such a way that the elliptically polarized light is completely linearly polarized after it is reflected o the sample. The null or minimum of intensity is detected when A is perpendicular with respect to the polarization axis of the reflected light. The angles of P, C and A at the null of intensity determine the ellipsometric parameters Delta and Psi. The tangent of the angle Psi is the ratio of the reflection coe cients of both polarization components (p and s, perpendicular and parallel to the plane of incidence), while Delta is the relative phase shift of these polarization components upon
(a)
(b)
Fig. 9.1. Set-up of the imaging ellipsometers I–Elli2000 and EP3 from Nanofilm Technologie (a) and the propagation of the polarization through a null ellipsometer
(b)
9 Marker-free Detection on Microarrays |
183 |
reflection. Reduction of the measured Delta and Psi with computerized optical modelling leads to a deduction of the optical properties of the sample (complex refractive indices) and the film thickness.
Imaging ellipsometry (Fig. 9.1) combines ellipsometry with microscopy. Spots on the sample, which have di erent optical properties, e.g. film thickness, have di erent reflection coe cients and thus di erent angles of P, C, and A of null intensity. The ellipsometric image of the sample shows null intensity only in spots with the same optical properties. Other spots appear brighter. The contrast in an image is typically such that a 10 pm high step on the sample is observable. The lateral resolution of an image is typically 1 m, which is given by the numerical aperture of the objective.
9.2.2 Imaging Surface Plasmon Resonance
Conventional surface plasmon resonance (SPR) technology is a very sensitive method to measure the adsorption kinetics of ligands on immobilized substances. It can be used to detect the binding of antibodies to their antigens or the binding of proteins to their reaction partners. In an SPR–cell, e.g. from Nanofilm Technologie, a polarized beam propagates in glass and is reflected from a thin gold film (Fig. 9.2) whose reflection coe cient is highly sensitive on the optical properties of a thin reaction layer on the gold. The reflection coe cient of p–polarization has a minimum at the resonance angle of the SPR. The resonance angle is shifted proportional to the mass of a substance adsorbing on the surface [4].
An ellipsometer measures the ellipsometric parameters Psi and Delta instead of just the reflection coe cient of p–polarization as it is done in classical SPR–devices, e.g. from Biacore. The tangent of Psi is proportional to the re-
Fig. 9.2. Sketch of an SPR–cell with the incoming and outgoing light beam and the angle of incidence φ
184 M.Vaupel et al.
flection coe cient of p–polarization. Thus the parameter Psi is analogous to the reflected intensity in classical SPR whereas the phase shift Delta provides additional information exceeding classical SPR.
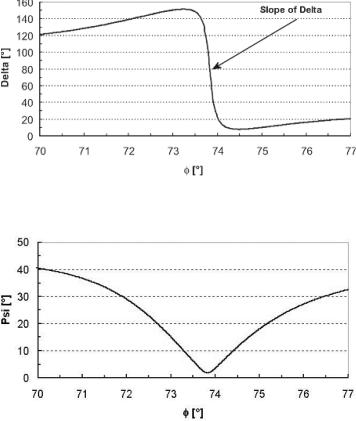
Sensitivity regarding thickness or mass, respectively, is proportional to the derivative (slope) of the measured parameter. At the resonance angle of SPR the slope of Psi (δ Psi / δφ) is limited, where the slope of Delta (δ Delta / δφ) is unlimited (Fig. 9.3). Thus a measurement of Delta can be much more sensitive than a measurement of Psi or classical SPR. The sensitivity of the classical SPR approach (δ Psi / δφ) on the other hand is solely determined by the physico–chemical properties of the layer system and cannot be increased.
9.2.3 Quality Control on Micro Arrays
All spots of immobilized biological macromolecules on a biochip should have a homogeneous shape and the same size and a defined mass. If these requirements are fulfilled, the amount of material that can hybridize is quantified correctly and the results are reliable. Ideally, one displays the quality of the spots before a hybridization process to avoid the loss of expensive probes on less than optimal biochips. Many techniques for quality control either need very time consuming staining processes or destroy the biochips. With imaging ellipsometry one can check the shape and the size of all spots without staining or before the hybridization takes place, and evaluate the results afterwards. As an example, a non-hybridized oligonucleotide spot is displayed in Fig. 9.4.
In another example we have observed non-specific binding of DNA with the imaging ellipsometer. Ellipsometric thickness maps and scanning probe microscopic (e.g. AFM, SFM, STM) maps have usually comparable thickness resolution. Ellipsometric thickness maps have two advantages: much larger field of view (up to some cm) and much faster recording time (30 sec). But only scanning microscopes o er lateral resolution below the wavelength of light.
Thickness and Mass Quantification
A monolayer of bovine serum albumin with a molecular weight of 67 kDa typically has a surface capacity of 3 ng/mm2 and a thickness between 2 to 3 nm depending on the surface density (18000–27000 molecules/µm2) [3]. Thus approximately 1 nm thickness is measured with an ellipsometer at 1 ng/mm2 surface density. Typical detection limits representing the smallest detectable relative thickness change are 40 pm (Organic on Glass), 10 pm (Organic on Gold or on Silicon), < 0.03 pm (!)(Organic on Gold–SPR–sensor measured with ellipsometry, Fig. 9.5). An electro–optic tunable Gold–SPR–sensor array is under development [1] in order to further decrease the detection limit towards the range of 1 fm or 1 fg/mm2 which is the sensitivity of fluorescence readers. This sensitivity enables single molecule detection.
9 Marker-free Detection on Microarrays |
185 |
(a)
(b)
Fig. 9.3. The slope of Psi corresponds to the slope of the reflection coe cient of p– polarization in classical SPR. The slope of Delta becomes infinite if the minimum of Psi approaches zero. This is the case if the wavelength and the gold–layer thickness are suitable
The surface capacity of immobilized oligonucleotides (fragments of single stranded DNA) is in the range of 70 000 molecules/ m2 [5–7]. Thus, depending on the strand length, the thickness of such a layer is 0.8 nm (20–mer oligo), 1.9 nm (50–mer oligo) and 5.8 nm (150–mer oligo). Assuming a hybridization yield of 33% [6] the medium thickness increase due to the binding of the complementary oligonucleotides is 0.3 nm (20–mer oligo), 0.6 nm (50–mer oligo) and 1.9 nm (150–mer oligo).
186 M.Vaupel et al.
Fig. 9.4. Images of a spot of immobilized non-hybridized 50–mer oligonucleotides produced by Advalytix AG (Brunnthal, Germany). The spot diameter is 150 m.
(a) Ellipsometric contrast, (b) thickness–map [z in nm and x/y in pixel] and (c) the corresponding 3D–profile
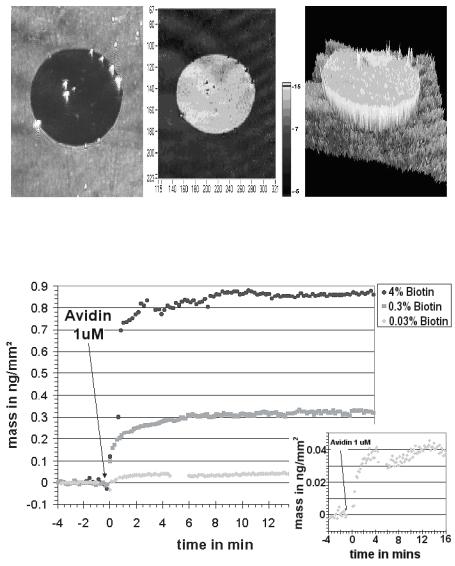
Fig. 9.5. Reaction kinetics of avidin binding on biotin spots with di erent concentrations, sample kindly provided by Gra nity, Heidelberg, Germany
9 Marker-free Detection on Microarrays |
187 |
Protein Spots and the Influence of the Spotting Procedure on the Spot–Shape
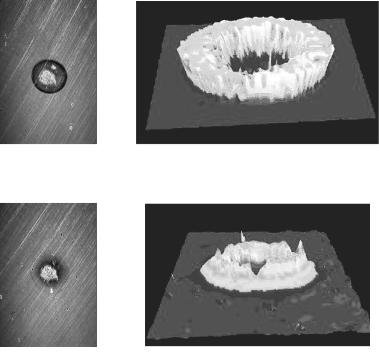
Figure 9.6 represents an example of protein spots with the typical ‘donut shape’ which results from the applied spotting or printing–technique. This kind of non-perfect spotting is still a problem. The influence of additives in the spotting solution on the shape or the homogeneity of the resulting protein spot can be evaluated and give versatile information about the optimal spotting conditions right after the spotting process (Fig. 9.6). Time consuming and expensive steps to visualize the spots, e.g. binding of fluorescent substances, are not required.
The imaging ellipsometer can characterize the homogeneity of the surface– layer, e.g. a streptavidin–layer (Fig. 9.7), which is rather non-homogeneous in comparison with the dextran layer in Fig. 9.6. Homogeneity is a quality
(a) |
(b) |
(c) |
(d) |
Fig. 9.6. Images of protein–spots on gold (diameter 200 m) without (a, b) and with an additive in the spotting solution (c, d). (Ellipsometric contrast images (a and c) and the corresponding 3D–profile of the thickness (b and d))
188 M.Vaupel et al.
Fig. 9.7. Ellipsometric contrast image of a protein spot (diameter 200 m) on a streptavidin–surface
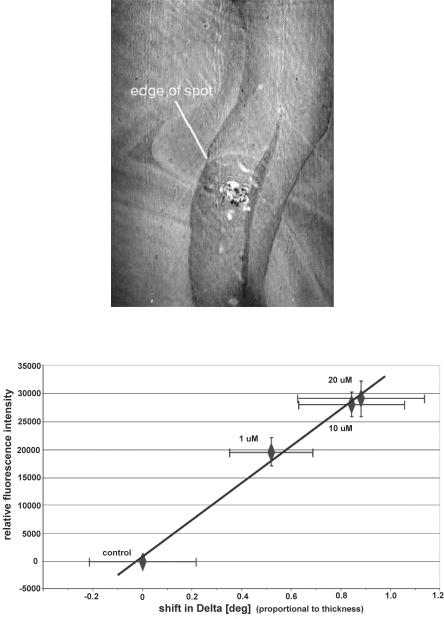
Fig. 9.8. Linear regression of the ellipsometric parameter Delta with the relative fluorescence intensity of hybridized DNA spots. The DNA for the hybridization has been labelled with Cy 5. The measurement of the control spot is defined as the reference in both techniques. Error bars represent standard deviation of a minimum of 15 spots. The standard deviation of the linear regression is much smaller. (Samples and data kindly supplied by PicoRapid Technologie GmbH, Bremen, Germany)
9 Marker-free Detection on Microarrays |
189 |
criterion of the surface because it determines the amount of the substance that can bind to the surface.
Comparison of Hybridized DNA Spots Visualized with Fluorescence and Imaging Ellipsometry
In the conventional evaluation of microarrays the fluorescence signal of a control spot is compared to test spots where hybridization takes place. At the control, no hybridization occurs because the oligonucleotides are not complementary. For simplicity, we assume that the fluorescence intensity is proportional to the amount that binds to the spot.
To determine whether ellipsometry is comparable to fluorescence, identical DNA spots have been evaluated with both methods. With the ellipsometer, the parameter Delta yields the signal. The di erence in Delta between the control spot and the diverse hybridized test–spots is displayed versus the relative fluorescence intensity of the identical spots (Fig. 9.8). It is observed that the shift in Delta is proportional to the relative fluorescence intensity.
The proportionality between the fluorescence signal and the ellipsometric parameter demonstrates that both methods yield equivalent results, but the fluorescence signal cannot be transferred into the amount of bound material directly. In contrast, the layer thickness can be calculated from the ellipsometric parameter Delta. The layer thickness is related to the mass of adsorbed material, which can be transferred into molecules per area.
In Situ Reaction Kinetics
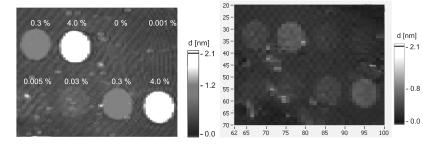
Imaging ellipsometry can display simultaneously all reaction channels fitting in the field of view. An array with 2500 spots (100 m diameter) on a 1 cm2 field of view could be observed with the large area EP3EP3 from Nanofilm Technologie. With this imaging ellipsometer, 8 spots with di erent biotin concentrations (Fig. 9.9) on a gold–SPR–sensor before and after binding of avidin were recorded. To this end the beam at 594 nm from the ellipsometer was coupled through a prism into the glass slide (refractive index n = 1.7) (Fig. 9.9), which was coated with a 35 nm thick gold film and spotted with biotin. Wavelength and refractive index of glass were chosen in order to minimize Psi at the resonance angle of the SPR and to optimize the sensitivity. The recording of the phase shift Delta of spots with di erent biotin concentrations as a function of time is shown in Fig. 9.5. While 4% biotin concentration yields 900 pg/mm2 (almost half of a monolayer), the smallest concentration of 0.03% yields (40 ± 3) pg/mm2. The 3 pg/mm2 noise is caused by chemical fluctuations on the sensor surface and refractive index fluctuations in the solution, where the repeatability (relative error bar) of such an imaging ellipsometer is up to 100 times more precise.
190 M.Vaupel et al.
9.3 Intrinsic UV Fluorescence for Chip Analysis of Rare Proteins
9.3.1 Introduction
Disease phenotypes are governed mainly by proteins, but less directly by DNA. Therefore protein chip analysis promises to be more e cient. Usually, protein chips carry commercially available antibodies, enzymes or regulatory proteins. At most a few thousand human proteins are readily available, but 30,000– 40,000 di erent proteins can be expected from the human genome sequence. The majority of human proteins have still to be produced, for example by gene technology. They will often be available only in small quantity. In order to use such proteins on protein chips, methods for low-amount– but high- yield–preparation are required. Chemical modification such as fluorescence labelling is, in that sense, counterproductive and should thus be avoided. Imaging ellipsometry, surface plasmon resonance and mass spectrometry are suitable label free methods. This trio of techniques is complemented by the use of intrinsic protein UV fluorescence originating from the aromatic amino acids tryptophan and tyrosine. Fluorescence detection is one of the most sensitive techniques to probe molecules, with detection limits often down to the single molecule level. It is therefore straightforward to use intrinsic fluorescence methods to test ligand binding to protein chips. Of 1,026,890 proteins with molecular masses larger than 10 kD found in the data base NCBlnr 9.23, more than 99% contain at least one tryptophan or tyrosine and hence are detectable by UV fluorescence.
Fig. 9.9. Biotin spots (0.6 mm diameter) with di erent biotin concentrations on gold–SPR–sensor before and after binding of avidin (1 M solution in HEPES– bu er pH 7.4), Thickness maps recorded with large area I–Elli2000 from Nanofilm Technologie, sample kindly provided by Gra nity, Heidelberg, Germany
9 Marker-free Detection on Microarrays |
191 |
9.3.2 Materials and Methods
UV Protein Fluorescence to Detect Proteins and Protein – Ligand Binding
Detecting UV fluorescence on protein microarrays is a new approach. In contrast to DNA, proteins excited in the UV at 280–290 nm reveal considerable intrinsic fluorescence. Particularly tyrosine (molar absorption coe cient= 1200 Mol−1 cm−1, fluorescence yield Φ = 0.065) and tryptophan ( = 5600 Mol−1 cm−1, Φ = 0.16 - 0.21) contribute to the total intrinsic fluorescence. Although extrinsic fluorescence dyes with 50 000–100 000 Mol−1 cm−1 and yields up to 0.8 are better suited in this respect, intrinsic fluorescence is sufficiently strong for analysis [8]. A first step in utilizing intrinsic protein fluorescence in chip technology is the mere detection of protein spots by steady state illumination. More informative will be the detection of protein–protein binding, since this allows the finding of potential partners of a protein in a signalling cascade, which may be upset in a disease process. In some favorable circumstances, protein–protein binding may be detected by spectral shifts. For example, when tryptophan, originally exposed to solvent, becomes buried in the interior of a newly formed protein pair, its fluorescence maximum shifts from 355 nm to 330 nm [9, 10].
More generally applicable are fluorescence lifetimes, which are sensitive to interactions between the probe molecules on the chip substrate and target proteins. In a trivial case, distinct lifetimes of the two proteins may just be averaged upon binding. More sophisticated is the Foerster mechanism that alters lifetimes by energy transfer to neighboring amino acids or to other chromophores. The energy transfer rate is reduced due to the proximity of acceptors upon binding to other proteins, or is adjusted due to changes of the protein folding structure. Furthermore, changes in the dynamics of the protein solvent cage as a result of folding can also lead to an alteration in the internal conversion rate, which modifies fluorescence lifetime. Note that these mechanisms also modulate fluorescence quantum yield and therefore fluorescence intensity. However, one has to work with very well defined quantities to detect these changes, which is di cult to achieve. On the other hand, fluorescence lifetime is a very robust parameter, not influenced by concentration. There are still di culties to overcome when utilizing fluorescence decay time measurements to probe binding to a chip. Typically, several tyrosines and tryptophans are present in a protein, each with its specific fluorescence lifetime or even an inhomogeneous distribution of lifetimes [11, 12]. Similarly, not all amino acids are influenced equally by modifications of the protein environment. Due to this e ect the change in lifetime may be small and has to be measured with high accuracy.
In the present work the frequency tripled output from a self mode-locked Ti:Sa laser was used for excitation. The time resolved fluorescence was detected by time correlated single photon counting (TCSPC) with a time resolution of 50 ps. Alternatively, a streak camera may be used, thereby improving
192 M.Vaupel et al.
time resolution to about 2 ps and reducing measuring times. The background fluorescence from the substrate has to be low and/or with very di erent decay time constants compared to the spot. With either set–up, one spot location on the chip is probed at a time, and the chip has to be moved after each measurement to a new spot position, which is rather time consuming. Alternatively, the whole chip may be probed at once with a set–up including a gated UVsensitive CCD–detector with gating windows of about 200 ps. Although this is the method of choice for automated processes, it has worse time resolution and requires a rather large change of the fluorescence lifetime of the system.
Attaching Proteins to a Surface: Finding the Right Turn
Unlike DNA molecules with their comparatively uniform structures and outlined sets of established methods for their successful surface immobilization, proteins require much more custom tailored surface immobilization techniques, simply because of their highly distinct properties.
In order to retain native shape and functionality of immobilized proteins, surface chemistry has become an important aspect of protein array development. In this regard, glass plays a central role as a basic support, and as a starting point for subsequent chemical derivatization. In order to combine glass supports and proven protein immobilization chemistries, coating these supports with suitable materials is a practical option [13]. Depending on the intended detection physics, di erent coating materials may be applied [14]. Artificial polymers have the advantage of being made up from a chemical matrix that may be modified to some extent in order to adapt to special protein immobilization needs. The artificial polymer used most often as a coating material is polyacrylamide. Other artificial polymer coating materials are based on derivatives of polymethacrylate.
Natural polymers, like agarose or cellulose, combine a number of properties that provide an advantageous environment for immobilized proteins in their native states. On the one hand, both materials may be dissolved in appropriate solvents (agarose in hot water, cellulose in dimethylsulfoxide), and spread over glass supports to yield thin, non-fluorescing layers once the solvent has evaporated. These layers are able to retain water in considerable amounts, which makes them ideally suited to enclose proteins in an environment preserving native protein structures. On the other hand, agarose and cellulose are chemically versatile materials. Particularly agarose can be converted into matrices containing high densities of aldehyde functions by careful oxidation with sodium periodate [15]. Matrices carrying high densities of aldehyde functions may then be used to immobilize polymer layers on aminated glass slides, as well as to immobilize proteins via the amino groups on the surface of the protein. Therefore, sandwich-like structures may be generated, featuring glass slides as a basic support, which is covered by a biopolymer layer that in turn has proteins immobilized on its surface.
9 Marker-free Detection on Microarrays |
193 |
Native Protein Binding Techniques
Depending on their surface characteristics, binding proteins on surfaces may occur in three ways: covalently, electrostatically, and by a nity. These mechanisms have been discussed in detail in Chaps. 2 and 3. Binding by a nity interactions requires ligands with high specificity towards the protein to be immobilized. This may be accomplished best with antibodies and their respective antigens, or special protein–ligand pairs like biotin and avidin [16]. In many cases, the anchoring ligands are proteins themselves, transferring the need of protein immobilization to just another protein species.
Dependent on the chemical structures of protein surfaces, there are a few basic methods for covalent protein binding [17]. As the majority of proteins are water soluble, they feature patterns of acidic or basic amino acid side chains on their surfaces which provide points of attack for immobilization reagents. Acid side chains, usually provided by amino acids like glutamic or aspartic acid, may be coupled to primary amino functions via EDC [1–ethyl–3– (–3–dimetylaminopropyl)carbodiimide]. Amine side chains provided by amino acids like arginine, asparagine, or glutamine may be coupled to aldehyde– function bearing substrates directly by amine–aldehyde chemistry.
Proteins exposing free thiol functions, generated for example by reducing antibodies with DTT (dithiothreitol), may be immobilized either on gold surfaces, or other thiol binding functions.
9.3.3 Results
In order to provide substrates suitable for the study of protein–protein interaction on their surfaces by UV-based detection methods, supports of protein arrays need to reveal low fluorescence background. Plastic supports are therefore not recommendable since even UV transparent materials still reveal some fluorescence when excited at 280 nm. Glass or, even better, fused silica supports are suited best. Surfaces should provide an environment for protein immobilization that is optimally suited to binding proteins in their native states. This requirement may be accomplished by coating glass supports with layers of natural polymers.
For study of protein–protein interactions, two binding processes have to be considered: first, immobilization of a probe protein on the support, and second, subsequent docking of a suspected ligand protein to the probe protein without non-specific binding to the areas not covered by immobilized probe proteins. Blocking of areas not covered by protein spots may be a solution, performed by saturation of active binding sites with neutral proteins like BSA, but this very likely interferes with the UV–detection process for protein–protein interaction. Non-fluorescing blocking agents are desirable for this purpose.
Another possibility may be the design of immobilization chemistries that selectively bind probe proteins but not sample proteins.
194 M.Vaupel et al.
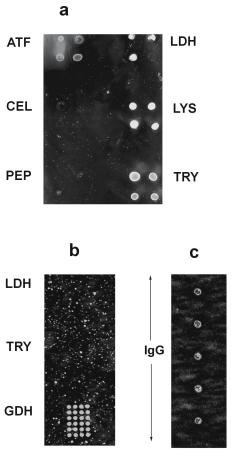
Fig. 9.10. ATF = aminotransferase; CEL = cellulase; GDH = glutamatedehydrogenase; IgG = Immunoglobuline G; LDH = lactatedehydrogenase; LYS = lysozyme; PEP = pepsin; TRY = trypsin. (a) Surface made up from oxidized agarose; proteins are bound to aldehyde functions via aldehyde–amine chemistry; surplus aldehyde functions at areas not covered by immobilized probe proteins were then saturated by small amine reactants, in this case tris bu er. Spot diameters are 1000 m, spot detection occurred at 493 nm (excitation), and 517 nm (emission) after staining with FLUOS. (b) Cation exchange surface, generated by reacting a coating of oxidized agarose with glycine. Proteins are bound by electrostatic interaction. (c) Array of immobilized IgG; proteins are bound to amino functions on a commercially available support (SCIENION AG, Berlin). Spot diameters of (b) and (c) are 300 m; detection at (b) and (c) occurred at 280 nm (excitation), and 300–375 nm (emission)
9 Marker-free Detection on Microarrays |
195 |
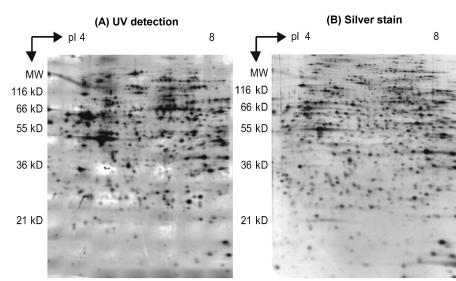
Fig. 9.11. Two–dimensional polyacrylamide gel electrophoresis (2D–PAGE). Spot pattern of EA.hy 926 epithelial cells whole cell lysate. Size 6 × 7 cm2. (A) UV detection, inverse contrast representation. Exposure was 35 mJ/cm2. (B) Silver stain on identically prepared gel (Reprinted with permission from [18]. Copyright 2003 Academic Press Inc Elsevier Science)
In order to detect a change in fluorescence lifetime by the mechanisms discussed above, there may be several possibilities for the realization of a working chip for protein analysis. Figure 9.10 shows three di erently designed supports for protein immobilization, intended to selectively bind certain protein species, whereas others are not bound. Comparison shows that LDH and trypsin are bound solely on surface 9.10a, but not on 9.10b.
An interesting side aspect is that UV fluorescence can also be used in 2D gels, an alternative proteomic technique. Fig. 9.11 shows that detecting intrinsic protein fluorescence in 2D gels has a sensitivity comparable to silver staining or staining with fluorescent dyes in the visible range.
This was unexpected, since the brightness of intrinsic fluorescence is only a fraction compared to that of fluorescent dyes. This possibly provides an alternative to previous staining methods, where selective staining of proteins without producing background signals is a problem.
An additional strategy that may be applied to separate fluorescence signals of bound proteins from those of their ligands is electrophoresis on spots prior to fluorescence detection. This may be performed by covering the chip with a polyacrylamide gel, breaking antigen–antibody binding by low pH or increased temperature, and then moving the proteins by electrophoresis to the side. Previously bound antigens are now in some distance to the spot and can be
196 M.Vaupel et al.
detected there without fluorescence background from antibodies. This may give additional information about antigen binding and mobility.
Fluorescence lifetime measurements were performed by utilizing the frequency tripled output of a Ti:Sa laser tuned to 280 nm. The system consists of a Spectra Physics Tsunami Laser, a pulse picker to increase the pulse to pulse spacing to 250 ns, and a third harmonic generator from GWU. A TCSPC device (SPC–300, Edinburgh Instruments) was used for signal scanning.
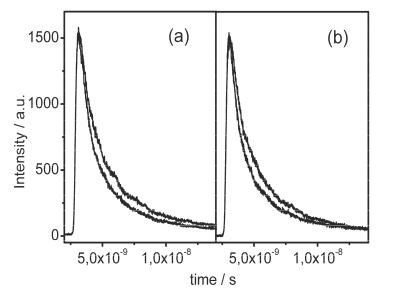
We tested binding of the protein kinesin to microtubules, a process important for cellular motion. Kinesin performs vesicle transport along microtubules and is involved in a number of physiological processes and diseases [19]. Figure 9.12a shows fluorescence decay curves of surface-attached microtubules as probe with and without binding of kinesin as target. Figure 9.12b shows the reverse case with kinesin as immobilized probe and microtubules as target. The fluorescence decay rate of microtubules is slower than that of kinesin. Influences of binding partners to fluorescence decay times on the array are clearly visible.
Fig. 9.12. (a) Fluorescence decay curve for microtubules immobilized on the chip surface (slow decay), and after binding of kinesin to the microtubules (fast decay). The decay rate is faster upon binding of kinesin, since the isolated kinesin has a shorter fluorescence lifetime, which causes the observed faster overall decay. (b) Decay curve for the immobilized kinesin (fast decay), and after binding of microtubules to the kinesin probe (slow decay)
9 Marker-free Detection on Microarrays |
197 |
9.3.4 Discussion
The fabrication of protein microarrays is challenging, because due to the generally high variations between proteins and their binding needs, every single protein has to be checked for its own optimal immobilization conditions. This will be a time and resource consuming task, particularly if protein arrays with many proteins in their native states are under consideration.
Additional di culties have to be overcome if non-modifying protein detection methods are to be applied. A new non-modifying detection method is intrinsic UV–detection.
Apparently this saves material and costs. Furthermore, omitting of staining speeds up the whole procedure, an important aspect with regard to pharmaceutical screening purposes. Also, working with unaltered proteins reduces errors caused by the staining process. This includes malfunctions due to dyes and tags or false quantification due to variations in staining yield. Detection of intrinsic fluorescence is faster and cheaper than mass spectrometry. Sample handling and reproducibility is comparative to standard fluorescence detection procedures. Its great advantages derive from economic material use, short analysis times, and handling of samples in native, non-modified states.
9.4 Genetic Diagnostics with Unlabelled DNA
In recent years, nucleic acid chip technology has been a subject of growing interest for clinical diagnostics as well as for sequencing DNA and cDNAs, for partial sequencing of clones, for single nucleotide polymorphism (SNPs) studies, and for identification of expressed genes. Nucleic acid chips are based on the method of sequencing by hybridization, where unknown DNA fragments are hybridized to complementary nucleic acid sequences, which are immobilized on a solid surface in an array format. The main variables in this process are the attachment of the nucleic acid sequences to a solid surface, the conditions for hybridization, and the detection of the hybridized DNA sequences.
Currently, various techniques are used to detect hybridized DNAs/RNAs, many described in other chapters of this book. Most of them use PCR for amplification, and labelling procedures such as fluorescent, colorimetric or radioactive tags for detection. Also, a number of approaches have been made using stable isotope as tags [20,21]. Indirect methods such as ultraviolet matrixassisted laser desorption / ionization mass spectrometry (MALDI–MS) [22–26] limit the size of the DNA samples examined to around 50 to 80 bases.
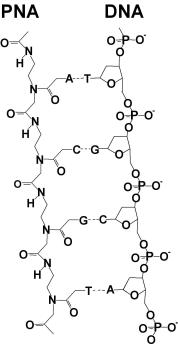
These disadvantages can be avoided by using peptide nucleic acid (PNA) microarray chips [27–36]. With this microarray chip, label-free and PCR-free DNA diagnostics should become possible [3, 37–42]. PNA is a synthesized DNA analog in which both the phosphate and the deoxyribose of the DNA backbone are replaced by polypeptides (see Fig. 9.13). These DNA analogs possess the ability to hybridize with complementary DNA or RNA sequences.
198 M.Vaupel et al.
Thus, PNA–chips can be used in the same way as DNA chips. Two major advantages of PNA over DNA are the neutral backbone and the increased strength of the PNA/DNA pairing. The lack of charge repulsion also improves the hybridization properties of DNA/PNA duplexes as compared to DNA/DNA duplexes; the increased binding strength usually leads to a higher sequence discrimination for PNA–DNA hybrids compared to DNA–DNA hybrids, which is particularly important for SNP studies [43–48]. In contrast to the DNA backbone, which contains phosphates, the PNA backbone is free of phosphates; therefore, a technique that identifies the presence of these phosphates in a molecular surface layer would allow the use of even unmodified genomic DNA for hybridization on a microarray chip, rather than using amplified DNA fragments labelled with radioisotopes, stable isotopes, or fluorescent probes.
The detection of unlabelled DNA fragments hybridized to complementary PNAs via the detection of negative phosphate ions (PO−2 and PO−3 ) or phosphate sugar compound fragments can be achieved in a very e cient way with time–of–flight secondary ion mass spectrometry (TOF–SIMS). In comparison to MALDI–MS, where a laser is used to desorb molecules [49,50], TOF–SIMS analysis utilizes a technique in which the sample is bombarded with a fo-
Fig. 9.13. Structure of deoxyribonucleic acid (DNA) and peptide nucleic acid (PNA)
9 Marker-free Detection on Microarrays |
199 |
cused, energetic ion beam that sputters atoms, clusters or large molecules (up to 10,000 amu) o the surface [51–54]. Most of these originate from the top monolayer. The ionized sputtered secondary particles can be directly detected with a time–of–flight mass spectrometer (TOF–MS).
Two types of ion source are particularly suited for TOF–SIMS. The first one produces positive noble gas ions (usually argon or xenon) either by electron impact (EI) or in a plasma created by a discharge. The ions are then extracted from the source region, accelerated to the chosen energy and focused in an electrostatic ion optical column. More recently it has been shown that the use of primary polyatomic ions such as SF+5 , created in EI sources, could enhance the molecular secondary ion yield by several magnitudes [38, 55].
The second type of ion gun produces positive ions from a liquid metal (gallium, indium or gold) [56]. Because the ion production occurs in a very small volume, gallium liquid metal ion sources have a very high brightness. As a result, the ion beam may be focused to a fine spot, resulting in a spot size of 0.2 m at 8–10 keV or about 20 nm at 30 keV, while being pulsed at frequencies of up to 50 kHz and rastered at the same time.
All ion gun optical columns provide deflection plates for scanning the ion beam over areas adjustable from many square millimeters to a few square micrometers. They have been adapted for pulsing by the introduction of deflection plates, which rapidly sweep the beam across an aperture. Applying an ion beam bunching technique, ion pulses of less than 1 ns width can be produced.
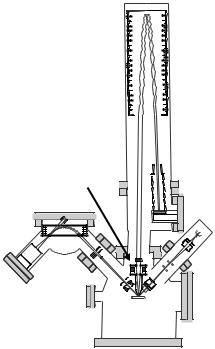
In a TOF mass analyzer (Fig. 9.14), all sputtered ions are accelerated with an extraction voltage of U0 to a given potential, so that all ions possess the same kinetic energy. The ions are then allowed to drift through a fieldfree drift path of a given length L before striking the detector. According to the equation (mL2)/(2t2) = qU0, light ions travel the fixed distance through the flight tube more rapidly than identically charged heavy ions. Thus, the measurement of the time, t, of ions with mass–to–charge ratio, m/q, provides a simple means of mass analysis with t2 = (mL2)/(2qU0) m/q. Because a very well defined start time is required for the flight time measurement, the primary ion gun has to be operated in a pulsed mode in order to be able to deliver discrete primary–ion packages [57]. Electric fields (e.g., ion mirrors [58, 59] or electrical sectors [60, 61]) are used in the drift path in order to compensate for di erent incident energies and angular distributions of the secondary ions. For good mass resolution, the flight path must be su ciently long (1–1.5 m), and very sophisticated high frequency pulsing and counting systems must be employed to time the flight of the ion to within a sub–nanosecond. One great advantage of TOF–MS is its ability to provide simultaneous detection of all masses of the same polarity. Charge compensation for insulator analysis is possible using pulsed low-energy electrons, which are introduced during the time interval between ion pulses. With such a TOF–SIMS instrument, the useful mass range is extended beyond 10,000 amu; the mass resolution,
200 M.Vaupel et al.
m/∆m, is ≈ 10, 000 with simultaneous detection of all masses; and within each image, all masses can be detected.
In our development of PNA microarrays, thiols such as alkanethiols or dithiobissuccinimidyl propionate (DTSP) [37, 41, 51] have proven to be the molecules of choice in the formation of self-assembled monolayers (SAMs) [62], which are the basis for PNA immobilization. This has been confirmed during our study of SAMs with TOF–SIMS, as they are simple to handle and can easily be detected on goldor silver-coated glass slides or Si–wafers.
We investigated di erent methods in the construction of these PNA microarrays. One method used to immobilize PNA on a gold surface is to build up a thiol–SAM, where the thiol contains a functional end–group. This functional end–group can be a carboxylic acid or an amino group. Next, the PNA is attached to this SAM by using a coupling reagent, which can either link an –NH2 group to a –COOH group [63, 64] or two –NH2 groups together. Examples of such coupling reagents are EDC (1–ethyl–3–(3–dimethylaminopropyl)– carbodiimide hydrochloride) and DSC (disuccinimidyl carbonate). The second method uses PNA synthesized with a thiol linker, which can be readily immobilized or spotted onto a gold surface. In a second step, the surface is covered
5
4
6
2
1
3
Fig. 9.14. Conceptional diagram of a TOF–SIMS instrument; (1) electron impact ion gun (Ar+ or Xe+); (2) liquid metal ion gun (Ga+); (3) sample holder; (4) secondary ion optics; (5) reflectron; (6) detector
9 Marker-free Detection on Microarrays |
201 |
with a layer of other thiol molecules, preferably with a shorter chain length than the linker molecule of the synthesized PNA. These thiols that are used for saturating the surface contain a negatively charged end–group (e.g. a carboxylic acid) in order to prevent DNA, which is also negatively charged, from associating and non-specifically binding to the gold surface.
TOF–SIMS was used to characterize and optimize the various immobilization processes, which depend on a variety of parameters such as immobilization time and concentration. These must be iteratively optimized in order to achieve good hybridization conditions. Preliminary investigations of DNA and PNA fragments immobilized on silanized surfaces have shown that negative mass spectra can be used to identify DNA and PNA fragments [37, 42].
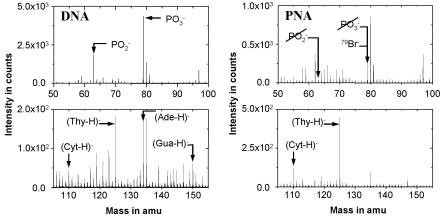
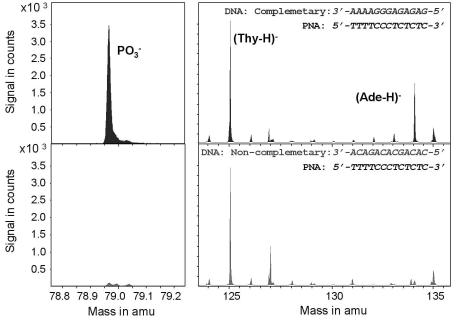
Figure 9.15 depicts parts of negative TOF–SIMS spectra obtained from immobilized DNA and PNA layers. The figure on the left shows the signal obtained from the DNA layer. Besides the deprotonated (M–H)− signals of the bases cytosine, thymine, adenine and guanine, there are two prominent phosphate peaks visible, PO−2 and PO−3 . The figure on the right shows a negative spectrum for immobilized PNA. Again, the deprotonated (M–H)− signals of the bases cytosine and thymine are visible. Note, however, that the two major DNA-specific phosphate peaks are very small in comparison to the DNA spectrum and are mainly due to contaminants. Some ion peaks caused by contaminants such as bromine are also observed. However, these do not cause any interference because they can be simply separated out by using a mass spectrometer with high mass resolution. A comparison between the PNA and the DNA spectrum demonstrates that the masses corresponding to PO−2 , PO−3 provide the best way for detecting the presence of DNA; they can be used to precisely distinguish between DNA and PNA.
Fig. 9.15. Negative TOF–SIMS spectra (50 to 155 amu) obtained from immobilized PNA and DNA layers. DNA sequence: 5 –ACATGCTGCTAGC–3 ; PNA sequence: 5 –TTTTCCCTCTCTC–3 .
202 M.Vaupel et al.
Fig. 9.16. Negative TOF–SIMS spectra (60 to 130 amu) obtained from hybridization experiments in which complementary and non-complementary DNA sequences were hybridized to a PNA sequence
After optimizing the immobilization steps, hybridization experiments were carried out. Partially complementary DNA sequences were removed from the microarray by appropriate washing techniques. Figure 9.16 shows mass spectra of such a hybridization experiment. As expected, the hybridized DNA can be unambiguously distinguished from the PNA by the dominant peaks of PO−3 and (Ade–H)−. Adenine can be used as an identifier for positive hybridization in this example because the sequences were selected in such a way that adenine occurs only in the complementary and non-complementary DNA sequences but not in the immobilized PNA sequence. A further major peak visible in the spectra is the deprotonated base signal (Thy-H)− of the PNA sequence, which has similar concentrations in both spectra. Interferences due to some minor ion peaks occurring at approximately the same mass as PO−3 and (Ade–H)− are separated out by the high mass resolution of m/∆m > 7000. Integration over the PO−3 and (Ade–H)− peaks resulted in a discrimination ratio of more than 10 between complementary and non-complementary DNAs. The best ratio observed in hybridization experiments was 200:1.
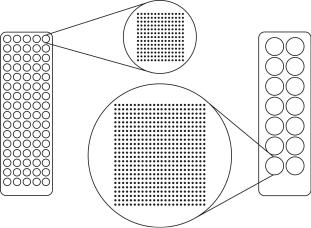
Figure 9.17 shows an image obtained from a PNA microarray that was produced by Hoheisel et al., DKFZ, Heidelberg. Two di erent PNA sequences with di erent concentrations and three di erent types of spacer were immobilized directly onto a gold surface using robotic spotting techniques [36].
9 Marker-free Detection on Microarrays |
203 |
Fig. 9.17. TOF–SIMS image (159 amu) and a line scan obtained from a PNA microarray chip hybridized with unlabelled DNA using three di erent types of spacer. The position where the line scan was taken is marked by an arrow. PNA sequences: left side: 5 –AGCTTACGGATCA–3 ; right side: 5 –TTCTCCCTCTCTC–3 . PNA concentration changes from darker (highest concentration) to lighter (lowest concentration) colored dots: 160 M, 140 M, 120 M, 100 M, 80 M, 60 M, 40 M, 20 M, 10 M, 5 M; substrate size: 20 × 20 mm2; spot size diameter: 360 m
Unlabelled DNA, which was complementary to one of these sequences, was hybridized to this chip. The TOF–SIMS analysis shows that hybridized unlabelled DNA could be detected with good discrimination at the complementary PNA positions. The highest signal could be obtained at those PNA positions that had the longest spacer length. Also, the line scan shows that at these positions, no significant changes between the eight highest PNA immobilization concentrations were observed. Note that only a small fraction of a monolayer was needed for analysis using an Ar+ ion beam with a spot size of 30 m
204 M.Vaupel et al.
in diameter. Additional experiments showed that it is even possible to detect DNA in an area of less than 100 nm in diameter using a focussed Ga+ ion beam, corresponding to attomole sensitivity.
The data clearly show that TOF–SIMS is a powerful technique for identifying unambiguously hybridized unlabelled DNA on PNA microarray chips by detecting the phosphate or phosphate-containing compounds present in DNA. It is also very suitable for studying the complexity of the immobilization and hybridization process. Employing unlabelled DNA has several advantages over using fluorescent and radioactive labelling procedures, such as higher signal– to–noise ratio, higher sensitivity, absence of a labelling or amplification procedure, and direct analysis of hybridized genomic DNA. Particularly, the increase in the number of phosphates with increasing sequence length will be advantageous for sequencing genomic DNA. In future experiments, the spot size will be reduced to smaller than 10 × 10 m2, the repetition rate will be increased up to 200 kHz, and the sensitivity will be further improved by using polyatomic primary ions such as SF+5 or gold cluster ions [38]. With these experimental improvements, analysis time of only a few minutes for 10,000 immobilized PNA spots should become possible for genetic diagnostics.
References
1.Project “SCREEN” for foundations of laser based (marker–free) screening methods, for which all authors of this chapter acknowledge funding by the German Ministry of Research
2.Azzam RMA and Bashara NM, Ellipsometry and Polarized Light. North Holland Physics, 1987
3.Arwin H in: “Physical Chemistry of Biological Interfaces”, Baszkin A., Norde W. (ed.), 2000, 577–607, Marcel Dekker Inc, New York
4.Silin V, Plant A, Trends in Biotech, 1997 15: 353–359
5.Sojka B, Piunno P, Wust C., Krull U., Appl. Biochem. Biotechnol. 2000 Oct, 89(1): 85–103
6.Chrisey L, Lee G, O’Ferrall E, Nucleic Acids Research, 1996 24(15): 3030–3039
7.Strother T, Cai W, Zhao X, Hamers R, Lloyd M, J. Am. Chem. Soc., 2000 122(6): 1205–1209
8.Greulich KO, 1998. Intrinsic fluorescence techniques for studies on protein– protein and protein–RNA interaction in RNP Particles. In: Schenkel J (ed), Lab Manual: RNP Particles, splicing and autoimmune diseases. Springer, Heidelberg, 48–71
9.Lakowicz JR, 1983. Protein Fluorescence, Principles of Fluorescence Spectroscopy. Plenum Publishing Coorporation, New York, 354–357
10.Schwarzwald R, Greulich KO, 1988. Tyrosine fluorescence energy transfer as a probe for protein–DNA interactions. Ber Bunsenges Phys Chem 92: 447
11.Alcala JR, Gratton E, and Prendergast FG, 1987. Fluorescence lifetime distributions in proteins. Biophys J 51: 597–604
12.Petrich JW, Chang MC, McDonald DB, and Fleming GR, 1983. On the origin of nonexponential fluorescence decay in tryptophan and its derivatives. J Am Chem Soc 105: 3815–3832
9 Marker-free Detection on Microarrays |
205 |
13.Raghavachari N, Bao YP, Li G, Xie X, and M¨uller UR, 2003. Reduction of autofluorescence on DNA microarrays and slide surfaces by treatment with sodium borohydride. Anal Biochem 312: 101–105
14.Hermanson GT, 1996. Bioconjugate Techniques. Academic Press Inc, San Diego, CA
15.Afanassiev V, Hanemann V, W¨olfl S, 2000. Preparation of DNA and protein micro arrays on glass slides coated with an agarose film. Nucleic Acids Res 28: e66
16.Peluso P, Wilson DS, Do D, Tran H, Venkatasubbaiah M, Quincy D, Heidecker B, Pointdexter K, Tolani N, Phelan M, Witte K, Jung LS, Wagner P, and Nock S, 2003. Optimizing antibody immobilization strategies for the construction of protein microarrays. Anal Biochem 312: 113–124
17.Hermanson GT, Mallia AK, and Smith PK, 1992. Immobilized A nity Ligand Techniques. Academic Press Inc., San Diego, CA
18.Roegener J, Lutter P, Reinhardt R, Bluggel M, Meyer HE, and Anselmetti D, 2003. Ultrasensitive Detection of Unstained Proteins in Acrylamide Gels by Native UV Fluorescence. Anal Chem 75: 157–159
19.B¨ohm KJ, Stracke R, M¨uhlig P, and Unger E, 2001. Motor protein–driven unidirectional transport of micrometer–sized cargoes across isopolar microtubule arrays. Nanotechnology 12: 238–244
20.Arlinghaus HF, Kwoka MP, Guo XQ, Jacobson KB, 1997. Multiplexed DNA Sequencing and Diagnostics by Hybridization with Enriched Stable Isotope Labels, Anal. Chem. 69, 1510–1517
21.Jacobson KB, Arlinghaus HF, 1992. Development of Resonance Ionization Spectroscopy for DNA Sequencing and Genome Mapping, Anal. Chem. 64, 315A– 328A
22.Jurinke C, van den Boom D, Cantor RC, K¨oster H, 2002. The use of MassARRAY technology for high throughput genotyping, Adv. Biochem. Eng. Biotechnol. 77, 57–74
23.Kirpekar F, Berkenkamp S, Hillenkamp F, 1999. Detection of double–stranded DNA by IR– and UV–MALDI mass spectrometry, Anal. Chem. 71, 2334–2339
24.Kirpekar F, Nordho E, Larsen LK, Kristiansen K, Roepstor P, Hillenkamp F, 1998. DNA sequence analysis by MALDI mass spectrometry, Nucleic Acid Research 26(11), 2554–2559
25.Little DP, Cornish TJ, O’Donnell MJ, Braun A, Cotter RJ, K¨oster H, 1997.
MALDI on a Chip: Analysis of Arrays of Low–Femtomole to Subfemtomole Quantities of Synthetic Oligonucleotides and DNA Diagnostic Products Dispensed by a Piezoelectric Pipet., Anal. Chem. 69, 4540–4546
26.O’Donnell MJ, Tang K, K¨oster H, Smith CL, Cantor CR, 1997. High–Density, Covalent Attachment of DNA to Silicon Wafers for Analysis by MALDI–TOF Mass Spectrometry, Anal. Chem. 69, 2438–2443
27.Chakrabarti MC, Schwarz FP, 1999. Thermal stability of PNA/DNA and DNA/DNA dupexes by di erential scanning calorimetry, Nucleic Acids Research 27(24), 4801–4806
28.Hoheisel JD, 1997. Oligomer–chip technology, TIBTECH 15, 465–469
29.Matysiak S, Reuthner F, Hoheisel JD, 2001. Automating parallel peptide synthesis for the production of PNA library arrays, BioTechniques 31, 896–904
30.Nielsen PE, 1999. Applications of peptide nucleic acids, Current Opinion in Biotechnology 10, 71–75
206 M.Vaupel et al.
31.Nielsen PE, 1997. Peptide nucleic acid (PNA) from DNA recognition to antisense and DNA structure, Biophysical Chemistry 68, 103–108
32.Ratilainen T, Holm´en A, Tuite E, Nielsen PE, Nord´en B, 2000. Thermodynamics of sequence–specific binding of PNA to DNA. Biochemistry, 39, 7781–7791
33.Ratilainen T, Holm´en A, Tuite E, Haaima G, Christensen L, Nielsen PE, Nord´en B, 1998. Hybridization of peptide nucleic acid, Biochemistry 37, 12331–12342
34.Ray A, Norden B, 2000. Peptide nucleic acid (PNA): medical and biotechnical applications and promise for the future, The FASEB Journal 14, 1041–1060
35.see articles in: Peptide Nucleic Acids: Protocols and Applications, 1999, Nielson PE, Egholm M, eds., Horizon Scientific Press, Wymondham, UK
36.Weiler J, Gausepohl H, Hauser N, Jensen ON, Hoheisel JD, 1997. Hybridization based DNA screening on peptide nucleic acid (PNA) oligomer arrays, Nucleic Acids Research 25(14), 2792–2799
37.Arlinghaus HF, Ostrop M, Friedrichs O, Feldner J, Gunst U, Lipinsky D, 2002. DNA sequencing with ToF–SIMS, Surf. Interf. Anal. 33, 35–39
38.Arlinghaus HF, H¨oppener C, Drexler J, 2000. TOF–SIMS Characterization of DNA and PNA Biosensor Chips, in: Secondary Ion Mass Spectrometry SIMS XII, Benninghoven, A., Bertrand, P., Migeon, H.–N., Werner, H.W., eds., Elsevier, Amsterdam, 951–954
39.Arlinghaus HF, Kwoka MN, Jacobson KB, 1997. Analysis of Biosensor Chips for Identification of Nucleic Acids, Anal. Chem. 69, 3747–3753
40.Arlinghaus HF, Ostrop M, Friedrichs O, Feldner J, 2003. Genome Diagnostic with TOF–SIMS, Appl. Surf. Sci., 203–204, 689–692
41.Feldner JC, Ostrop M, Friedrichs O, Sohn S, Lipinsky D, Gunst U, Sohn S, Arlinghaus HF, 2003. TOF–SIMS Investigation of the Immobilization Process of Peptide Nucleic Acids, Appl. Surf. Sci., 203–204, 722–725
42.H¨oppener C, Drexler J, Ostrop M, Arlinghaus HF, 2000. Investigation of the Immobilization Process of Nucleic Acid, in: Secondary Ion Mass Spectrometry SIMS XII, Benninghoven, A., Bertrand, P., Migeon, H.–N., Werner, H.W., eds., Elsevier, Amsterdam, 915–918
43.Gri n TJ, Smith LM, 2000. Single–nucleotide polymorphism analysis by MALDI–TOF mass spectrometry, TIBTECH, 18, 77–84
44.Ross PL, Lee K, Belgrader P, 1997. Discrimination of single–nucleotide polymorphisms in human DNA using peptide nucleic acid probes detected by MALDI– TOF mass spectrometry, Anal. Chem. 69, 4197–4202
45.Storm N, Darnhofer B, van den Boom D, Rodi CP, 2003. MALDI–TOF mass spectrometry–based SNP genotyping, Methods in Mol. Biol. 212, 241–62
46.Syv¨anen A, 2001. Accessing genetic variation: Genotyping single nucleotide polymorphisms, Nature Reviews 2, 930–942
47.Wang J, Rivas G, Cai X, Chicharro M, Parrado C, Dontha N, Begleiter A, Mowat M, Palecek E, Nielsen PE, 1997. Detection of point mutation in p53 gene using a peptide nucleic acid biosensor, Analytica Chimica Acta 344, 111– 118
48.Wittung–Stafshede P, Rodahl M, Kasemo B, Nielsen P, Norden B, 2000. Detection of point mutations in DNA by PNA–based quarz–crystal biosensor, Colloids and Surfaces A: Physicochem. Eng. Aspects 174, 269–273
49.Berkenkamp S, Kirpekar F, Hillenkamp F, 1998. Infrared MALDI mass spectrometry of large nucleic acids, Science 281, 260–262
50.Karas M, Bachman D, Bahr U, Hillenkamp F, 1987. Int. J. Mass Spectrom. Ion Processes, 78, 53–68
9 Marker-free Detection on Microarrays |
207 |
51.Arlinghaus HF, 2002, Static Secondary Ion Mass Spectrometry (SSIMS ) in: Surface and Thin Film Analysis. Principles, Instrumentation, Applications, Bubert H, Jenett H, eds., Wiley–VCH, 86–106
52.Benninghoven A, R¨udennauer FG, Werner HW, 1987. Secondary Ion Mass Spectrometry, Wiley, New York
53.see articles in the Proceeding of Secondary Ion Mass Spectrometry SIMS II – SIMS XIII
54.Vickerman JC, Briggs D, 2001. TOF–SIMS, Surface Analysis by Mass Spectrometry, IM Publication, Charlton, UK
55.Stapel D, Brox O, Benninghoven A, 1999. Appl. Surf. Sci. 140, 156–67
56.Prewett PD, Je eries DK, 1980. J. Phys. D 13, 1747–1755
57.Niehuis E, Heller T, Feld H, Benninghoven A, 1987. J. Vac. Sci. Technol. A 5, 1243
58.Karataev VI, Mamyrin BA, Shmikk DV, 1972. Sov. Phys. Techn. Phys. 16, 1177
59.Schueler BW, 1992. Microsc. Microanal. Microstruct. 3, 119
60.Iltgen K, Bendel C, Niehuis E, Benninghoven A, 1997. J. Vac. Sci. Technol. A 15, 460
61.Sakurai T, Matsuo T, Matsuda H, 1985. Int. J. Mass. Spectrom. Ion Phys. 63, 273
62.Schreiber F, 2000. Structure and growth of self–assembling monolayers, Progress in Surface Science 65, 151–256
63.Huang E, Zhou F, Deng L, 2000. Studies of surface coverage and orientation of DNA molecules immobilized onto preformed alkanethiol self–assemled monolayers, Langmuir 16, 3272–3280
64.Kr¨oger, K., Jung, A., Barzen, C., Gaulitz, G., 2002, Versatile biosensor surface based on peptide nucleic acid with label free and total internal reflection fluorescence detection for quantification of endocrine disruptors, Analytical Chimica Acta, 469(1), 37–48
Part II
DNA Microarrays

10
Analysis of DNA Sequence Variation
in the Microarray Format
Ulrika Liljedahl, Mona Fredriksson, and Ann-Christine Syv¨anen
10.1 Introduction
Single nucleotide polymorphisms (SNPs) are sequence positions, where more than one nucleotide is observed when DNA sequences of multiple individuals within a population or between populations are compared. SNPs are the most frequent type of genetic variation in the human genome, and they occur at one out of every thousand to two thousand nucleotides. Following the completion of the draft sequence of the human genome [1, 2], it has become feasible to compare DNA sequences from multiple individuals and populations both experimentally and in silico, to identify large sets of SNPs. Today more than four million SNPs are included in public databases, and a large fraction of these SNPs have been assigned to a defined position in the genome (www.ncbi.nlm.nih.gov/SNP). The number of SNPs with known allele frequencies in various populations is also growing rapidly.
Depending on their genomic locations, the phenotypic consequences of the SNPs di er. SNPs in coding regions of genes may alter the amino acid sequence of the encoded proteins, thus a ecting their structure and function, and consequently their physiological role. SNPs located in the regulatory regions of a gene may a ect the binding of transcription factors, thereby influencing the expression level of the gene. Most of the SNPs are located in non-coding regions of the genome, where they have no known impact on the phenotype of an individual. These SNPs are useful as genetic markers in forensic identification, in tissue typing, for population genetic studies and evolutionary studies. SNPs (point mutations) causing monogenic disorders have been routinely analyzed for diagnostics and identification of disease carriers for more than a decade. In pharmacogenetics, SNPs in genes for drug metabolizing enzymes are analyzed to assess an individual’s response to drug treatment [3]. As molecules other than drug metabolizing enzymes, such as drug receptors or transporters, are becoming targets for pharmacogenetic analysis [4], this field is a rapid growing area of SNP typing today. SNPs in candidate genes are often used as markers in association studies aiming at identifying genes predisposing to multifacto-
212 Ulrika Liljedahl et al.
rial disorders. The hope that SNPs may be useful as markers in genome–wide association or linkage studies to identify these genes, has stimulated e orts to increase throughput and decrease the cost of methods for SNP genotyping.
Most of the currently used genotyping methods depend on amplification of the genomic region of interest by the polymerase chain reaction (PCR) [5–7] to provide su cient sensitivity and specificity to detect a SNP among the 3 × 10⁹ base pairs of DNA that constitute the human genome. However, today PCR is the major bottle–neck for high throughput genotyping of previously known SNPs at di erent locations of the genome due to the di culty of performing multiplex amplification [8]. In applications where complete genes or exons are resequenced to detect previously unknown mutations, the problem of designing multiplex PCR is avoided to some extent.
The microarray format is attractive for analyzing previously known SNPs as well as for resequencing because of the potential of increasing the throughput of the assay by simultaneous and highly parallel analysis of multiple sequence variants. The cost for the reagents is also reduced owing to the miniaturized format of the microarrays. The microarray format was first designed for expression profiling, where typically very large numbers of mRNA species are analyzed in a relatively small number of samples [9]. The standard microscope slide format used for expression profiling, where one sample is analyzed
Fig. 10.1. ‘Array–of–arrays’ conformation. A standard microscope slide is divided into 80 subarrays with a diameter identical to that of a 384–well microtiter plate reaction well (left image). Up to 14 × 13 = 182 oligonucleotide spots can be printed per subarray at a center–to–center distance of 200 m. If more SNPs are to be analyzed the ‘array–of–arrays’ format can be converted to a format with subarrays with the same diameter as a reaction well of a 96–well microtiter plate. In this case 14 separate subarrays fit per slide and 24 × 24 = 576 oligonucleotide spots can be printed in each subarray (right image)
10 Analysis of DNA Sequence Variation in the Microarray Format |
213 |
per slide, is not practical for SNP genotyping studies, where a large number of samples are to be analyzed for each set of SNPs.
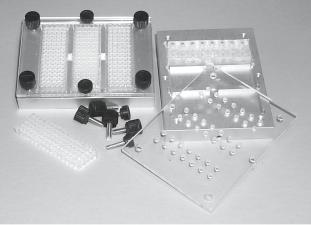
To circumvent this problem an ‘array–of–arrays’ conformation, that allows parallel analysis of up to 80 samples for each set of SNPs on a single microscope slide [4, 10, 11], has been devised (Fig. 10.1). Each microarray is divided into multiple separate reaction wells by a silicon rubber grid that is placed on the microscope slide (Fig. 10.2). A similar ‘array–of–arrays’ concept is also utilized in a 384–well–microtiter plate format instead of using a microscope slide (SNPstream UHT, Orchid Biosciences [12]). The ‘array–of– arrays’ format was originally devised for genotyping by allele-specific primer extension [10], but the format can equally well be used with all other reaction principles for SNP–typing.
10.2 Principles of Genotyping
Most of the techniques used for analysis of genetic variation are based on either hybridization with short allele specific oligonucleotide (ASO) probes or on the action of DNA modifying enzymes such as DNA–polymerases and ligases to determine the sequence variation.
Fig. 10.2. The microarray reaction rack. A custom made aluminium reaction rack that holds three microarray slides is used as an incubation chamber in the microarray based minisequencing reactions. A silicone grid is used to separate the di erent samples on the microarray. Reusable silicon rubber grids are moulded on an inverted 384– or 96–well microtiter plate using PDMS (polydimethyl siloxane, e.g. Elastosil RT 625A and B, Wacker–Chemie) according to the manufacturer’s instruction, followed by cutting the grid to match the size of the slides
214 Ulrika Liljedahl et al.
10.2.1 Hybridization
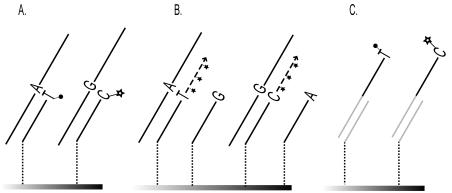
In hybridization with ASO–probes, the destabilising e ect of a single nucleotide mismatch between an oligonucleotide probe and its target sequence is utilized to distinguish between sequence variants (Fig. 10.3a). The reaction conditions are optimized with respect to ionic strength and temperature to provide maximal discrimination between the two sequence variants. However, the stability of the oligonucleotide–target hybrid is also a ected by the sequence flanking the SNP–position, as well as by the secondary structure of the template. Therefore there is no single set of reaction conditions that would provide optimal specificity for all SNPs in multiplexed hybridization assays.
Multiplex analysis using ASOs on microarrays is used in the A ymetrix GeneChip R assay, where the di culty in assay design is circumvented by using arrays with tens of di erent allele-specific oligonucleotides for each SNP to be analyzed [13] and by accepting a reduced success rate [14]. Other attempts to circumvent the specificity problem of multiplexed ASO–assays is to employ temperature gradients [15] or electric field gradients (e.g. Nanogen) [16] to the microarrays. In these methods optimal discrimination between match and mismatch is achieved at a specific point of the gradient.
Peptide nucleic acids (PNA) or locked nucleic acids (LNA) can also be used to increase the power of ASO hybridization. Due to their chemical structure, PNA and LNA have strong a nities for complementary DNA, which allows for the use of shorter probes than the natural ASO–probes to improve the discrimination between the SNP alleles [17, 18].
10.2.2 Oligonucleotide Ligation
In the oligonucleotide ligation assay (OLA) [19], the ability of a DNA ligase to discriminate between a match and a mismatch hybridization at the ligation point is utilized. An allele-specific probe and a ligation probe are hybridized to a target sequence, and in the case of a perfect match between the allelespecific probe and the target, the junction between the two probes is closed by ligation which facilitates the detection (Fig. 10.3b). OLA has been adopted to the microarray format with one of the ligation probes immobilized [20] or with immobilized single stem loop probes [21]. It is also possible to perform the ligation reaction in solution followed by capturing of the products on microarrays [22] or microparticles [23] by hybridization to generic tag or zip– code oligonucleotides.
Padlock probes are circularisable oligonucleotide ligation probes with specific target recognition sequences in their 5 and 3 ends and a connecting sequence between the target specific regions [24]. When hybridized to its target sequence the two ends of the probe are brought adjacent to each other, and the junction is ligated when there is a perfect match. Proof of principle of highly multiplex padlock probe ligation using ‘molecular inversion probes’ in solution has recently been shown [25]. In this assay the circularized probes
10 Analysis of DNA Sequence Variation in the Microarray Format |
215 |
are detected by PCR with tagged primers followed by capture on microarrays. Another novel, highly multiplexed ligation assay is used in a bead array format [26].
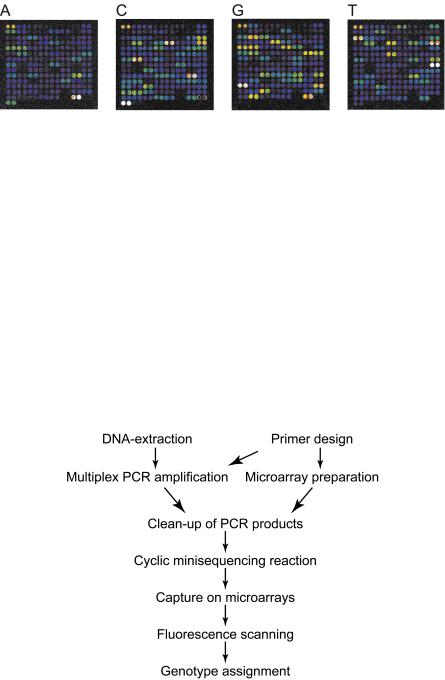
Fig. 10.3. Reaction principles for SNP genotyping. Detection of the A–allele in an A to G transition is shown; the G–allele would be detected analogously. (a) Hybridization with allele-specific oligonucleotides (ASO). Two ASO probes are required for each SNP to be analyzed, and a nucleotide near the middle position of the probe is complementary to the allelic variant of the SNP. The reaction conditions are set to allow only perfect matches to be stable and detectable. (b) In the oligonucleotide ligation assay (OLA) a ligation probe and an allele-specific probe are used for detection of the allelic variant of the SNP. When there is a perfect match between the allele-specific probe and the target sequence, the junction between the two probes can be closed with a ligase. (c) Minisequencing single nucleotide primer extension. A minisequencing primer that anneals immediately adjacent to the SNP–position will be extended with a nucleotide complementary to the nucleotide at the variable site by the action of a DNA polymerase. (d) Allele-specific primer extension. A primer with an allele-specific 3 –end anneals to the target sequence. Only in case of a perfect match between the primer and the target sequence, the primer will be extended
216 Ulrika Liljedahl et al.
10.2.3 DNA Polymerase Assisted Methods
In minisequencing, also denoted single nucleotide primer extension (SNE) and single base extension (SBE), a DNA polymerase is used to extend a detection primer, that anneals immediately adjacent to the site of the SNP, with a labelled nucleotide analogue [27, 28] (Fig. 10.3c). In the microarray format of minisequencing, also denoted arrayed primer extension (APEX), the SNP-specific detection primers are attached covalently to the surface of activated microscope slides through their 5 –end, and their 3 –ends are extended with labelled ddNTPs that are complementary to the nucleotide at the SNP site [4,29–33] (Fig. 10.4a). The primer extension reaction allows specific genotyping of most SNPs at similar reaction conditions using only a single primer per SNP, which are important features in the multiplexed assays in a microarray format. In a side–by–side comparison with ASO hybridization in the same microarray format, the minisequencing reaction provided ten–fold higher power of discrimination between heterozygous and homozygous genotypes than hybridization with ASO probes [29].
Fig. 10.4. Reaction principles for primer extension on microarrays. Detection of a heterozygous sample is presented. In direct minisequencing on microarrays (a) one minisequencing primer for each SNP is immobilised, and multiplex PCR products, fluorescently labelled ddNTPs and a DNA polymerase are added. The primer extension is allowed to proceed on the surface of the array, followed by fluorescence scanning with a laser scanner. For the allele-specific primer extension (b) two oligonucleotides with the 3 –nucleotide complementary to the two possible nucleotides of each SNP are immobilized on the array. In the presence of a perfectly matched target sequence the allele-specific oligonucleotide becomes extended by a DNA–polymerase. In the tag array based minisequencing (c) cyclic single nucleotide primer extension reactions are carried out in solution in the presence of fluorescently labelled dideoxynucleotides with the minisequencing primers carrying an extra tag– sequence in their 5 –end. Generic arrays of oligonucleotides that are complementary to the tag–sequences are used to capture the product on the microarray after the cyclic minisequencing reactions
10 Analysis of DNA Sequence Variation in the Microarray Format |
217 |
DNA polymerases may also be utilized for SNP genotyping by allelespecific primer extension in the microarray format (Fig. 10.3d). In this case two immobilized primers with 3 –ends complementary to either of the nucleotides of the SNP are used [10] (Fig. 10.4b). In this approach, primer extension will only occur when there is a perfect match in the 3 –end of the primer. The allele-specific primer extension reaction is more dependent on the reaction conditions than minisequencing, but its specificity has been increased by analyzing RNA templates in conjunction with reverse transcriptase reactions in the presence of trehalose [10] which has allowed accurate genotyping in a large study where 140,000 genotypes where produced [34]. Another approach for increasing the specificity of allele-specific primer extension is to include apyrase in the reaction to prevent the slower mismatched extension reaction [35].
In an alternative format of the minisequencing system, multiplex cyclic primer extension reactions are performed in solution with primers tailed with 5 –tag sequences. The products of the minisequencing reaction are then captured to complementary tag sequences immobilized on the microarray by hybridization (Fig. 10.4c). This flexible genotyping strategy that was first described for microspheres [36, 37], has been used in conjunction with both lowdensity [38] and high density [39] microarrays. In the latter application, the high density GeneChip R platform was combined with genotyping by single nucleotide primer extension.
The tag–array assays are more flexible to design compared to the minisequencing approach with immobilized extension primers, since the array is generic and thus can be used for many di erent sets of SNPs. The ‘array–of– arrays’ format is particularly well suited for genotyping by the flexible tag– array approach [11]. Additionally, the cyclic extension reaction also serves to increase the signal strength. The accuracy of the primer extension reactions in solution allows multiplex quantification of variant alleles present as a small minority (2–5%) of a sample [11].
In the following section two important features of the microarray based assays, namely production of microarrays and labelling strategies will be discussed in more detail.
10.3 Performing the Assays in Practice
10.3.1 Production of Microarrays
The manufacturing of microarrays can be performed through in situ synthesis of oligonucleotides on the surface of the microarray, or by chemical immobilization of presynthesised oligonucleotides. The material used for microarrays must have low autofluorescence and high binding capacity of oligonucleotides. Glass meets these criteria, and in addition it is non-porous, which allow the use of small reaction volumes, and it is durable to both heat and chemicals.
218 Ulrika Liljedahl et al.
In situ synthesis of oligonucleotides at high density on a glass surface using light directed photolithography has been developed by A ymetrix [40]. These GeneChip R arrays are used for expression analysis and for genotyping using ASO–probes. The photolithographic synthesis proceeds in the 3 –5 direction, which makes the GeneChip R arrays impossible to use in direct primer extension assays, where a free 3 –end is needed for the polymerase to extend. A proposed strategy for avoiding this limitation is to perform the in situ synthesis in 3 –5 –direction with a subsequent inversion of the oligonucleotide on the surface [41]. Direct in situ synthesis on glass surfaces in the 5 –3 – direction using 5 –phosphoramidites has also been proposed [42]. However, the most frequently used method for producing microarrays for primer extension is to attach presynthesised oligonucleotides on the glass surface. Covalent attachment is preferred over passive adsorption since it can be better controlled than in situ synthesis. Covalent attachment also allows for better accessibility for the oligonucleotide in the proceeding genotyping reaction, and allows the use of more stringent washing protocols than arrays prepared by adsorption [43–45].
We have previously compared six chemical reactions for immobilization of oligonucleotides on a surface for application in the microarray based minisequencing method [32]. Both commercially and in–house coated slides were evaluated to identify the slide with the best binding capacity and most favorable performance in the minisequencing reaction with respect to background fluorescence prior to and after the reaction, as well as signal intensities and power of genotype discrimination. We found the CodeLinkTM Activated Slides from Amersham Biosciences (previously denoted CodeLinkTM Activated Slides, Motorola and 3DLinkTM Activated Slides, SurModics) to have the highest binding capacity of oligonucleotides relative to the in–house coated isothiocyanate slides that served as reference. Although the mercaptosilane slides (Orchid Biosciences [46]) binding disulfide-modified oligonucleotides have lower binding capacity than the CodeLinkTM slides, the slides performed equally well in the minisequencing reaction because of their lower background fluorescence.
10.3.2 Labelling Strategies
In principle any detection strategy, such as radioactivity, colorimetry and fluorescence may be used in the microarray format, but fluorescence is the far most frequently used principle today. The A ymetrix GeneChip R system employs an indirect fluorescence detection strategy, in which the target sequence is first labelled using a biotin–conjugated nucleotide, which is visualized in a subsequent staining reaction with a fluorescent streptavidin–phycoerythrin conjugate [13,47]. Many di erent fluorophores are available for direct labelling, followed by detection using fluorescence microscopes, CCD cameras or fluorescence scanners with photomultiplier tubes. In OLA two allele-specific fluorescently labelled oligonucleotides are required for each SNP [22]. An advantage
10 Analysis of DNA Sequence Variation in the Microarray Format |
219 |
Fig. 10.5. Fluorescence scan image of cyclic minisequencing products captured on a generic microarray carrying complementary tag sequences for detection of 55 SNPs in duplicate. The minisequencing reactions were performed with the four ddNTPs labelled with di erent fluorophores (Texas Red–ddATP, Tamra–ddCTP, R110–ddGTP, Cy5–ddUTP) and detected with a four color laser scanner (equipped with the excitation lasers: Blue Argon 488 nm, Green HeNe 543.5 nm, Yellow HeNe 594 nm and Red HeNe 632.8 nm) according to the protocol provided in Table 10.3.2 The rainbow color scale corresponds to the di erent signal intensities with blue as low and white as saturated signal
of primer extension assisted reactions over OLA is that an unlabelled oligonucleotide primer becomes labelled in the actual detection reaction, which reduces the cost of the assay.
In allele-specific primer extension, dNTPs labelled with a single fluorophore are used [10,35], while multiple fluorophores are available and can be used in a variety of minisequencing single nucleotide primer extension assay designs. The same fluorophore may be used on all four nucleotides, in which case four separate reactions are performed for each sample [4, 32]. Three dif-
Fig. 10.6. Steps of the tag–array based minisequencing procedure. The steps are explained in detail in the protocol provided in Table 10.3.2

220 Ulrika Liljedahl et al.
ferent fluorophores [38] are in principle su cient to analyst all possible SNPs in a single reaction if both DNA strands are utilized. The use of four di erent fluorophores, one for each of the four dideoxynucleotides, is the most convenient approach [11, 31, 48]. The utilization of multiple fluorophores requires that they have distinct non-overlapping wavelengths to limit the ‘cross–talk’ between their emission spectra. Figure 10.5 shows four fluorescence scans at di erent wavelengths for one sample genotyped for 55 SNPs. The e ciency and sequence specificity of the DNA polymerase is a ected both by the ddNTP and the fluorophore, but most of all by the sequence context of the SNP [11]. Figure 10.6 outlines the steps of the procedure for performing multiplexed genotyping by minisequencing using tag–arrays. An experimental protocol is provided in Table 10.3.2.
Table 10.1. Protocol for minisequencing in the tag–array format using four fluorophores
Step of the Procedure |
Notes |
|
|
1. Design of PCR primers |
There is no publicly available |
The primers should have similar Tm |
software for design of PCR– |
and low self complementarity to reduce |
primers for multiplex reactions. |
primer dimer formations. |
|
2. Design of minisequencing primers |
A Tm of 55–60◦C ensures |
Minisequencing primers are 20–27 |
specificity in the following cyclic |
nucleotides in length and have similar |
primer extension reaction. The tag |
Tm. In their 5 –end a 20 nucelotide |
sequence should be selected not |
tag sequence (A ymetrix GeneChip R |
to favor formation of secondary |
Tag Collection) is incorporated. |
structures (i.e. hairpin loops). |
3. Preparation of microarrays |
Di erent types of slides with a |
The complementary tag sequences contain |
variety of chemical reaction types |
a 15 T–residue spacer and an amino–group |
are available. We use CodeLinkTM |
in the 3 –end to enable chemical |
activated slides since they per– |
immobilization. A 25 M solution of the |
formed best in a comparison for |
oligonucleotide in 150 mM sodium phosphate |
our application [32]. |
bu er pH 8.5 is printed on CodeLinkTM |
The oligonucleotides are |
activated slides (Amersham Biosciences) |
printed in duplicate spots on the |
according to the manufacturer’s protocol. |
microarray. |
4. Multiplex PCR amplification |
Multiplex PCR of more than |
Typical reaction conditions are U/ l |
ten fragments has proven di cult |
of a thermostable DNA polymerase, |
to reproduce in multiple samples |
1.5–4 mM MgCl2, 0.2 mM dNTP, |
[10, 33] |
220 ng DNA and 0.14 M primers in |
The pooled PCR products can |
5–50 l reaction volumes in 96– or |
be used directly or they can |
384–well micro–titer plates. |
be concentrated by ethanol pre– |
|
|
|
Continued on next page |

10 Analysis of DNA Sequence Variation in the Microarray Format |
221 |
||
|
|
|
|
Step of the Procedure |
Notes |
|
|
|
|
|
|
PCR program: 94◦C for 10 minutes, |
cipitation or by spin dialysis with |
|
|
then 94◦C for 0.5–1 minute, 55–68◦C |
Centricon R devices (Millipore |
|
|
(depending on the Tm of the primers) |
Corporation) to increase the |
|
|
for 0.5–1 minute, 72◦C for 1.5 minutes |
amount of amplicons. |
|
|
for 35 cycles and a final extension at 72◦C for 7 minutes The multiplex PCR products from each sample are pooled.
5.Clean–up of PCR products Seven l of pooled PCR product is
treated with 0.5 U/ l Exonuclease I and 0.1 U/ l shrimp alkaline phosphatase (USB Corporation) in 4–8 mM MgCl2,
50mM Tris–HCl, pH 9.5, in a 10.5 l volume at 37◦C for 30–60 minutes The enzymes are inactivated at 99◦C for 15 minutes
6.Cyclic minisequencing reaction
The reaction mixture contains 10.5 l of enzyme-treated PCR product, 5.0 mM of each tagged minisequencing primers, 0.09–0.27 M of fluorescent ddNTPs (TexasRed–ddATP, TAMRA–ddCTP, R110–ddGTP, Cy5–ddUTP (Perkin Elmer Life Sciences)), 0.017% Triton– X–100, 50 mM Tris–HCl pH 9.5, 0.07 U/ l of ThermoSequenaseTMDNA Polymerase (Amersham Biosciences) and 1 nM of control templates in a 15l volume. The reaction is repeated for 33 cycles of 95◦C and 55◦C for 20 seconds each.
7. Capture on microarrays
The slides are preheated to 42◦C in a custom–made aluminium reaction rack (Fig. 10.2). Fifteen l of minisequencing reaction product, 0.4 nM of TAMRAlabelled control oligonucleotide in 22 l of 6× SSC, are added to each reaction well on the microscope slide. After hybridization for 2–3 hours at 42◦C, the slides are briefly rinsed with 4× SSC at room temperature and washed twice for 5 minutes with 2× SSC,
0.1% SDS at 42◦C and twice for 1 minute with 0.2× SSC at room temp. The slides are dried by centrifugation for 5 minutes at 500 rpm.
Exonuclease I degrades the ex– cess of PCR primers and shrimp alkaline phosphatase inactivates the dNTPs. The MgCl2 concentra– tion has to be optimized and ad– justed according to the amount added with the PCR product.
Avoid exposing the fluoropho– res to light to prevent bleaching. The fluorophores should have dis– tinct and non-overlapping emis– sion spectras. It may be advanta– geous to use Cy5–ddUTP at a higher concentration than the other ddNTPs. The control tem– plates are four synthetic oligonu– cleotides mimicking a four allelic SNP for which the primer will be extended with A, C, G or T respectively. Up to 99 cycles can be performed.
To avoid drying of the reac– tion wells, which can lead to high background fluorescence, a wet tissue paper is placed on the plexiglass lid and covered with saran–wrap and aluminium foil. The control oligonucleotide is a fluorescently labelled, synthetic sequence that hybridize to its complementary sequence on the slide. 1 × SSC: 150 mM sodium chloride, 15 mM sodium
citrate pH 7.0.
Continued on next page

222 |
Ulrika Liljedahl et al. |
|
|
|
|
Step of the Procedure |
Notes |
|
|
|
|
8. Fluorescence scanning |
Figure 10.5 shows fluorescence |
|
Fluorescence signals on the slides are detected |
images of a microarray scanned |
|
using a four color laser scanner (e.g. |
at four di erent wavelengths |
|
ScanArray R 5000, Perkin Elmer LifeSciences). |
after hybridization of a |
|
The signal intensities are measured with the |
cyclic minisequencing product. |
|
analysis software of the scanner (QuantArray R ). |
|
|
9. Genotype assignment |
A software for genotype as– |
|
The mean value of the signals from the duplicate |
signment for SNPs is the |
|
spots is corrected for the average background |
SNPsnapper software, available |
|
in the reaction well. Genotypes are assigned |
at: |
|
by calculating the ratio between the signal |
http://www.bioinfo.helsinki.fi/ |
|
intensity from one of the alleles divided by |
SNPSnapper/ |
|
the sum of the signals from both alleles |
|
|
using a Microsoft ExcelTMmacro. |
|
|
10.4 Conclusion
During the past few years much e ort has been targeted at developing technology for analyzing DNA sequence variation in the microarray format. Microarray-based methods have also been applied in a number of clinical, genomic and evolutionary studies. Table 10.2 provides some examples of these applications. So far the studies have been of modest size, but with the possibility of a high level of multiplexing to bring down the costs of the microarraybased assays, we can foresee studies on a much larger scale that will increase our understanding of the role of DNA sequence variation in health and disease.
Table 10.2. Examples of applications of microarray-based analysis of DNA sequence variants
Application |
Reaction |
Comment |
Ref. |
|
principle |
|
|
|
|
|
|
Comparative sequencing |
ASO–hybridization |
Introduction of |
[49] |
|
|
microarray concept |
|
Cystic fibrosis |
A ymetrix |
First use of GeneChip R |
[50] |
mutations |
GeneChip R |
for genotyping |
|
Recessive disease muta– |
Minisequencing |
Proof of principle for |
[29] |
tions in Finland |
primer extension |
primer extension on arrays |
|
Mutation detection in |
ASO–hybridization |
Strategy for multiplex |
[13] |
the ATM gene |
GeneChip R |
PCR design |
|
Risk factors for myocar– |
Minisequencing |
33P–detection |
[51] |
dial infarction |
primer extension |
|
|
Continued on next page
10 Analysis of DNA Sequence Variation in the Microarray Format |
223 |
||
|
|
|
|
Application |
Reaction |
Comment |
Ref. |
|
principle |
|
|
|
|
|
|
Map of 2,200 SNPs |
ASO–hybridization |
First ‘large scale’ SNP |
[52] |
|
GeneChip R |
e ort |
|
Ancestral alleles of |
ASO–hybridization |
Large study 99,000 |
[53] |
human SNPs |
GeneChip R |
genotypes |
|
Detection of minority |
Oligonucleotide |
Zip–code approach |
[22] |
K–ras mutations |
ligation |
|
|
Panel of 142 human |
Tag–array single |
High density GeneChip R |
[39] |
SNPs |
base extension |
tag–arrays |
|
Hemochromotosis and |
Single nucleotide |
Two color fluorescence |
[30] |
connexin mutations |
primer extension |
detection |
|
Panel of 76 human |
Tag–array single |
Low density tag–arrays |
[38] |
SNPs |
base extension |
|
|
Detection of β– |
Arrayed primer |
Four color fluorescence |
[31] |
thalassemia mutations |
extension |
detection |
|
SNPs in the human mu |
Allele-specific |
Gelpad microchips |
[54] |
opioid receptor gene |
single nucleotide |
|
|
|
primer extension |
|
|
Population frequencies of |
Allele-specific |
Large study 140,000 |
[34] |
recessive mutations |
primer extension |
genotypes |
|
Y–chromosomal SNPs in |
Minisequencing |
Detection by 33P and |
[33] |
Finno–Ugric population |
primer extension |
single color fluorescence |
|
Linkage disequilibrium |
Arrayed primer |
Analysis of 900 SNP– |
[55] |
map of chromosome 22 |
extension |
markers in 50 Estonian |
|
|
|
samples |
|
Quantitative analysis of |
Tag–array minise– |
Four color fluorescence |
[11] |
interferon–related SNPs |
quencing single |
detection |
|
|
nucleotide primer |
|
|
|
extension |
|
|
Genome wide mapping |
ASO–hybridization |
Genotyping of 1200 |
[56] |
of allelic imbalances |
GeneChip R |
SNPs |
|
Resequencing exon 7 |
Arrayed primer |
Four color fluorescence |
[48] |
of the p53 gene |
extension |
detection |
|
Pharmacogenetics of |
Minisequencing |
Single color fluorescence |
[4] |
hypertension. |
primer extension |
detection. 74 SNPs |
|
References
1.Lander ES, Linton LM, Birren B, Nusbaum C, Zody MC, Baldwin J et al. (2001)
Initial sequencing and analysis of the human genome Nature 409: 860–921
224 Ulrika Liljedahl et al.
2.Venter JC, Adams MD, Myers EW, Li PW, Mural RJ, Sutton GG et al. (2001)
The sequence of the human genome Science 291: 1304–1351
3.Evans WE and Relling MV (1999) Pharmacogenomics: translating functional genomics into rational therapeutics Science 286: 487–491
4.Liljedahl U, Karlsson J, Melhus H, Kurland L, Lindersson M, Kahan T et al. (2003) A microarray minisequencing system for pharmacogenetic profiling of antihypertensive drug response Pharmacogenetics 13: 7–17
5.Saiki RK, Bugawan TL, Horn GT, Mullis KB and Erlich HA (1986) Analysis of enzymatically amplified beta-globin and HLA-DQ alpha DNA with allele-specific oligonucleotide probes Nature 324: 163–166
6.Mullis KB and Faloona FA (1987) Specific synthesis of DNA in vitro via a polymerase-catalyzed chain reaction Methods Enzymol 155: 335–350
7.Saiki RK, Gelfand DH, Sto el S, Scharf SJ, Higuchi R, Horn GT et al. (1988)
Primer-directed enzymatic amplification of DNA with a thermostable DNA polymerase Science 239: 487–491
8.Shuber AP, Grondin VJ and Klinger KW (1995) A simplified procedure for developing multiplex PCRs Genome Res 5: 488–493
9.Schena M, Shalon D, Davis RW and Brown PO (1995) Quantitative monitoring of gene expression patterns with a complementary DNA microarray Science 270: 467–470
10.Pastinen T, Raitio M, Lindroos K, Tainola P, Peltonen L and Syvanen AC (2000) A system for specific, high-throughput genotyping by allele-specific primer extension on microarrays Genome Res 10: 1031–1042
11.Lindroos K, Sigurdsson S, Johansson K, Ronnblom L and Syvanen AC (2002)
Multiplex SNP genotyping in pooled DNA samples by a four-colour microarray system Nucleic Acids Res 30: e70
12.Bell PA, Chaturvedi S, Gelfand CA, Huang CY, Kochersperger M, Kopla R et al. (2002) SNPstream UHT: ultra-high throughput SNP genotyping for pharmacogenomics and drug discovery Biotechniques 30: S70–77
13.Hacia JG, Sun B, Hunt N, Edgemon K, Mosbrook D, Robbins C et al. (1998)
Strategies for mutational analysis of the large multiexon ATM gene using highdensity oligonucleotide arrays Genome Res 8: 1245–1258
14.Cho RJ, Mindrinos M, Richards DR, Sapolsky RJ, Anderson M, Drenkard E et al. (1999) Genome-wide mapping with biallelic markers in Arabidopsis thaliana
Nat Genet 23: 203–207
15.Fotin AV, Drobyshev AL, Proudnikov DY, Perov AN and Mirzabekov AD (1998) Parallel thermodynamic analysis of duplexes on oligodeoxyribonucleotide microchips Nucleic Acids Res 26: 1515–1521
16.Radtkey R, Feng L, Muralhidar M, Duhon M, Canter D, DiPierro D et al. (2000)
Rapid, high fidelity analysis of simple sequence repeats on an electronically active DNA microchip Nucleic Acids Res 28: E17
17.Ross PL, Lee K and Belgrader P (1997) Discrimination of single-nucleotide polymorphisms in human DNA using peptide nucleic acid probes detected by MALDI-TOF mass spectrometry Anal Chem 69: 4197–4202
18.Orum H, Jakobsen MH, Koch T, Vuust J and Borre MB (1999) Detection of the factor V Leiden mutation by direct allele-specific hybridization of PCR amplicons to photoimmobilized locked nucleic acids Clin Chem 45: 1898–1905
19.Landegren U, Kaiser R, Sanders J and Hood L (1988) A ligase-mediated gene detection technique Science 241: 1077–1080
10 Analysis of DNA Sequence Variation in the Microarray Format |
225 |
20.Lizardi PM, Huang X, Zhu Z, Bray-Ward P, Thomas DC and Ward DC (1998)
Mutation detection and single-molecule counting using isothermal rolling-circle amplification Nat Genet 19: 225–232
21.Broude NE, Woodward K, Cavallo R, Cantor CR and Englert D (2001) DNA microarrays with stem-loop DNA probes: preparation and applications Nucleic Acids Res 29: E92
22.Gerry NP, Witowski NE, Day J, Hammer RP, Barany G and Barany F (1999)
Universal DNA microarray method for multiplex detection of low abundance point mutations J Mol Biol 292: 251–262
23.Iannone MA, Taylor JD, Chen J, Li MS, Rivers P, Slentz-Kesler KA et al. (2000) Multiplexed single nucleotide polymorphism genotyping by oligonucleotide ligation and flow cytometry Cytometry 39: 131–140
24.Nilsson M, Malmgren H, Samiotaki M, Kwiatkowski M, Chowdhary BP and Landegren U (1994) Padlock probes: circularizing oligonucleotides for localized DNA detection Science 265: 2085–2088
25.Hardenbol P, Baner J, Jain M, Nilsson M, Namsaraev EA, Karlin-Neumann GA et al. (2003) Multiplexed genotyping with sequence-tagged molecular inversion probes Nat Biotechnol 21: 673–678
26.Oliphant A, Barker DL, Stuelpnagel JR and Chee MS (2002) BeadArray technology: enabling an accurate, cost-e ective approach to high-throughput genotyping
Biotechniques Suppl: 56–58, 60–51
27.Syvanen AC, Aalto-Setala K, Harju L, Kontula K and Soderlund H (1990) A primer-guided nucleotide incorporation assay in the genotyping of apolipoprotein E Genomics 8: 684–692
28.Syvanen AC (1999) From gels to chips:”minisequencing”; primer extension for analysis of point mutations and single nucleotide polymorphisms Hum Mutat 13: 1–10
29.Pastinen T, Kurg A, Metspalu A, Peltonen L and Syvanen AC (1997) Minisequencing: a specific tool for DNA analysis and diagnostics on oligonucleotide arrays Genome Res 7: 606–614
30.Fortina P, Delgrosso K, Sakazume T, Santacroce R, Moutereau S, Su HJ et al. (2000) Simple two-color array-based approach for mutation detection Eur J Hum Genet 8: 884–894
31.Kurg A, Tonisson N, Georgiou I, Shumaker J, Tollett J and Metspalu A (2000)
Arrayed primer extension: solid-phase four-color DNA resequencing and mutation detection technology Genet Test 4: 1–7
32.Lindroos K, Liljedahl U, Raitio M and Syvanen AC (2001) Minisequencing on oligonucleotide microarrays: comparison of immobilisation chemistries Nucleic Acids Res 29: e69
33.Raitio M, Lindroos K, Laukkanen M, Pastinen T, Sistonen P, Sajantila A et al. (2001) Y-chromosomal SNPs in Finno-Ugric-speaking populations analyzed by minisequencing on microarrays Genome Res 11: 471–482
34.Pastinen T, Perola M, Ignatius J, Sabatti C, Tainola P, Levander M et al. (2001)
Dissecting a population genome for targeted screening of disease mutations Hum Mol Genet 10: 2961–2972
35.O’Meara D, Ahmadian A, Odeberg J and Lundeberg J (2002) SNP typing by apyrasemediated allele-specific primer extension on DNA microarrays Nucleic Acids Res 30: e75
226 Ulrika Liljedahl et al.
36.Cai H, White PS, Torney D, Deshpande A, Wang Z, Marrone B et al. (2000)
Flow cytometry-based minisequencing: a new platform for high-throughput single-nucleotide polymorphism scoring Genomics 66: 135–143
37.Chen J, Iannone MA, Li MS, Taylor JD, Rivers P, Nelsen AJ et al. (2000) A microsphere-based assay for multiplexed single nucleotide polymorphism analysis using single base chain extension Genome Res 10: 549–557
38.Hirschhorn JN, Sklar P, Lindblad-Toh K, Lim YM, Ruiz-Gutierrez M, Bolk S et al. (2000) SBE-TAGS: an array-based method for e cient single-nucleotide polymorphism genotyping Proc Natl Acad Sci U S A 97: 12164–12169
39.Fan JB, Chen X, Halushka MK, Berno A, Huang X, Ryder T et al. (2000)
Parallel genotyping of human SNPs using generic high-density oligonucleotide tag arrays Genome Res 10: 853–860
40.Pease AC, Solas D, Sullivan EJ, Cronin MT, Holmes CP and Fodor SP (1994)
Light-generated oligonucleotide arrays for rapid DNA sequence analysis Proc Natl Acad Sci U S A 91: 5022–5026
41.Kwiatkowski M, Fredriksson S, Isaksson A, Nilsson M and Landegren U (1999)
Inversion of in situ synthesized oligonucleotides: improved reagents for hybridization and primer extension in DNA microarrays Nucleic Acids Res 27: 4710–4714
42.Beier M and Hoheisel JD (2002) Analysis of DNA-microarrays produced by inverse in situ oligonucleotide synthesis J Biotechnol 94: 15–22
43.Guo Z, Guilfoyle RA, Thiel AJ, Wang R and Smith LM (1994) Direct fluorescence analysis of genetic polymorphisms by hybridization with oligonucleotide arrays on glass supports Nucleic Acids Res 22: 5456–5465
44.Beier M and Hoheisel JD (1999) Versatile derivatisation of solid support media for covalent bonding on DNA-microchips Nucleic Acids Res 27: 1970–1977
45.Dolan PL, Wu Y, Ista LK, Metzenberg RL, Nelson MA and Lopez GP (2001)
Robust and e cient synthetic method for forming DNA microarrays Nucleic Acids Res 29: E107–107
46.Rogers YH, Jiang-Baucom P, Huang ZJ, Bogdanov V, Anderson S and BoyceJacino MT (1999) Immobilization of oligonucleotides onto a glass support via disulfide bonds: A method for preparation of DNA microarrays Anal Biochem 266: 23–30
47.Chee M, Yang R, Hubbell E, Berno A, Huang XC, Stern D et al. (1996) Accessing genetic information with high-density DNA arrays Science 274: 610–614
48.Tonisson N, Zernant J, Kurg A, Pavel H, Slavin G, Roomere H et al. (2002)
Evaluating the arrayed primer extension resequencing assay of TP53 tumor suppressor gene Proc Natl Acad Sci U S A 99: 5503–5508
49.Southern EM, Maskos U and Elder JK (1992) Analyzing and comparing nucleic acid sequences by hybridization to arrays of oligonucleotides: evaluation using experimental models Genomics 13: 1008–1017
50.Cronin MT, Fucini RV, Kim SM, Masino RS, Wespi RM and Miyada CG (1996)
Cystic fibrosis mutation detection by hybridization to light-generated DNA probe arrays Hum Mutat 7: 244–255
51.Pastinen T, Perola M, Niini P, Terwilliger J, Salomaa V, Vartiainen E et al. (1998) Array-based multiplex analysis of candidate genes reveals two independent and additive genetic risk factors for myocardial infarction in the Finnish population Hum Mol Genet 7: 1453–1462
52.Wang DG, Fan JB, Siao CJ, Berno A, Young P, Sapolsky R et al. (1998) Largescale identification, mapping, and genotyping of single-nucleotide polymorphisms in the human genome Science 280: 1077–1082
10 Analysis of DNA Sequence Variation in the Microarray Format |
227 |
53.Hacia JG, Fan JB, Ryder O, Jin L, Edgemon K, Ghandour G et al. (1999)
Determination of ancestral alleles for human single-nucleotide polymorphisms using high-density oligonucleotide arrays Nat Genet 22: 164–167
54.LaForge KS, Shick V, Spangler R, Proudnikov D, Yuferov V, Lysov Y et al. (2000) Detection of single nucleotide polymorphisms of the human mu opioid receptor gene by hybridization or single nucleotide extension on custom oligonucleotide gelpad microchips: potential in studies of addiction Am J Med Genet
96:604–615
55.Dawson E, Abecasis GR, Bumpstead S, Chen Y, Hunt S, Beare DM et al. (2002)
A first-generation linkage disequilibrium map of human chromosome 22 Nature
418:544–548
56.Primdahl H, Wikman FP, von der Maase H, Zhou XG, Wolf H and Orntoft TF (2002) Allelic imbalances in human bladder cancer: genome-wide detection with high-density single-nucleotide polymorphism arrays J Natl Cancer Inst 94: 216–223

11
High Sensitivity Expression Profiling
Ramesh Ramakrishnan, Paul Bao, and Uwe R. M¨uller
11.1 Introduction
DNA microarrays were originally conceived to provide a new means for rapid sequence analysis [1–3] but it was soon recognized that they presented a powerful new tool to determine the relative transcript abundance of multiple genes [4, 5]. Expression microarrays have been shown to provide valuable insights in the areas of target discovery [6], mechanism of drug action [7–9], genes and pathways involved in various cellular responses and pathophysiologies [10–12], exon mapping [13], chemosensitivity [14, 15] and tumor classification [16, 17]. Clinically, expression microarrays have been used in studies utilizing gene expression signatures to distinguish primary breast cancers from multifocal disease [18] and to predict disease outcome, surpassing currently used clinical and histopathological methods [19–22].
The probes used for expression array fabrication can be made from clones of genes, PCR amplicons, or oligonucleotides [6, 23–26], and various methods for their attachment and linkage to the array surface have emerged (Chaps. 2 and 3). While cDNA probes and PCR amplicons are typically arrayed in a bu er that contains both strands, oligonucleotide probes are single-stranded and complementary to the mRNA or cDNA target sequences, respectively.
The primary target for expression analysis is mRNA, but it is typically converted to cDNA prior to use for two reasons: first, DNA is much more stable and therefore more easily handled and stored; second cDNA synthesis provides a convenient method to produce labelled targets by incorporation of fluorescent or hapten labelled nucleotides during the reverse transcription reaction. When the target material is limiting, various methods can be employed to either enhance the signal, or to amplify the mRNA (see below). As reviewed in Chap. 8, the standard labelling system consists in direct incorporation of fluorescent nucleotides using a two color labelling scheme, but indirect labelling via incorporation of haptens provides for alternate and potentially higher sensitivity detection schemes (Chap. 8 and below). The type of labels used and the exact conditions for labelling and hybridization are crit-
230 Ramesh Ramakrishnan et al.
ically important and have a profound impact on the sensitivity of the system. For most slide based arrays, hybridization is carried out under a coverslip in a humidity chamber, followed by washing and staining, if indirect labelling systems are used. However, for enhanced hybridization rates and more consistent performance, automated hybridization chambers and complete hybridization systems have been developed.
Although all array based expression systems are based on a determination of relative transcript abundance by comparing the copy number in a specific sample to that in a reference, there are two di erent approaches involving either labelling both samples with the same ‘color’ and hybridizing to separate arrays, or labelling both samples with di erent ‘colors’, and hybridizing them competitively to the same array. The latter was first pioneered by Kallioniemi et al. by comparing genomic DNA from di erent sources [27]. The advantage is that di erences between the two arrays that can a ect either the hybridization (e.g. spot morphologies, probe amounts) or the detection (e.g. shading) are eliminated, typically resulting in improved CVs (coe cients of variation) for color ratios as compared to the CVs of raw hybridization signals [24]. However, the two color approach also has disadvantages including varying incorporation rates of di erent fluorophors, the need for more reference sample in multiple experiments, spectral overlap between dyes, more expensive imaging systems, and, in case of multiple haptens, more complex signal amplification protocols.
Many methods for improvements and optimizations have emerged during the past decade, most, of course, to improve manufacturability, specificity and/or sensitivity. This is where some significant di erences in the type of probe used for manufacturing the array have appeared. In fact, while most data suggest that equivalent results are obtained between oligo and cDNA arrays [24, 25, 28], some data suggest otherwise [29, 30].
Because oligo and cDNA arrays each have a set of advantages and disadvantages, we have combined our experiences to describe in this chapter high sensitivity expression systems achieved with either format, using as examples the Motorola CodeLinkTM (now Amersham CodeLinkTM) oligonucleotide array and the Corning CMTTM cDNA-based expression arrays (no longer commercially available, but see Chap. 5).
11.2 Oligonucleotide Expression Arrays
11.2.1 Array Design
The use of oligonucleotides instead of clones or PCR amplified DNA sequences as probes for expression arrays has significant advantages since they can be designed to hybridize specifically to any gene in the sample, provided sequence information is available. The ease with which oligonucleotides can be synthesized reduces complexity in the manufacturing and quality control areas, since it eliminates the need for clone tracking and handling, PCR amplification and
11 High Sensitivity Expression Profiling |
231 |
sequence verification. Further, the specificity associated with oligonucleotide arrays enables the study and analysis of splice variants [31] and the ability to di erentiate closely related members of gene families.
Typical arrays fabricated with oligo probes of 20–30 nucleotides in length have sensitivity limitations, but this limitation can be minimized by extending the length to 50 bases or more [25]. However, depending on the method of array fabrication, this may result in other disadvantages. For example, for in situ synthesis [32–34] the lower coupling e ciencies on the array can limit purity with significant impact on specificity and sensitivity. This typically limits the probe length to about 25 bases. In addition, in situ synthesis does not allow an independent confirmation of the fidelity of synthesis. On the other hand, synthesis of oligonucleotides prior to deposition on the array incurs a significant cost not just in synthesis, but also in purification and sequence confirmation, which increases proportionally with oligo size. In addition, this approach requires covalent attachment of the oligos to the array surface. However, several innovative solutions in chemistry and systems engineering have been proposed to address these obstacles [35, 36].
Covalent attachment of prefabricated oligonucleotides circumvents some of the constraints imposed by earlier in situ synthesis methods and allows new elements to be added without redesigning the entire microarray. The emphasis here shifts to the ability to reproducibly attach probes. One approach includes fabrication of arrays by photochemical as well as chemical attachment [37]. Incorporation of specific functional moieties at the 5 end of oligonucleotides can serve as a pseudo–purification step. Since only full-length oligonucleotides will receive the attachment group and attach to the matrix e ciently, nonspecific adsorption of the oligonucleotide can be virtually eliminated.
Longer oligonucleotides (60–mer to 70–mer) exhibit chemical characteristics similar to cDNAs in that they can be attached directly (non-covalently) to slide surfaces without the need for any specialized attachment chemistry. However, for maximum attachment, a UV–crosslinking step is advisable and improves sensitivity (personal observations), though probes retained on a glass surface in this manner may not exhibit the same degree of conformational flexibility or accessibility as do those retained via end attachment [38]. Alternatively, oligonucleotides can be modified by incorporation of biotin or haptens at either end, and they can then be anchored e ciently on surfaces coated with streptavidin or anti-hapten antibodes, respectively. The disadvantage of such an attachment scheme is that the biological interaction must remain intact throughout the assay, imposing constraints upon subsequent hybridization and array processing.
For applications in expression analysis, the oligonucleotide probes are generally designed towards the 3 end of a RNA transcript, primarily to reduce the e ects of transcript degradation [26]. Probe design is also guided by priming and amplification schemes (random hexamer versus oligo–dT), which impact the regions of the transcript represented in the cDNA or cRNA sample. Although a set of heuristics has been proposed for probe design [39], there is
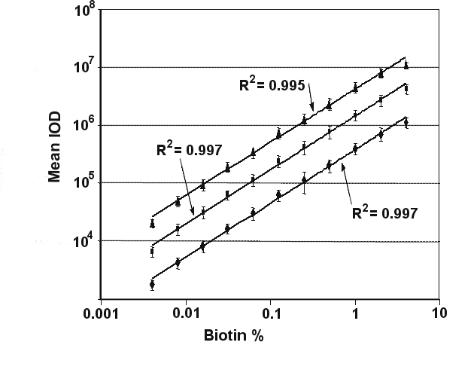
232 Ramesh Ramakrishnan et al.
as yet no definitive algorithm that can select a set of hundreds of probe sequences with maximum hybridization e ciency under isothermal conditions. In order to tackle this problem, rapid probe prototyping as well as the use of multiple probes per transcript in expression arrays o er a pragmatic solution. Basic studies on heteroduplex formation as it pertains to microarrays are now underway [40] and analogies to antisense oligonucleotides (whose e cacy depends on hybridization and transcript cleavage) may provide better solutions in the future [41].
Given that k2, the second order rate constant for hybridization, is proportional to the square root of the length of the shortest strand participating in duplex formation [42], it is not surprising that larger oligonucleotides show improved hybridization kinetics. A recent study has demonstrated the utility of 60–mer fabricated in situ for expression analysis and has shown good sensitivity under various hybridization conditions. However, two 60–mer have to di er by at least 18 nucleotides in order to achieve su cient specificity, though this depends very much on the exact location of each mismatch and the relative content of deoxycytidine in the oligo sequence [24]. It appears
Fig. 11.1. The biotinylated probe chip: linearity of the detection process. Slides were processed with streptavidin–alexa 647 and scanned at PMT voltages of 500 (diamonds, R2 = 0.997), 600 (squares, R2 = 0.997), and 700 (triangles, R2 = 0.995). Each data point represents the average of sixteen replicates per slide
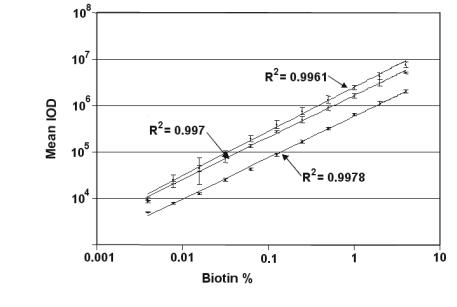
11 High Sensitivity Expression Profiling |
233 |
Fig. 11.2. Slides were processed with Streptavidin–Alexa 647 (R2 = 0.9961), Strepta–vidin–Cy3 (R2 = 0.997), or Streptavidin–phycoerythrin (R2 = 0.9978) and scanned at a PMT voltage of 600. IOD = integrated optical density
now that most manufacturers prepare 30 to 75–mer oligonucleotide arrays for expression applications.
Labelling of cDNA and cRNA can be done by several methods, as discussed below, but for the development of the Motorola CodeLinkTMarray system an indirect labelling system was chosen. The reason is that biotin incorporation has many advantages to direct labelling, including the fact that biotin-labelled nucleotides are e cient substrates for many DNA and RNA polymerases, resulting in better yields than incorporation of cyanine dyes (unpublished observations). Moreover, cDNAs or cRNAs containing biotinylated nucleotides have denaturation, reassociation, and hybridization parameters similar to those of their unlabelled counter–parts [43].
In order to test the biotin labelling system, the biotinylated probe chip was developed by the Motorola group as an analytical tool to monitor the linearity, variability, and sensitivity of the detection process [44]. This chip contains unlabelled oligonucleotide probes mixed with biotinylated probes of the same length in increasing ratios ranging from 0.000122% to 4%, with the final probe concentration per spot kept constant. This enables the assessment of fluorescence detection independent of hybridization, since the presence of biotinylated probes can be simply monitored using Streptavidin–Alexa 647. As shown in Fig. 11.1, the dose response of Streptavidin–Alexa 647 binding is linear (R2 > 0.99) for three logs of biotinylated probe concentrations (0.004% to 4%), without observing saturation, and with very low variability. Further-
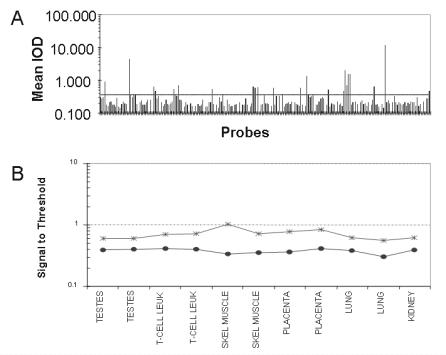
234 Ramesh Ramakrishnan et al.
more, the ability to detect even very low probe concentrations suggests that this detection method may be su ciently sensitive to detect low expressers.
Since a variety of indirect detection methods are used in current commercial products [26, 45], the performance of streptavidin–Alexa 647 was compared to streptavidin–Cy3 and streptavidin–phycoerythrin on these biotin chips. Excellent linearity was found for all these methods, although the signal intensities were lower with streptavidin–phycoerythrin with the protocols and slides used (Fig. 11.2). Based on these findings, a single-color approach based on streptavidin–Alexa 647 was subsequently employed in the CodeLinkTM assay system.
Fig. 11.3. Threshold determination. The negative control threshold can be used to define the lower limits of detection. (a) Graph shows mean IOD for negative control probes used to calculate the threshold. Each slide has 216 negative control probes (54 probes in 4× redundancy). Threshold was calculated using 20% trimmed mean for each slide (10% of the highest signals and 10% of the lowest signals were removed from the probes population) and the remaining probes were used to calculate the threshold. 9.44% of the untrimmed population of the negative control probes is above the threshold. The line indicates the threshold as calculated by the mean and three standard deviations. (b) The negative control values are constant in six di erent samples. The mean (asterisks) and median (circles) negative control values were calculated from six tissues (each tissue was hybridized in duplicate)
11 High Sensitivity Expression Profiling |
235 |
11.2.2 Use of a Threshold to Define Lower Limits of Detection and Nonspecific Binding
Specificity during and after the hybridization reaction can be monitored e - ciently through the use of negative controls, i.e. probes which do not cross– hybridize to the complex message for which the array was designed. For the CodeLinkTM product a negative control probe set was developed, consisting of approximately 55 bacterial sequences that were designed, FASTA verified, and empirically shown not to cross–hybridize to human transcripts. The threshold was determined by calculating the mean negative control value and adding three standard deviations (99.7% confidence). An example is shown in Fig. 11.3a using in vitro synthesized complementary RNA (cRNA) from human liver as target, where 9.44% of the untrimmed population of the negative control probes were found to be above the threshold. Using 6 di erent tissues in multiple hybridizations, it was shown that the same set of probes was trimmed each time by this process, pointing to some of the potential shortcomings in either oligo design or sequence accuracy. Nevertheless, the data indicate that, if used appropriately, this set of bacterial probes can be universally applied to indicate the cross–hybridization threshold since the mean and median signal intensities do not change significantly between a variety of tissues (Fig. 11.3b).
11.2.3 Sensitivity Measurements Using Oligonucleotide Arrays
One of the most common methods to evaluate sensitivity of an oligonucleotidebased expression microarray is the use of spiking experiments with exogenous bacterial transcripts that are complementary to a set of positive control probes on the array. These elements would have to be di erent from those which serve as the negative control elements and which are used to generate the negative control threshold. Results from a representative experiment are shown in Fig. 11.4, where defined amounts of 6 di erent in situ synthesized transcripts were spiked into the complex human message prior to reverse transcription and labelling. After hybridization, the fluorescence was determined at the cognate bacterial probe spots and plotted against the mass of spiked transcript. Each array contains 3 di erent probes per bacterial control gene, and each probe is represented 4 times across the slide. Figure 11.4 shows the data for one of the six transcripts (araB ) for each of the 3 di erent probe spots. The amount of mRNA used for spiking was chosen to represent a mass ratio ranging from 1:6,000 to 1:6,000,000 spiked mRNA:total RNA. Assuming that 5% of the total RNA population is polyA+ RNA [25], this is equivalent to a mass ratio range of 1:300 to 1:300,000 spiked mRNA to polyA+ RNA. As expected, di erent probes show di erent signal to threshold ratios (due to di erent a nities) at the same spike level. However, all probes displayed a signal above threshold at the 1:300,000 spike level. This is equivalent to 1 copy per cell according to [45–47], and exceeds that sensitivity according
236 Ramesh Ramakrishnan et al.
Fig. 11.4. Sensitivity and dynamic range. Nine exogenous bacterial transcripts were spiked into the complex mRNA from human liver, each at increasing concentrations (bacterial RNA: total human liver RNA as 1:6,000; 1:20,000; 1:60,000; 1:600,000; 1:3,000,000; 1:6,000,000. The signal: threshold ratio was determined by dividing the fluorescence for each bacterial positive control probe by the negative control threshold. The data for the araB transcripts is shown, with three bacterial control probes designed to hybridize to each transcript
to [24, 48]. On further diluting target to achieve a mass ratio of 1:15,000,000 of transcript per 5 g of total RNA (Fig. 11.5), the signal–to–threshold ratios of the araB probes were still found to be significantly above background.
The relative intensity values obtained in these spiking experiments can be used to normalize and compare the results of di erent arrays. For that purpose the signal intensity is divided by the negative control threshold previously described.
By spiking at increasing mass ratios, it was possible to determine not only the absolute sensitivity but also the dynamic range of the assays. A linear transcript concentration-dependent dose response was obtained over two orders of magnitude reaching a signal saturation near the highest spike concentration (equivalent to a 1:300 mass ratio). Similar data were obtained for the other bacterial probes and transcripts (not shown).
Once a target is present in the hybridization reaction, its ability to be captured by the microarray is a function of the hybridization e ciency, which in many cases is limited by two–dimensional and three–dimensional di u- sion [49]. In order to enhance passive di usion, the cRNA was already frag-
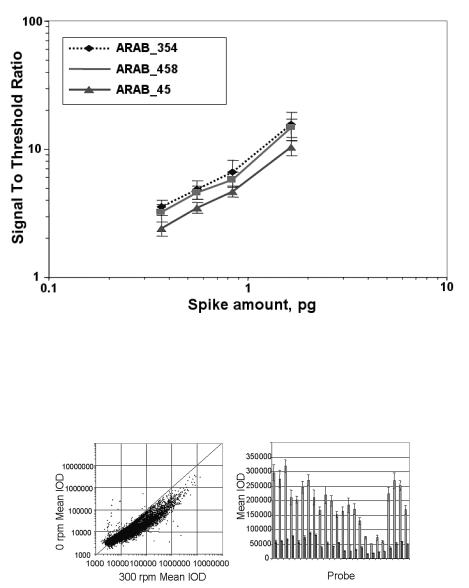
11 High Sensitivity Expression Profiling |
237 |
Fig. 11.5. Sensitivity and dynamic range extended. Exogenous bacterial transcripts to the araB gene were spiked into the complex mRNA from human liver, at increasing concentrations (bacterial RNA: total human liver RNA as 1:3,000,000, 1:6,000,000, 1:9,000,000, and 1:15,000,000. The signal: threshold ratio was determined by dividing the fluorescence for each bacterial positive control probe by the negative control threshold. Three bacterial control probes were designed to hybridize to each transcript
Fig. 11.6. The e ect of mixing during hybridization. (a) The average signal intensities with (x axis) and without (y axis) mixing were plotted for all probes ( 9300). The bowing shows the enhanced signal intensities with mixing. (b) Signal intensities from 24 positive bacterial control probes (x axis) when their complementary transcripts were spiked into the total RNA at a mass ratio of 1:2,000,000. The first bar in each pair represents the signal intensity obtained with mixing and the second bar in each pair represents the signal intensity obtained without mixing
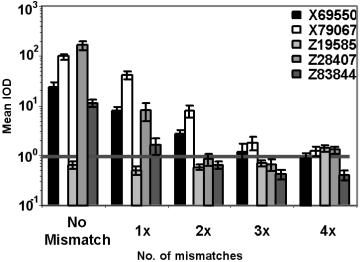
238 Ramesh Ramakrishnan et al.
mented before adding to the hybridization reaction. To examine the e ect of di usion limitation, an experiment was performed to demonstrate the e ect of vigorous shaking and mixing during the hybridization. Figure 11.6a shows an average 3.1 ± 5.6 fold increase in signal intensity along the entire signal range for 9500 probes when mixing was employed. Figure 11.6b shows the increase in signal intensity due to mixing for 24 positive bacterial control probes (x axis) when their complementary transcripts were spiked into the total RNA at a mass ratio of 1:2,000,000. An average increase of 4.2 ± 1.4 was found.
11.2.4 Specificity of Oligonucleotide Arrays
The specificity of this oligo array hybridization platform was examined by introducing one or more mismatches in the center of each of five di erent oligonucleotide probes, each designed to hybridize to di erent human transcripts. One (1×), two (2×), three (3×), or four (4×) adjacent mismatches were introduced into the middle of a probe and the fluorescence associated with the perfect match was compared with that of each type of mismatch. Figure 11.7 shows the data obtained after hybridization with human liver cRNA. Each probe was represented four times per array, with the red horizontal line representing the threshold fluorescence as defined above. As expected, each
Fig. 11.7. Specificity of the CodeLinkTM Expression Bioarray platform. Specificity was determined by introducing one (1×), two (2×), three (3×), or four (4×) adjacent mismatches into the middle of a probe and determining fluorescence associated with the perfect match (no mismatch) and each of its mismatch probes. This analysis was performed for five probe sets after hybridization with cRNA generated from human liver total RNA. Each mismatch probe has four repeats across the slide. The line represents threshold
11 High Sensitivity Expression Profiling |
239 |
probe type within a set gave significantly di erent signal intensities (IOD), demonstrating the e ect of probe sequence on hybridization e ciency. In fact, one of these probes (Z19585) did not give a signal above threshold and was eliminated from the analysis. However, the variability between the 4 repeats of the same probe was minimal, as indicated by the relatively small standard deviations. Analysis of the mismatched probes revealed that their signal was reduced. Though each of the 4 hybridization competent single (1×) mismatch probes gave signals above background, their signals were reduced by a factor ranging from about 2 to 22 fold, presumably due to the e ects of flanking sequences. Two of the 2× and 3× mismatch probes, respectively, also gave signals at or above threshold, but with significant further reductions. Similar results have been obtained with cRNA target generated from other tissues such as human skeletal muscle and placenta. Since the oligos used here were 30 nucleotides long, these data suggest that under the appropriate conditions and with optimum oligo sequence design, 5% sequence variations can be distinguished. This ability to distinguish a small number of mismatches between highly homologous genes or exons provides an important advantage over cDNA and 60–mer oligonucleotide arrays.
11.2.5 Validation of Relative Transcript Levels
with Real Time Quantitative Reverse Transcription PCR Assays
As a preliminary validation that the oligo array platform generated precise but also accurate answers, di erential expression ratios from this platform were compared to those obtained using quantitative reverse transcription PCR (Taqman) assays for a set of 54 genes, using the same RNA sample as target source. Although the actual sequence of the oligonucleotide on the array was not identical to that of the Taqman probe, in the majority of cases the probes did overlap. For the entire data set of 54 genes, there was a good correlation (correlation coe cient of 0.76) between the changes reported by each system (Fig. 11.8).
11.3 cDNA-based Expression Arrays
11.3.1 Array Design and Manufacture
Most of the advantages and disadvantages of oligo versus cDNA arrays have already been discussed above and only a few points will be highlighted here. The development of microarrays using PCR amplified cDNAs as probes was enabled by the availability of a significant number of known genes in cloned format from several sources. Most of these were derived either as partial or full-length clones or expressed sequence tags (EST) by reverse transcription from mRNA, but they can also be cloned directly from the genome [50]. Either way, confirmation of clone purity and sequence integrity is critical and
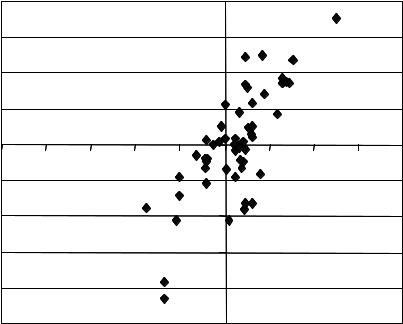
240 Ramesh Ramakrishnan et al.
8.00
|
|
|
|
|
|
|
|
|
|
|
|
|
|
|
|
|
|
|
|
|
|
|
|
|
|
|
|
|
|
|
|
|
|
|
|
|
|
|
|
|
|
|
|
|
6.00 |
|
|
|
|
|
|
|
|
|
4.00 |
|
|
|
|
|
|
|
|
|
2.00 |
|
|
|
|
|
|
|
|
|
0.00 |
|
|
|
|
-10 |
-8 |
|
-6 |
-4 |
-2 -2.00 0 |
2 |
4 |
6 |
8 |
|
|
|
|
|
-4.00 |
|
|
|
|
|
|
|
|
|
-6.00 |
|
|
|
|
|
|
|
|
|
-8.00 |
|
|
|
|
|
|
|
|
|
-10.00 |
|
|
|
|
|
|
|
|
|
|
|
|
|
Fig. 11.8. Correlation of di erential expression ratios with Taqman. The log2 of the di erential expression ratio obtained with Taqman when heart and brain were compared was plotted on the y-axis versus the log2 of the ratio obtained with the CodeLinkTM Expression Bioarray platform using the same RNAs on the x-axis. The correlation coe cient (R = 0.76) was based on all 54 genes
presents a major cost in the manufacturing process for commercial manufacturers. Equally important are the choice of the array support and the attachment chemistry, as they can have a significant impact on array performance (see also Chaps. 2 and 3). First, the density and conformation of the probe will a ect the hybridization kinetics, and while for oligos some of these parameters have been defined [51], there is limited information available for cDNA arrays. Instead, the optimum probe concentration in the printing solution has typically been determined empirically [52], and in our hands printing of double-stranded PCR products at a concentration of 0.25 g/ l (50% DMSO, 50 mM citrate bu er) resulted in arrays with good sensitivity and dynamic range, as discussed below (see also Chap. 5). A second reason for carefully choosing the right surface is the signal enhancements that can be achieved either through optical e ects [53–55] or better hybridization kinetics as a result of a 3D or flow–through chip [56–58]. But perhaps most important is the use of a surface designed for minimum non-specific target binding and mini-
11 High Sensitivity Expression Profiling |
241 |
mum autofluorescence (if fluorescently labelled target is used). It was shown by Shena et al. that reducing slide background through modification of the attachment chemistry can improve the sensitivity by a factor of 10 [5]. However, we have noticed that adsorption of organic molecules from the environment upon storage of arrays can dramatically increase autofluorescence and render them useless. In many cases treatment of the array with sodium borohydride before hybridization can o er an easy remedy [59]. This process will do little to improve the autofluorescence of the glass itself, unless the glass has been treated to adsorb or reflect any unwanted photons from within or the underside of the slide [53]. In order to insure that the array has a minimum of background autofluorescence, we recommend using a high quality glass substrate (e.g. GAPSTMslides, Corning) and scanning all arrays at a high voltage setting prior to use. Assuming that a quality array (for a description of quality parameters see [52]) has been fabricated, the tasks turn to target preparation and labelling.
11.3.2 Target Preparation and Labelling
Many studies have focused on the preparation and labelling of cDNA from either total RNA or isolated poly(A)+ mRNA, since the e ect of target concentration, label type and density on sensitivity is obvious. However, there are various definitions and descriptions of sensitivity. Given the variety of arrays, labels and detection modes, the reported amounts of non-amplified target required per hybridization varies up to 100–fold between di erent publications, ranging from a few to more than 100 g total RNA [60, 61] or 200 ng to a fewg of purified poly (A)+ mRNA [52,62]. A better way to express sensitivity is to define the minimum amount of a specific target needed per hybridization to give a detectable signal over noise, as originally described by Schena et al. [4]. This can be accomplished by spiking specific amounts of one or more types of a synthetic mRNA into the target RNA before reverse transcription as described above for oligo arrays. By these criteria, arrays with longer probes (cDNA or > 50–mer oligos) have been shown to be more sensitive than short oligo arrays (25–mer) [63], which is not unexpected. Without any target or signal amplification, the sensitivities for cDNA arrays have been reported to be around 2 pg (0.006 fmol) of a unique Cy3 or Cy5 labelled mRNA per spot and per hybridization [52] compared to 20 pg ( 0.06 fmol) for 60–mer oligos [24, 63], and ≥ 0.3 fmol for 30–mer oligo arrays [63]. However, Cy5 is typically somewhat less sensitive [63, 64].
Assuming approximately 10 pg total RNA [60, 65] and 100,000 transcripts per eukaryotic cell [24], mRNA represents approximately 0.5% of the total RNA. Thus, based on the above cited sensitivity limits detection of 1 copy of a given transcript per cell would require on the order of 40 g of total RNA or 200 ng purified mRNA. Since for many applications, such as fine-needle aspirates, this much material can not be obtained, signal or target amplification procedures may o er a suitable solution. Incorporation of biotinylated
242 Ramesh Ramakrishnan et al.
nucleotides during the RT step, followed by fluorescently labelled streptavidin is commonly used, as described above. E cient incorporation of aminated random primers and/or aminoallyl nucleotides during cDNA synthesis, and subsequent chemical conversion of the primary amine groups to fluorescent moieties has provided > 10 fold improvements in signal strength [66] and reduced the required amount of material to as little as 1 g total RNA [67].
Better amplification can be achieved by incorporating a T7 primer during the cDNA synthesis, followed by transcription using the cDNA as template [68,69]. The resulting amplification is linear, reaching amplification levels of several orders of magnitude without significant distortion of transcript ratios [68, 70, 71]. Our own data suggest a 5800 fold amplification, starting with the total RNA from as few as 10,000 HepG2 cells ( 11 pg/cell) and resulting in 312 pg/cell of aRNA (assuming 0.5% of total RNA is mRNA) [72]. An even more powerful target amplification can be achieved by combining reverse transcription with PCR allowing expression analysis of single cells [73]. However, the non-linear PCR step may distort the transcript ratios [74].
11.3.3 Hybridization and Detection
Clearly, any target or signal amplification procedures add some complexity to the assay process, and a high sensitivity 2-color assay format with a simple reverse transcription reaction and direct incorporation of label is very desirable. We have developed a protocol that allows detection of single copy mRNAs starting with 2–5 g of total RNA (i.e. 500,000 human cells) without the need for any signal or target amplification. This was only possible because of the combination of quality slides and cDNA arrays, reduction of autofluorescence by treatment with sodium borohydride [59], and the optimized labelling and hybridization protocol shown in the Appendix. In fact, prior to discovering the benefits of the sodium borohydride treatment more than 10 times that amount of target was needed to get similar results with the same arrays [75].
When using this protocol to test various tissues on Corning CMTTM4K Cancer arrays (containing 2000 cancer related genes in duplicate) we typically found that virtually all genes represented on the array were expressed in the tissues analyzed. As shown in Fig. 11.9, more than 95% of the probe spots have a net Signal/Noise (S/N) ratio for Cy5 of 5 or larger (slide A), whereby this ratio for the negative control probes (bacterial genes) ranged between 1.4 and 1.8 (not shown). The Cy3 net S/N ratio is somewhat lower and 4% less genes are detectable. This is because of the di erences in the average background for these two fluorophore, which was on the order of 176 RFU for Cy5 and 383 RFU for Cy3 in our experimental set–up.
Of course, the amount of target hybridizing to the probe is not only a function of the target concentration, but also of solution stringency. By lowering the salt concentration from 2.25× SSC to 1.25× SSC (slide B), up to 20% fewer genes become detectable, depending on the net S/N ratio that one chooses
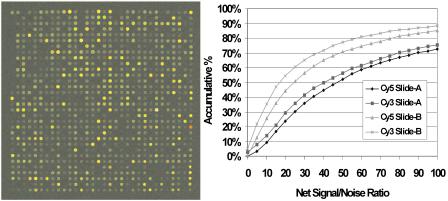
11 High Sensitivity Expression Profiling |
243 |
Fig. 11.9. Expression analysis of vitamin D3 treated MCF breast cancer cells. The image on the left shows one of 4 arrays comprising the 4K array after hybridizing a mixture of Cy3 labelled cDNA from untreated cells and Cy5 labelled cDNA from vitamin D3 treated cells (5 g each). The red spot in the last column reveals a 50-fold upregulation of the gene 24 Hydroxylase. The graph on the right shows the accumulative percentage of probe spots vs their Net Signal/Noise for two separate slides hybridized under di erent stringencies [779]. Slide A: 2.25× SSC; slide B: 1.25× SSC; Net Signal = total signal of a spot reduced by local background
for identifying a spot. Thus, it is critical to tune the hybridization conditions in order to achieve maximum sensitivity with minimum cross–hybridization. Since the negative control spots in our example show no significant target binding (net S/N 1), the lower stringency is adequate and allows detection of very low abundant transcripts. Of course, transcripts with significant sequence similarity can not be distinguished under these conditions, which is a previously mentioned drawback of cDNA arrays. It is therefore crucial to confirm expression results of a given array system with other methodologies for quantitation of mRNAs. The system we had chosen in this example was the comparison of vitamin D3 treated and untreated MCF breast cancer cells. These had been studied extensively by several laboratories and the 50–fold upregulation of the 24 Hydroxylase gene, for example, was expected. Several of the 70 genes that were found to be either upor down-regulated by our array analysis were then checked with real-time PCR, with generally good qualitative agreement between these techniques [76]. This in itself does not prove that the positive signals on all spots are real, especially for signals that are barely above background. If su cient arrays and sample are available, a dose response test can help to di erentiate between real and false positive signals, since net signal strength should scale with target concentration [75, 77]. Alternatively, one can boost the net S/N ratio by improving the hybridization kinetics. For most coverslip type hybridizations the reaction is di usion limited and can be improved 3–5 fold by actively moving the hybridization fluid, as shown above and also in several other reports [77,78]. This is particu-
244 Ramesh Ramakrishnan et al.
larly important if volume displacers are used, such as polydextrans [79], which increase the e ective target concentration but also the fluid viscosity [77].
Since at least 50% of the genes present in a genome are expected to be expressed at less than 1 copy per cell and most of the others are present in fewer than 10 copies, sensitivity will remain the key issue for this type of analysis. With a push toward smaller sample sizes and ideally single cell analysis, stochasticity in gene expression will become the ultimate limit [80], requiring multiplexing of samples and arrays to overcome these statistical hurdles. Finally, miniaturization and automation will provide some additional solutions, as discussed in Chaps. 6 and 7.
11.4 Appendix
Assay Protocol for Expression Microarrays The following protocol is based on methods worked out by the Biochemistry research group at Corning, Inc. [50, 59, 75–77] and includes recent improvements.
1.Reagents
•5× FSS bu er: 250 mM Tris–HCl, 375 mM KCl, 15 mM MgCl2
•dNTP mix: 10 mM each of dGTP, dATP, and dTTP, 1 mM of dCTP
•RevT solution: 8 l 5× FSS bu er, 4 l 0.1 M DTT, 2 l dNTP mix and 1 l of 1 mM dCTP–Cy3 or 1 mM dCTP–Cy5, and 2 l of reverse transcriptase
•Universal Hybridization Kit (Cat. No. 40026, Corning Incorporated), consisting in: Universal Wash Reagent A, Universal Wash Reagent B, Universal Pre-Soak Solution, Sodium Borohydride Pre-Soak Tablets, Universal Pre-Hybridization Solution, and Universal Hybridization Bu er
Wash Soln 1: 50 ml Wash Reagent A, 447.5 ml water, 2.5 ml Wash Reagent B
Wash Soln 2: 75 ml Wash Reagent A, 1425 ml water Wash Soln 3: 300 ml Wash Soln 2, 1200 ml water
2.Labelling of total human RNA
•mix 1–5 g of purified total human RNA, 3 g of random hexamers (1 ug/ul) and nuclease free water; final volume 23 l
•incubate for 5 minutes at 70◦C, quick chill on ice and spin down
•add 17 l of RevT solution, mix well and incubate for 2 hours, 42◦C
•add 1 l (2 U/ l) RNase H and 0.25 l RNase A (30 g/ l); incubate 15 minutes, 37◦C
•purify cDNAs with Qiagen’s PCR purification kit and reduce the volume by evaporation to about 5–8 l
3.Autofluorescence reduction and prewash:
•incubate slides in Universal Pre-Soak Solution with 1 tablet of NaBH4 at 42◦C, 20–30 minutes, then transfer successively to Wash Solution 2
11 High Sensitivity Expression Profiling |
245 |
(RT, 10 sec), Universal Pre-Hybridization Solution (42◦C, 15 minutes), Wash Solution 2 (RT, 1 minute), Wash Solution 3 (RT, 30 sec)
•dry slides by low speed spin (1000 rpm) at RT, 1 minute
4.Hybridization
•dissolve labelled cDNA in 60 l Universal Hybridization bu er
•denature the target mixture at 95◦C for 3 minutes, then spin for 20 sec at RT
•place onto the array, cover with 24 × 60 mm cover–slip (avoid bubbles!)
•incubate in a high humidity hybridization chamber at 42◦C, 14–20 hours
5.Post hybridization processing
•immerse slides in Wash Solution 1 (2 minutes), remove coverslip, then incubate for 5 minutes, all at 42◦C
•transfer slides successively to Wash Solution 1 (5 minutes, 42◦C), Wash Solution 2 (10 minutes, RT), wash solution 3 (2 minutes, RT), wash solution 3 (2 minutes, RT)
•dry slides by low speed spin (1000 rpm) for 1 minute at RT; store in the dark
References
1.Drmanac R, Drmanac S, Chui G, Diaz R, Hou A, Jin H, Jin P, Kwon S, Lacy S, Moeur B, Shafto J, Swanson D, Ukrainczyk T, Xu C, Little D. 2002. Sequencing by hybridization (SBH): advantages, achievements, and opportunities. Adv Biochem Eng Biotechnol 77:75–101
2.Khrapko KR, Lysov YuP, Khorlyn AA, Shick VV, Florentiev VL, Mirzabekov AD. 1989. An oligonucleotide hybridization approach to DNA sequencing. FEBS Lett 256:118–22
3.Lysov IuP, Florent’ev VL, Khorlin AA, Khrapko KR, Shik VV. 1988. Determination of the nucleotide sequence of DNA using hybridization with oligonucleotides. A new method. Dokl Akad Nauk SSSR 303:1508–11
4.Schena M, Shalon D, Davis RW, Brown PO. 1995. Quantitative monitoring of gene expression patterns with a complementary DNA microarray. Science 270:467–70
5.Schena M, Shalon D, Heller R, Chai A, Brown PO, Davis RW. 1996. Parallel human genome analysis: microarray–based expression monitoring of 1000 genes. Proc Natl Acad Sci USA 93:10614–9
6.Heller RA, Schena M, Chai A, Shalon D, Bedilion T, Gilmore J, Woolley DE, Davis RW. 1997. Discovery and analysis of inflammatory disease–related genes using cDNA microarrays. Proc Natl Acad Sci USA 94:2150–5
7.Huang P, Feng L, Oldham EA, Keating MJ, Plunkett W. 2000. Superoxide dismutase as a target for the selective killing of cancer cells. Nature 407:390–5
8.Lam LT, Pickeral OK, Peng AC, Rosenwald A, Hurt EM, Giltnane JM, Averett LM, Zhao H, Davis RE, Sathyamoorthy M, Wahl LM, Harris ED, Mikovits JA, Monks AP, Hollingshead MG, Sausville EA, Staudt LM. 2001. Genomic–scale measurement of mRNA turnover and the mechanisms of action of the anticancer drug flavopiridol. Genome Biol 2:RESEARCH0041
246 Ramesh Ramakrishnan et al.
9.Marton MJ, DeRisi JL, Bennett HA, Iyer VR, Meyer MR, Roberts CJ, Stoughton R, Burchard J, Slade D, Dai H, Bassett DE Jr, Hartwell LH, Brown PO, Friend SH. 1998. Drug target validation and identification of secondary drug target e ects using DNA microarrays. Nat Med 4:1293–301
10.Bittner M, Meltzer P, Chen Y, Jiang Y, Seftor E, Hendrix M, Radmacher M, Simon R, Yakhini Z, Ben-Dor A, Sampas N, Dougherty E, Wang E, Marincola F, Gooden C, Lueders J, Glatfelter A, Pollock P, Carpten J, Gillanders E, Leja D, Dietrich K, Beaudry C, Berens M, Alberts D, Sondak V. 2000. Molecular classification of cutaneous malignant melanoma by gene expression profiling. Nature 406:536–40
11.Iyer VR, Eisen MB, Ross DT, Schuler G, Moore T, Lee JC, Trent JM, Staudt LM, Hudson J Jr, Boguski MS, Lashkari D, Shalon D, Botstein D, Brown PO. 1999. The transcriptional program in the response of human fibroblasts to serum. Science 283:83–7
12.Perou CM, Sorlie T, Eisen MB, van de Rijn M, Je rey SS, Rees CA, Pollack JR, Ross DT, Johnsen H, Akslen LA, Fluge O, Pergamenschikov A, Williams C, Zhu SX, Lonning PE, Borresen-Dale AL, Brown PO, Botstein D. 2000. Molecular portraits of human breast tumours. Nature 406:747–52
13.Shoemaker DD, Schadt EE, Armour CD, He YD, Garrett-Engele P, McDonagh PD, Loerch PM, Leonardson A, Lum PY, Cavet G, Wu LF, Altschuler SJ, Edwards S, King J, Tsang JS, Schimmack G, Schelter JM, Koch J, Ziman M, Marton MJ, Li B, Cundi P, Ward T, Castle J, Krolewski M, Meyer MR, Mao M, Burchard J, Kidd MJ, Dai H, Phillips JW, Linsley PS, Stoughton R, Scherer S, Boguski MS. 2001. Experimental annotation of the human genome using microarray technology. Nature 409:922–7
14.Scherf U, Ross DT, Waltham M, Smith LH, Lee JK, Tanabe L, Kohn KW, Reinhold WC, Myers TG, Andrews DT, Scudiero DA, Eisen MB, Sausville EA, Pommier Y, Botstein D, Brown PO, Weinstein JN. 2000. A gene expression database for the molecular pharmacology of cancer. Nat Genet 24:236–44
15.Staunton JE, Slonim DK, Coller HA, Tamayo P, Angelo MJ, Park J, Scherf U, Lee JK, Reinhold WO, Weinstein JN, Mesirov JP, Lander ES, Golub TR. 2001. Chemosensitivity prediction by transcriptional profiling. Proc Natl Acad Sci USA 98:10787–92
16.Alizadeh AA, Eisen MB, Davis RE, Ma C, Lossos IS, Rosenwald A, Boldrick JC, Sabet H, Tran T, Yu X, Powell JI, Yang L, Marti GE, Moore T, Hudson J Jr, Lu L, Lewis DB, Tibshirani R, Sherlock G, Chan WC, Greiner TC, Weisenburger DD, Armitage JO, Warnke R, Staudt LM, et al. 2000. Distinct types of di use large B–cell lymphoma identified by gene expression profiling. Nature 403:503–11
17.Golub TR, Slonim DK, Tamayo P, Huard C, Gaasenbeek M, Mesirov JP, Coller H, Loh ML, Downing JR, Caligiuri MA, Bloomfield CD, Lander ES. 1999. Molecular classification of cancer: class discovery and class prediction by gene expression monitoring. Science 286:531–7
18.Unger MA, Rishi M, Clemmer VB, Hartman JL, Keiper EA, Greshock JD, Chodosh LA, Liebman MN, Weber BL. 2001. Characterization of adjacent breast tumors using oligonucleotide microarrays. Breast Cancer Res 3:336–41
19.Bhattacharjee A, Richards WG, Staunton J, Li C, Monti S, Vasa P, Ladd C, Beheshti J, Bueno R, Gillette M, Loda M, Weber G, Mark EJ, Lander ES, Wong W, Johnson BE, Golub TR, Sugarbaker DJ, Meyerson M. 2001. Classification of human lung carcinomas by mRNA expression profiling reveals distinct adenocarcinoma subclasses. Proc Natl Acad Sci USA 98:13790–5
11 High Sensitivity Expression Profiling |
247 |
20.Garber ME, Troyanskaya OG, Schluens K, Petersen S, Thaesler Z, PacynaGengelbach M, van de Rijn M, Rosen GD, Perou CM, Whyte RI, Altman RB, Brown PO, Botstein D, Petersen I. 2001. Diversity of gene expression in adenocarcinoma of the lung. Proc Natl Acad Sci USA 98:13784–9
21.Pomeroy SL, Tamayo P, Gaasenbeek M, Sturla LM, Angelo M, McLaughlin ME, Kim JY, Goumnerova LC, Black PM, Lau C, Allen JC, Zagzag D, Olson JM, Curran T, Wetmore C, Biegel JA, Poggio T, Mukherjee S, Rifkin R, Califano A, Stolovitzky G, Louis DN, Mesirov JP, Lander ES, Golub TR. 2002. Prediction of central nervous system embryonal tumour outcome based on gene expression. Nature 415:436–42
22.van ’t Veer LJ, Dai H, van de Vijver MJ, He YD, Hart AA, Mao M, Peterse HL, van der Kooy K, Marton MJ, Witteveen AT, Schreiber GJ, Kerkhoven RM, Roberts C, Linsley PS, Bernards R, Friend SH. 2002. Gene expression profiling predicts clinical outcome of breast cancer. Nature 415:530–6
23.Brown PO, Botstein D. 1999. Exploring the new world of the genome with DNA microarrays. Nat Genet 21:33–7
24.Hughes TR, Mao M, Jones AR, Burchard J, Marton MJ, Shannon KW, Lefkowitz SM, Ziman M, Schelter JM, Meyer MR, Kobayashi S, Davis C, Dai H, He YD, Stephaniants SB, Cavet G, Walker WL, West A, Co ey E, Shoemaker DD, Stoughton R, Blanchard AP, Friend SH, Linsley PS. 2001. Expression profiling using microarrays fabricated by an ink–jet oligonucleotide synthesizer. Nat Biotechnol 19:342–7
25.Kane MD, Jatkoe TA, Stumpf CR, Lu J, Thomas JD, Madore SJ. 2000. Assessment of the sensitivity and specificity of oligonucleotide (50mer) microarrays. Nucleic Acids Res 28:4552–7
26.Lipshutz RJ, Fodor SP, Gingeras TR, Lockhart DJ. 1999. High density synthetic oligonucleotide arrays. Nat Genet 21:20–4
27.Kallioniemi A, Kallioniemi OP, Sudar D, Rutovitz D, Gray JW, Waldman F, Pinkel D. 1992. Comparative genomic hybridization for molecular cytogenetic analysis of solid tumors. Science 258:818–21
28.Yuen T, Wurmbach E, Pfe er RL, Ebersole BJ, Sealfon SC. 2002. Accuracy and calibration of commercial oligonucleotide and custom cDNA microarrays. Nucleic Acids Res 30:e48
29.Kuo WP, Jenssen TK, Butte AJ, Ohno-Machado L, Kohane IS. 2002. Analysis of matched mRNA measurements from two di erent microarray technologies. Bioinformatics 18:405–12
30.Li J, Pankratz M, Johnson JA. 2002. Di erential gene expression patterns revealed by oligonucleotide versus long cDNA arrays. Toxicol Sci 69:383–90
31.Hu GK, Madore SJ, Moldover B, Jatkoe T, Balaban D, Thomas J, Wang Y. 2001. Predicting splice variant from DNA chip expression data. Genome Res 11:1237–45
32.Fodor SP, Read JL, Pirrung MC, Stryer L, Lu AT, Solas D. 1991. Light–directed, spatially addressable parallel chemical synthesis. Science 251:767–73
33.Maskos U, Southern EM. 1992. Oligonucleotide hybridizations on glass supports: a novel linker for oligonucleotide synthesis and hybridization properties of oligonucleotides synthesised in situ. Nucleic Acids Res 20:1679–84
34.Nanthakumar A, Pon RT, Mazumder A, Yu S, Watson A. 2000. Solid–phase oligonucleotide synthesis and flow cytometric analysis with microspheres encoded with covalently attached fluorophores. Bioconjug Chem 11:282–8
248 Ramesh Ramakrishnan et al.
35.Graves DJ. 1999. Powerful tools for genetic analysis come of age. Trends Biotechnol 17:127–34
36.Marshall WS, Boymel JL. 1999. Drug Discovery Today. 2:34–42
37.Elghanian R, Xu Y, McGowen J, Sietho M, Liu CG, Winick J, Fuller N, Ramakrishnan R, Beuhler A, Johnson T, Mazumder A, Brush C. 2001. Nucleosides, Nucleotides and Nucleic Acids. 20:1371–1375
38.Lemeshko SV, Powdrill T, Belosludtsev YY, Hogan M. 2001. Oligonucleotides form a duplex with non-helical properties on a positively charged surface. Nucleic Acids Res 29:3051–8
39.Lockhart DJ, Dong H, Byrne MC, Follettie MT, Gallo MV, Chee MS, Mittmann M, Wang C, Kobayashi M, Horton H, Brown EL. 1996. Expression monitoring by hybridization to high–density oligonucleotide arrays. Nat Biotechnol 14:1675–80
40.Mir KU, Southern EM. 1999. Determining the influence of structure on hybridization using oligonucleotide arrays. Nat Biotechnol 17:788–92
41.Matveeva OV, Tsodikov AD, Giddings M, Freier SM, Wyatt JR, Spiridonov AN, Shabalina SA, Gesteland RF, Atkins JF. 2000. Identification of sequence motifs in oligonucleotides whose presence is correlated with antisense activity. Nucleic Acids Res 28:2862–5
42.Wetmur JG. 1991. DNA probes: applications of the principles of nucleic acid hybridization. Crit Rev Biochem Mol Biol 26:227–59
43.Langer PR, Waldrop AA, Ward DC. 1981. Enzymatic synthesis of biotin–labeled polynucleotides: novel nucleic acid a nity probes. Proc Natl Acad Sci USA 78:6633–7
44.Ramakrishnan R, Dorris D, Lublinsky A, Nguyen A, Domanus M, Prokhorova A, Gieser L, Touma E, Lockner R, Tata M, Zhu X, Patterson M, Shippy R, Sendera TJ, Mazumder A. 2002. An assessment of Motorola CodeLink microarray performance for gene expression profiling applications. Nucleic Acids Res 30:e30
45.Lockhart DJ, Winzeler EA. 2000. Genomics, gene expression and DNA arrays. Nature 405:827–36
46.Wang X, Ghosh S, Guo SW. 2001. Quantitative quality control in microarray image processing and data acquisition. Nucleic Acids Res 29:E75–5
47.Wodicka L, Dong H, Mittmann M, Ho MH, Lockhart DJ. 1997. Genome–wide expression monitoring in Saccharomyces cerevisiae. Nat Biotechnol 15:1359–67
48.Hastie ND, Bishop JO. 1976. The expression of three abundance classes of messenger RNA in mouse tissues. Cell 9:761–74
49.Chan V, Graves DJ, McKenzie SE. 1995. The biophysics of DNA hybridization with immobilized oligonucleotide probes. Biophys J 69:2243–55
50.Hong Y, Muller UR, Lai F. 2003. Toxicology in Vitro 17:85–92
51.Riccelli PV, Merante F, Leung KT, Bortolin S, Zastawny RL, Janeczko R, Benight AS. 2001. Hybridization of single–stranded DNA targets to immobilized complementary DNA probes: comparison of hairpin versus linear capture probes. Nucleic Acids Res 29:996–1004
52.Yue H, Eastman PS, Wang BB, Minor J, Doctolero MH, Nuttall RL, Stack R, Becker JW, Montgomery JR, Vainer M, Johnston R. 2001. An evaluation of the performance of cDNA microarrays for detecting changes in global mRNA expression. Nucleic Acids Res 29:E41–1
53.Che D, Bao Y, Muller UR. 2001. Novel surface and multicolor charge coupled device–based fluorescent imaging system for DNA microarrays. J Biomed Opt 6:450–6
11 High Sensitivity Expression Profiling |
249 |
54.Neuschaefer D, Budach W, Wanke C. 2002. SPIE’s BIOS 2002. Proceeding Abstract 4626–115:189
55.Stimpson DI, Hoijer JV, Hsieh WT, Jou C, Gordon J, Theriault T, Gamble R, Baldeschwieler JD. 1995. Real–time detection of DNA hybridization and melting on oligonucleotide arrays by using optical wave guides. Proc Natl Acad Sci USA 92:6379–83
56.Broude NE, Woodward K, Cavallo R, Cantor CR, Englert D. 2001. DNA microarrays with stem–loop DNA probes: preparation and applications. Nucleic Acids Res 29:E92
57.Cheek BJ, Steel AB, Torres MP, Yu YY, Yang H. 2001. Chemiluminescence detection for hybridization assays on the flow–thru chip, a three–dimensional microchannel bio–chip. Anal Chem 73:5777–83
58.Fredrickson HL, Perkins EJ, Bridges TS, Tonucci RJ, Fleming JK, Nagel A, Diedrich K, Mendez-Tenorio A, Doktycz MJ, Beattie KL. 2001. Towards environmental toxicogenomics – development of a flow–through, high–density DNA hybridization array and its application to ecotoxicity assessment. Sci Total Environ 274:137–49
59.Raghavachari N, Bao Y, Li G, Xie X, M¨uller UR. 2003. Reduction of autofluorescence on DNA microarrays and slide surfaces by treatment with sodium borohydride. Anal Biochem 312:102–5
60.Duggan DJ, Bittner M, Chen Y, Meltzer P, Trent JM. 1999. Expression profiling using cDNA microarrays. Nat Genet 21:10–4
61.Mayanil CS, George D, Freilich L, Miljan EJ, Mania-Farnell B, McLone DG, Bremer EG. 2001. Microarray analysis detects novel Pax3 downstream target genes. J Biol Chem 276:49299–309
62.DeRisi J, Penland L, Brown PO, Bittner ML, Meltzer PS, Ray M, Chen Y, Su YA, Trent JM. 1996. Use of a cDNA microarray to analyse gene expression patterns in human cancer. Nat Genet 14:457–60
63.Relogio A, Schwager C, Richter A, Ansorge W, Valcarcel J. 2002. Optimization of oligonucleotide–based DNA microarrays. Nucleic Acids Res 30:e51
64.Storho JJ, Marla SS, Hagenow S, Mehta H, Lucas A, Garimella V, Patno TJ, Buckingham W, Cork WH, M¨uller UR. 2002. SPIE Proceedings. SPIE Proceedings 4937:1–7
65.Sussman H. 2002. The Scientist. 16(13):37–38
66.Schroeder BG, Peterson LM, Fleischmann RD. 2002. Improved quantitation and reproducibility in Mycobacterium tuberculosis DNA microarrays. J Mol Microbiol Biotechnol 4:123–6
67.Xiang CC, Kozhich OA, Chen M, Inman JM, Phan QN, Chen Y, Brownstein MJ. 2002. Amine–modified random primers to label probes for DNA microarrays. Nat Biotechnol 20:738–42
68.Pabon C, Modrusan Z, Ruvolo MV, Coleman IM, Daniel S, Yue H, Arnold LJ Jr. 2001. Optimized T7 amplification system for microarray analysis. Biotechniques 31:874–9
69.Van Gelder RN, von Zastrow ME, Yool A, Dement WC, Barchas JD, Eberwine JH. 1990. Amplified RNA synthesized from limited quantities of heterogeneous cDNA. Proc Natl Acad Sci USA 87:1663–7
70.Vernon SD, Unger ER, Rajeevan M, Dimulescu IM, Nisenbaum R, Campbell CE. 2000. Reproducibility of alternative probe synthesis approaches for gene expression profiling with arrays. J Mol Diagn 2:124–7
250 Ramesh Ramakrishnan et al.
71.Wang E, Miller LD, Ohnmacht GA, Liu ET, Marincola FM. 2000. High–fidelity mRNA amplification for gene profiling. Nat Biotechnol 18:457–9
72.Raghavachari et al. Ambion TechNotes. 9((3)): http://www.ambion.com- /techlib/tn/93–9313.html
73.Theilgaard-Monch K, Cowland J, Borregaard N. 2001. Profiling of gene expression in individual hematopoietic cells by global mRNA amplification and slot blot analysis. J Immunol Methods 252:175–89
74.Brail LH, Jang A, Billia F, Iscove NN, Klamut HJ, Hill RP. 1999. Gene expression in individual cells: analysis using global single cell reverse transcription polymerase chain reaction (GSC RT–PCR). Mutat Res 406:45–54
75.Bao P, Frutos AG, Greef C, Lahiri J, Muller U, Peterson TC, Warden L, Xie X. 2002. High–sensitivity detection of DNA hybridization on microarrays using resonance light scattering. Anal Chem 74:1792–7
76.Srilatha S, Raghavachari N, Bao YP, Muller UR, Feldman D. 2003. Breast Cancer Research and Treatment. in press
77.Yuen PK, Li G, Bao P, M¨uller UR. 2003. Lab on a Chip. 3:46–50
78.Adey NB, Lei M, Howard MT, Jensen JD, Mayo DA, Butel DL, Co n SC, Moyer TC, Slade DE, Spute MK, Hancock AM, Eisenho er GT, Dalley BK, McNeely MR. 2002. Gains in sensitivity with a device that mixes microarray hybridization solution in a 25–microm–thick chamber. Anal Chem 74:6413–7
79.Wahl GM, Stern M, Stark GR. 1979. E cient transfer of large DNA fragments from agarose gels to diazobenzyloxymethyl–paper and rapid hybridization by using dextran sulfate. Proc Natl Acad Sci USA 76:3683–7
80.Elowitz MB, Levine AJ, Siggia ED, Swain PS. 2002. Stochastic gene expression in a single cell. Science 297:1183–6

12
Applications of Matrix-CGH (Array-CGH)
for Genomic Research and Clinical Diagnostics
Carsten Schwaenena, Michelle Nesslinga, Bernhard Radlwimmera, Swen Wessendorf, and Peter Lichtera
12.1 Introduction
One of the major scientific achievements of the past decade was the rapid development of genomic research, resulting in the comprehensive sequence information of the human genome. This information has provided the basis for the identification of a vast number of novel genomic aberrations in tumors and hereditary diseases.
Cancer etiology and development is associated with hereditary or acquired genomic alterations. Among these, genomic imbalances play a prominent role with deletions indicating the localization of tumor suppressor genes (e.g. NF2, P53 or ATM) or amplifications frequently a ecting protooncogenes (e.g. MYC). Such aberrations may lead to an inactivation or, by a so–called “dosage e ect”, activation of genes relevant to the initiation and progression of tumor cells. Genomic imbalances also play an important role in the field of clinical genetics. Many human mental retardation syndromes, congenital malformations and miscarriages are caused by defined copy number gains or losses of various chromosomal regions, whole chromosomes, or by small subtelomeric chromosome rearrangements [1–5]. Besides the most frequent aneuploidies of human chromosomes, such as Patau syndrome (trisomy of chromosome 13), Edward syndrome (trisomy of chromosome 18) or Down syndrome (trisomy of chromosome 21), a number of congenital diseases are associated with smaller imbalances, mostly microdeletions: e.g. Prader–Willi syndrome (15q12), Angelman syndrome (15q12), Williams syndrome (7q11.2), or DiGeorge syndrome (22q11.21). Identification of chromosomal imbalances has significantly contributed to the detection of genes playing a pathogenic role and the elucidation of molecular mechanisms responsible for defined phenotypes in malignant or congenital diseases.
Our current understanding of chromosomal alterations is mainly based on chromosome banding analysis, visualization of targeted genomic regions by fluorescence in situ hybridization (FISH) to metaphase chromosomes or interphase cell nuclei, or traditional comparative genomic hybridization (CGH).
252 Carsten Schwaenena et al.
In the last decade, CGH was extensively applied to the investigation of recurrent imbalances in hematological malignancies and solid tumors. CGH to metaphase chromosomes is a molecular cytogenetic technique that allows genome–wide screening for imbalanced chromosomal regions independent of the need to prepare metaphase chromosomes from the specimen to be investigated. This is of particular importance in the analysis of tumor cells, as in many instances dividing cells are di cult or even impossible to obtain. Thus, CGH circumvents the limitations of conventional karyotype analysis including mandatory short-term culturing of the tumor cells which might induce additional chromosomal aberrations. In principle, equal amounts of di erentially labelled genomic test (e.g. tumor) and control DNA are used as probes for fluorescence in situ hybridization (FISH) onto chromosomes of normal metaphase cells immobilized on glass slides. The comparison of the obtained hybridization–signal intensities of both DNA probes represents an average of all imbalances present in the sample genome [6–10].
CGH allows genome–wide localization of chromosomal imbalances without prior knowledge of specific regions of interest, and has been used to study a large variety of solid tumors and hematological malignancies [11–16]. Such studies have revealed a wealth of novel genomic aberrations, contributed to the identification of novel genes, and provided the basis for improved cancer classification schemes. Conventional CGH, however, has not become a diagnostic tool in clinical settings, since the method is technically demanding, di cult to automate and has limited spatial resolution. Due to the degree of DNA condensation of metaphase chromosomes, resolution of CGH is restricted to approximately 3–10 Mb for low copy number gains and losses [17–19] and 2 Mb (a product of the degree of repetition and the size of the amplicon) for high level amplifications [8, 20].
To circumvent these problems, it was mandatory to replace the metaphase chromosomes as targets for comparative in situ hybridization. A chip-based technique, termed “matrix–CGH” or “array–CGH”, was developed [21] allowing analyses at a much higher resolution and providing a basis for extensive automation. For this approach, the chromosome targets are substituted by well-defined genomic DNA fragments (e.g. specific for chromosomal regions or genes) cloned in various types of vectors (e.g. BACs, PACs, cosmids, plasmids). These fragments are immobilized on glass surfaces in order to generate a microarray where each clone is represented on a distinct position of the matrix. When the technique was first reported [21] most of the steps of the procedure were performed manually. This approach has been extended and modified with regard to automation and array size [22–24]. Rapid and reproducible positioning of large numbers of DNA fragments is achieved using ink jet, split pin or capillary-based robotic printing systems. This allows high resolution genomic screening of thousands of defined DNA targets immobilized on glass slides in a single experiment. The spatial resolution of matrix–CGH is highly superior to that of chromosomal CGH. Resolution is limited mainly by the size of the spotted DNA fragments, and by the fact that hybridization
12 Applications of Matrix-CGH (Array-CGH) 253
signal strength decreases with decreasing fragment size and complexity. Using BAC or PAC clones as targets, single–copy number changes can be detected with a resolution similar to that of interphase FISH in a single hybridization experiment. Analysis of multiple genomic regions by inter-phase FISH, in contrast, would require either multiple hybridization experiments or a complex multicolor FISH approach applied to a series of cell nuclei. High level amplifications down to a size of several kb can be detected by using cDNA arrays as hybridization targets [25, 26].
Matrix–CGH analysis is based on a co-hybridization of di erentially fluorescent-labelled genomic test and control DNA. Following hybridization, the signal intensities of both fluorochromes are measured for each target sequence and the respective normalized signal ratios are calculated. The obtained genomic profile indicates gains or losses of chromosomal regions like low copy number losses, such as deletions, low copy number gains, such as trisomies, or high level amplifications. A representative example is shown in Figs. 12.1 and 12.2. One should keep in mind that comparative genomic hybridization does not allow the identification of balanced chromosome aberrations such as balanced translocations or inversions. While matrix–CGH is dedicated to the detection of net genomic imbalances, genomic DNA arrays could also contribute to the fine mapping of breakpoints in rearranged chromosomes. Provided a marker chromosome is prepared by flow sorting or micromanipulation techniques and the chromosome-derived labelled DNA is hybridized to a comprehensive genomic array, breakpoints could be pinpointed to a single fragment immobilized on the chip depending on the chip design [27].
12.2 Technical Aspects
Di erent DNA targets have been tested for use in matrix–CGH. The most common are genomic DNA fragments cloned in di erent vector types (BAC, PAC, cosmid) [21, 22, 24]. These spanning DNA inserts (up to 300 kbp) are prepared from bacterial cultures and sheared by sonification to a fragment length of 500–5000 kbp [22, 24], or generated by applying PCR-based amplification procedures [23, 28]. One disadvantage of the preparation from large bacterial cultures is that it is laborious and expensive and has to be repeated whenever the DNA supply has been exhausted. To overcome these problems, methods of whole–genome amplification, such as degenerate–oligonucleotide– primed–PCR (DOP–PCR, [29]) PCR and single-cell comparative genomic hybridization (SCOMP); [30]), have been applied to PCR–amplify BAC and PAC clone DNA [23, 27]. For these methods, DNA is prepared on a small scale, and the PCR products, once obtained, can be repeatedly re-amplified producing a large supply of target DNA. Furthermore, use of PCR-amplified BAC and PAC sequence pools has the advantage of allowing the simultaneous preparation of thousands of DNA fragments ready to be immobilized on a
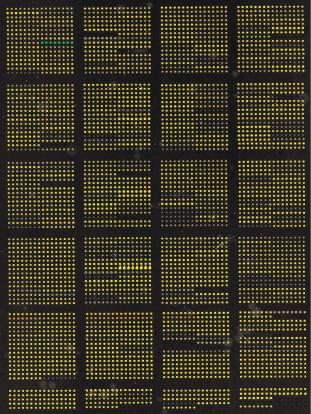
254 Carsten Schwaenena et al.
Fig. 12.1. Matrix–CGH chip co-hybridized with Cy3-labelled HL60–tumor DNA and Cy5-labelled male–control DNA. Clones are spotted in replicas of eight. Red and green spot color indicates losses and gains in HL60 relative to control DNA, respectively
microarray [27]. Alternatively, cDNA arrays have been used in some genomic profiling studies [25, 26].
These protocols are compatible with commercially available printing devices equipped with split–pins, capillaries or ink jet systems. Printing of e.g. one nanoliter of DNA solution yields homogeneous spots of 70–150 m in diameter. For large-scale microarrays the split–pin or capillary technology is superior due to a much higher printing speed. Technical parameters a ecting spot density, spot quality (temperature, humidity) and immobilization e - ciency (glass surface, chemical fixation) are equivalent to those used in other current DNA microarray protocols.
Concerning the source of DNA to be investigated, best matrix–CGH results are obtained with fresh or frozen tissue or cell samples. However, many clinical specimens are formalin-fixed and para n embedded. From such samples
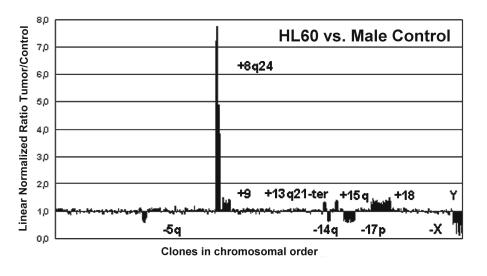
12 Applications of Matrix-CGH (Array-CGH) 255
only partially degraded genomic DNA can be prepared. While it is possible to perform matrix–CGH from such archived collections, the success of these studies is highly dependent on the quality of the fixative (bu ered formalin is required) and the duration of the fixation. As this information is often not available, the success rate of studies on archived material can be quite limited.
For labelling of genomic DNA probes, a number of di erent protocols are used, e.g. incorporation of dye-labelled nucleotides by nick–translation, universal PCR or random primer extension. Apart from labelling of very small DNA amounts, e.g. from microdissected tumor samples with universal PCR reactions, random labelling currently is the most widely used protocol for matrix–CGH. In comparison to expression profiling by DNA microarrays, matrix–CGH has a much higher demand with respect to sensitivity and signal linearity. This is due to the necessity to measure subtle ratio di erences for the detection of monoallelic gains or losses of < 0.5 (0.5 for a deletion and 1.5 for a trisomy compared to 1.0 for a balanced state). Therefore tiny variations in signal intensities have to be detected with high accuracy. Additionally, in contrast to constitutional diseases, ratio di erences in primary tumor specimens are diminished according to the sample’s content of ‘contaminating’ stromal tissue (fibrocytes, leukocytes, vessel endothelial cells) or adjacent non-malignant cells exhibiting a normal diploid karyotype. For reliable genomic profiling, the proportion of cells to be analyzed, e.g. the content of tumor cells, should be at least 50%.
Fig. 12.2. Matrix–CGH profile of the tumor cell line HL60. BAC and PAC clones are arranged in chromosomal order along the X-axis. Linear normalized ratios of HL60 and male–control DNA fluorescence signals are shown on the Y-axis. All the genomic imbalances characteristic of HL60 are detected
256 Carsten Schwaenena et al.
As in expression analyses, the raw fluorescence ratios of matrix–CGH images have to be normalized to compensate for unequal incorporation rates of the fluorescence dyes and other biases. Normalization can either be performed globally, using all clones of the array, or by selecting clones corresponding to genomic regions that likely are in a diploid or ‘balanced’ state. During the development of matrix–CGH it became clear that a robust normalization procedure is needed, since the ratio values of some target fragments seem to depend on parameters which are not fully understood. With the development of new types of arrays, this problem has become more evident. Especially when screening tumor cell genomes this becomes an issue, since it is a priori not known whether a specific sequence used for normalization is actually part of a genomic imbalance. To overcome this problem, normalization of an experiment should be based on the median ratio of a large number of DNA clones (> 100), which are more or less linearly distributed across the whole human genome.
Technical issues that still need to be resolved include the development of protocols for quantitative amplification of small amounts of DNA extracted from small numbers of cells. E orts have been made to use DOP–PCR for matrix–CGH of microdissected para n-embedded cells [31], and SCOMP has been successfully used for chromosomal CGH. Recently, a new method, hyperbranched strand displacement amplification [32], was tested for matrix–CGH. The authors found that using 1000 or more cells of starting material, gene– dosage alterations of threefold or more could be detected [33]. Technical demands also depend on whether the experiments are part of a research study or whether matrix–CGH is applied as a diagnostic tool. In the latter case, sensitivity and specificity of the results should be as high as possible (e.g. 95%). As a means of increasing the sensitivity, we have established a protocol using 8 replica spots for each DNA fragment with exclusion of the most extreme ratio values [34].
12.3 Applications
Automated genomic profiling by matrix–CGH can be envisioned for two major applications:
•As a scientific research tool applying whole genome chips
•Arrays consisting of contiguously mapping DNA fragments
•Arrays testing for specific genes or candidate regions
•In clinical applications allowing rapid and automated diagnosis based on arrays dedicated to the detection of disease specific imbalances
High resolution genomic DNA chips covering the genome will allow high resolution screenings aimed at the detection of previously unknown quantitative genomic alterations. Currently, such chips consist of arrays of fragments mapping at defined intervals [23], but in the near future whole genome chips,
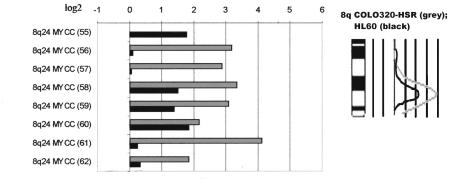
12 Applications of Matrix-CGH (Array-CGH) 257
carrying, e.g., a complete tiling path of fragments of the human genome, will become available. The identified aberrations will allow the identification of critical chromosomal regions or might even pinpoint critical genes, e.g. tumor suppressor genes or oncogenes. Aberrant chromosomal regions can be further narrowed to microdeletions or single imbalanced DNA fragments by subsequent molecular analysis with specialized arrays consisting of contiguously mapping genomic DNA fragments (‘contigs’). Depending on the size of the imbalanced chromosomal region and the desired physical resolution, BACs, PACs, cosmids or sets of cDNAs of adjacent genes are used. Whenever diseaserelevant chromosomal regions have been identified by any method, contig chips are a suitable starting point for studies aiming at the identification of disease genes. The feasibility of this approach has been recently demonstrated in 116 patients with hereditary neurofibromatosis type 2. In this study, the chromosomal region 22q12 was analyzed with defined contigs uncovering small deletions as small as 40 kbp in size [35]. Thus, matrix–CGH allows bridging of the gap between imbalances approximately 10 Mbp in size, assessed, e.g. by cytogenetic methods, and smaller imbalances only some 100 kbp in length.
A further approach utilizes various designs of so-called onco chips, which test for the copy number of genes, selected on the basis of their function (e.g. carcino–genesis) or location (e.g. in tumor-associated imbalanced regions). In a recent study, such a chip was used to identify previously undetected, hidden chromosomal amplifications in high grade non-Hodgkin lymphoma that correlate with the mRNA expression level of candidate genes located in the respective amplicons [36]. Based on this and other studies [37, 38], and in analogy to the novel findings that had been detected with traditional CGH, it
Fig. 12.3. Comparison of matrix–CGH and chromosomal CGH values. Adapted from Wessendorf et al. 2002. Examples are shown for tumor cell lines COLO320–HSR (continuous amplification of 8q24, grey bars) and HL60 (discontinuous amplification of 8q24, black bars). Although the scoring of the ratio values of the two methods is highly concordant, the absolute ratio values of the amplified regions are distributed over a much higher range for array signals, indicating the superior dynamics of matrix–CGH
258 Carsten Schwaenena et al.
can be assumed that matrix–CGH will help to uncover numerous amplicons too small to be seen when using conventional methods. Furthermore, due to the method’s high resolution, detection of discontinuous amplifications will even become possible (Fig. 12.3). Once the number of candidate genes has been limited by fine–mapping of amplicons, subsequent molecular analyses will lead to the identification of new disease-related genes, in particular onco genes. The significance of the identified amplicon can easily be verified by FISH to tissue microarrays [39], which are a convenient tool to rapidly assess the frequency of the respective amplification in a large series of tumors. Pathogenically significant gene amplifications can also provide interference points for new therapeutic targets. The Her2/neu amplification in breast carcinomas and other tumors serves as a paradigmatic example. Amplification of this gene, which codes for a membrane-bound receptor, is associated with tumor progression. Patients carrying this amplification benefit from treatment with a modified antibody (Herceptin) directed against the receptor. E orts needed to prove the pathogenic role of a candidate gene, however, should not be underestimated. Even with today’s advanced technologies, comprehensive functional characterization, including analysis of DNA sequence, RNA and protein expression levels, posttranslational modifications, molecular interactions in biological pathways, and more, remains a formidable challenge.
Another interesting application of matrix–CGH is the detailed comparison of related tumor samples from an individual patient. This approach is of particular interest to the monitoring of tumor development and progression at di erent time points including comparison between primary tumors and derived metastases, transformation of tumors towards higher malignancies or analysis of relapse. Information about when and where chromosomal imbalances occur or recur in one individual will potentially aid the discovery of genes relevant to tumor initiation, aggressiveness, metastatic potential, and treatment resistance (e.g. [40, 41]).
In the recent past, the accumulation of complex molecular data has greatly contributed to improvements in tumor classification schemes. Assessment of genomic imbalances at an unprecedented resolution will likely also contribute to further refinements in tumor classification. In this context, two recent matrix–CGH studies are of particular interest. It could be shown that profiling of genomic imbalances allows reliable diagnosis of renal cell carcinoma [42]. A study comparing the genomic profile of dedi erentiated and pleomorphic liposarcomas uncovered a highly distinct pattern of both tumor entities [43]. Interestingly, this distinction was unequivocal using the genomic profile, but was less apparent from the expression profiles obtained from the same tumor series. Thus, depending on the diagnostic question and the tumor type, expression studies are not always superior in their diagnostic potential. This is an important consideration for practical reasons as well, since DNA typically is much more stable than RNA and therefore much better suited for application in routine diagnostics.
12 Applications of Matrix-CGH (Array-CGH) 259
While matrix–CGH is now broadly accepted as a research tool, it is often debated to what degree it will really become part of routine diagnostics. Matrix–CGH could be used for the diagnosis of well-characterized recurrent chromosomal aberrations, which predict a homogeneous clinical course. In such a setting, the diagnosis could support treatment decisions and contribute to a further individualization of anticancer therapies. The identification of distinct clinical subgroups with di erent prognostic outcome is certainly most advanced in hematological malignancies. For example, cytogenetic methods, such as chromosome banding and FISH, are used to define subgroups in patients with chronic lymphocytic or acute leukemias according to their survival probabilities. The impact of such diagnostic data is evident in acute myeloid leukemias, where patients are already treated with either risk-adapted conventional chemotherapy or myeloablative peripheral stem cell transplantation according to their cytogenetic risk profile. Thus, genomic profiles provide important information for a tailored treatment, i.e. each patient receiving the best therapy available when comparing treatment tolerance and individual genetic risk.
Finally, it will be important to reliably diagnose the pattern of genomic alterations with prognostic impact. Disease specific matrix–CGH chips will simplify the identification of relevant chromosomal aberrations, since they allow an automated diagnostic procedure. We have developed such a chip optimized to detect alterations in chronic lymphocytic leukemia of B–cell type. This disease is characterized by a highly variable clinical course. Recurrent chromosomal imbalances were shown to provide strongly significant prognostic markers with deletions including chromosome arms 17p or 11q being associated with rapid disease progression and shorter overall survival of patients [44]. As therapy decisions based on these biological findings appear to become an option that is being tested in clinical trials, we developed a DNA microarray dedicated to meet the clinical needs. Testing of this chip revealed an unprecedented diagnostic specificity and sensitivity [34].
Besides oncological applications, CGH to microarrays will also become an important tool in clinical genetics. In families with unexplained mental retardation or dysmorphic features, as yet unknown microdeletions or cryptic rearrangements associated with small imbalances of genomic material seem to play a major role. Thus, prenatal and postnatal diagnostics in these families would greatly benefit from a method screening for such alterations at a high resolution, such as matrix–CGH with a genome–wide chip design. In case of mental retardation with negative cytogenetic results, a specialized chip covering all telomeric regions could be of particular importance [45], since more than 5% of cases with mental retardation seem to be associated with cryptic telomeric translocations including small genomic imbalances [46].
In addition to the many applications that are currently pursued, genomic microarrays will likely find new uses in other areas as well. For example, it can be envisioned that genomic DNA chips will be applied to study the extent of genomic duplications and deletions that have occurred during evo-
260 Carsten Schwaenena et al.
lution and that seem to exist as polymorphisms within populations [47]. Moreover, new technical developments are likely to further increase the potential of genomic DNA arrays. For instance, a combination of immunoprecipitation and hybridization to genomic microarrays could facilitate the assignment of DNA/protein binding sites [48]. Certainly, CGH to microarrays is still in its early phase and the spectrum of applications will likely increase further in the future.
References
1.Knight SJ, Flint J. Perfect endings: a review of subtelomeric probes and their use in clinical diagnosis. J Med Genet. 2000 Jun;37(6):401–9
2.Battaglia A, Carey JC. Diagnostic evaluation of developmental delay/mental retardation: An overview. Am J Med Genet. 2003 Feb 15;117C(1):3–14
3.Cassidy SB, Dykens E, Williams CA. Prader-Willi and Angelman syndromes: sister imprinted disorders. Am J Med Genet. 2000 ;97(2):136–46
4.Donnai D, Karmilo -Smith A. Williams syndrome: from genotype through to the cognitive phenotype. Am J Med Genet. 2000;97(2):164–71
5.Scambler PJ. The 22q11 deletion syndromes. Hum Mol Genet. 2000 Oct; 9(16):2421–6
6.Kallioniemi A, Kallioniemi OP, Sudar D, Rutovitz D, Gray JW, Waldman F, Pinkel D. Comparative genomic hybridization for molecular cytogenetic analysis of solid tumors. Science. 1992 Oct 30;258(5083):818–21
7.Du Manoir S, Speicher MR, Joos S, Schrock E, Popp S, Dohner H, Kovacs G, Robert-Nicoud M, Lichter P, Cremer T. Detection of complete and partial chromosome gains and losses by comparative genomic in situ hybridization. Hum Genet. 1993 Feb;90(6):590–610
8.Joos S, Scherthan H, Speicher MR, Schlegel J, Cremer T, Lichter P. Detection of amplified DNA sequences by reverse chromosome painting using genomic tumor DNA as probe. Hum Genet. 1993 Feb;90(6):584–9
9.Kallioniemi OP, Kallioniemi A, Sudar D, Rutovitz D, Gray JW, Waldman F, Pinkel D. Comparative genomic hybridization: a rapid new method for detecting and mapping DNA amplification in tumors. Semin Cancer Biol. 1993 Feb;4(1):41–6
10.Speicher MR, du Manoir S, Schrock E, Holtgreve-Grez H, Schoell B, Lengauer C, Cremer T, Ried T. Molecular cytogenetic analysis of formalin–fixed, para n– embedded solid tumors by comparative genomic hybridization after universal
DNA–amplification. Hum Mol Genet. 1993 Nov;2(11):1907–14
11. Forozan F, Karhu R, Kononen J, Kallioniemi A, Kallioniemi OP.
Genome screening by comparative genomic hybridization. Trends Genet. 1997 Oct;13(10):405–9
12.Zitzelsberger H, Lehmann L, Werner M, Bauchinger M. Comparative genomic hybridisation for the analysis of chromosomal imbalances in solid tumours and haematological malignancies. Histochem Cell Biol. 1997 Oct–Nov;108(4–5):403– 17
13.Knuutila S, Armengol G, Bjorkqvist AM, el-Rifai W, Larramendy ML, Monni O, Szymanska J. Comparative genomic hybridization study on pooled DNAs from
12 Applications of Matrix-CGH (Array-CGH) 261
tumors of one clinical–pathological entity. Cancer Genet Cytogenet. 1998 Jan 1;100(1):25–30
14.Bentz M, Werner CA, Dohner H, Joos S, Barth TF, Siebert R, Schroder M, Stilgenbauer S, Fischer K, Moller P, Lichter P. High incidence of chromosomal imbalances and gene amplifications in the classical follicular variant of follicle center lymphoma. Blood. 1996 Aug 15;88(4):1437–44
15.Bentz M, Plesch A, Bullinger L, Stilgenbauer S, Ott G, Muller-Hermelink HK, Baudis M, Barth TF, Moller P, Lichter P, Dohner H. t(11;14)–positive
mantle cell lymphomas exhibit complex karyotypes and share similarities with B–cell chronic lymphocytic leukemia. Genes Chromosomes Cancer. 2000 Mar;27(3):285–94
16.Knuutila S, Aalto Y, Autio K, Bjorkqvist AM, El-Rifai W, Hemmer S, Huhta T, Kettunen E, Kiuru-Kuhlefelt S, Larramendy ML, Lushnikova T, Monni O, Pere H, Tapper J, Tarkkanen M, Varis A, Wasenius VM, Wolf M, Zhu Y. DNA copy number losses in human neoplasms. Am J Pathol. 1999 Sep;155(3):683–94
17.Kallioniemi A, Kallioniemi OP, Piper J, Tanner M, Stokke T, Chen L, Smith HS, Pinkel D, Gray JW, Waldman FM. Detection and mapping of amplified DNA sequences in breast cancer by comparative genomic hybridization. Proc Natl Acad Sci USA. 1994 Mar 15;91(6):2156–60
18.Bentz M, Plesch A, Stilgenbauer S, Dohner H, Lichter P. Minimal sizes of deletions detected by comparative genomic hybridization. Genes Chromosomes Cancer. 1998 Feb;21(2):172–5
19.Kirchho M, Gerdes T, Maahr J, Rose H, Bentz M, Dohner H, Lundsteen
C.Deletions below 10 megabasepairs are detected in comparative genomic hybridization by standard reference intervals. Genes Chromosomes Cancer. 1999 Aug;25(4):410–3
20.Piper J, Rutovitz D, Sudar D, Kallioniemi A, Kallioniemi OP, Waldman FM, Gray JW, Pinkel D. Computer image analysis of comparative genomic hybridization. Cytometry. 1995 Jan 1;19(1):10–26
21.Solinas-Toldo S, Lampel S, Stilgenbauer S, Nickolenko J, Benner A, Dohner H, Cremer T, Lichter P. Matrix–based comparative genomic hybridization: biochips to screen for genomic imbalances. Genes Chromosomes Cancer. 1997 Dec;20(4):399–407
22.Pinkel D, Segraves R, Sudar D, Clark S, Poole I, Kowbel D, Collins C, Kuo WL, Chen C, Zhai Y, Dairkee SH, Ljung BM, Gray JW, Albertson DG. High resolution analysis of DNA copy number variation using comparative genomic hybridization to microarrays. Nat Genet. 1998 Oct;20(2):207–11
23.Snijders AM, Nowak N, Segraves R, Blackwood S, Brown N, Conroy J, Hamilton G, Hindle AK, Huey B, Kimura K, Law S, Myambo K, Palmer J, Ylstra B, Yue JP, Gray JW, Jain AN, Pinkel D, Albertson DG. Assembly of microarrays for genome–wide measurement of DNA copy number. Nat Genet. 2001 Nov;29(3):263–4
24.Wessendorf S, Fritz B, Wrobel G, Nessling M, Lampel S, Goettel D, Kuepper M, Joos S, Hopman T, Kokocinski F, Dohner H, Bentz M, Schwaenen C, Lichter
P.Automated screening for genomic imbalances using matrix–based comparative genomic hybridization. Lab Invest. 2002 Jan;82(1):47–60
25.Pollack JR, Perou CM, Alizadeh AA, Eisen MB, Pergamenschikov A, Williams CF, Je rey SS, Botstein D, Brown PO. Genome–wide analysis of DNA copy– number changes using cDNA microarrays. Nat Genet. 1999 Sep;23(1):41–6
262 Carsten Schwaenena et al.
26.Hyman E, Kauraniemi P, Hautaniemi S, Wolf M, Mousses S, Rozenblum E, Ringner M, Sauter G, Monni O, Elkahloun A, Kallioniemi OP, Kallioniemi A.
Impact of DNA amplification on gene expression patterns in breast cancer. Cancer Res. 2002 Nov 1;62(21):6240–5
27.Carter NP, Fiegler H, Piper J. Comparative analysis of comparative genomic hybridization microarray technologies: report of a workshop sponsored by the Wellcome Trust. Cytometry. 2002 Oct 1;49(2):43–8
28.Carter NP. Analysis of chromosome rearrengements and replication timing using DNA microarrays. Abstract, Perigueux; 2003
29.Telenius H, Carter NP, Bebb CE, Nordenskjold M, Ponder BA, Tunnacli e A.
Degenerate oligonucleotide–primed PCR: general amplification of target DNA by a single degenerate primer. Genomics. 1992 Jul;13(3):718–25
30.Klein CA, Schmidt-Kittler O, Schardt JA, Pantel K, Speicher MR, Riethmuller G. Comparative genomic hybridization, loss of heterozygosity, and DNA sequence analysis of single cells. Proc Natl Acad Sci USA. 1999 Apr 13;96(8):4494– 9
31.Daigo Y, Chin SF, Gorringe KL, Bobrow LG, Ponder BA, Pharoah PD, Caldas C. Degenerate oligonucleotide primed–polymerase chain reaction–based array comparative genomic hybridization for extensive amplicon profiling of breast cancers : a new approach for the molecular analysis of para n–embedded cancer tissue. Am J Pathol. 2001 May;158(5):1623–31
32.Dean FB, Hosono S, Fang L, Wu X, Faruqi AF, Bray-Ward P, Sun Z, Zong Q, Du Y, Du J, Driscoll M, Song W, Kingsmore SF, Egholm M, Lasken RS.
Comprehensive human genome amplification using multiple displacement amplification. Proc Natl Acad Sci USA. 2002 Apr 16;99(8):5261–6
33.Lage JM, Leamon JH, Pejovic T, Hamann S, Lacey M, Dillon D, Segraves R, Vossbrinck B, Gonzalez A, Pinkel D, Albertson DG, Costa J, Lizardi PM.
Whole Genome Analysis of Genetic Alterations in Small DNA Samples Using Hyperbranched Strand Displacement Amplification and Array–CGH. Genome Res. 2003 Feb;13(2):294–307
34.Schwaenen C, Nessling M, Wessendorf S, et al. Automated array-based genomic profiling in chronic lymphocytic leukemia: Development of a clinical tool and discovery of recurrent genomic alterations Proc Natl Acad Sci USA 2004 Jan;101(4):1039-1044
35.Bruder CE, Hirvela C, Tapia-Paez I, Fransson I, Segraves R, Hamilton G, Zhang XX, Evans DG, Wallace AJ, Baser ME, Zucman-Rossi J, Hergersberg M, Boltshauser E, Papi L, Rouleau GA, Poptodorov G, Jordanova A, Rask-Andersen H, Kluwe L, Mautner V, Sainio M, Hung G, Mathiesen T, Moller C, Pulst SM, Harder H, Heiberg A, Honda M, Niimura M, Sahlen S, Blennow E, Albertson DG, Pinkel D, Dumanski JP. High resolution deletion analysis of constitutional DNA from neurofibromatosis type 2 (NF2) patients using microarray– CGH. Hum Mol Genet. 2001 Feb 1;10(3):271–82
36.Wessendorf S, Schwaenen C, Kohlhammer H et al. Hidden gene amplifications in aggressive B-cell non-Hodgkin lymphomas detected by microarray-based comparative genomic hybridization Oncogene 2003 Mar;22(9):1425-1429
37.Ishizuka T, Tanabe C, Sakamoto H, Aoyagi K, Maekawa M, Matsukura N, Tokunaga A, Tajiri T, Yoshida T, Terada M, Sasaki H. Gene amplification profiling of esophageal squamous cell carcinomas by DNA array CGH. Biochem Biophys Res Commun. 2002 Aug 9;296(1):152–5
12 Applications of Matrix-CGH (Array-CGH) 263
38.Zhao J, Roth J, Bode-Lesniewska B, Pfaltz M, Heitz PU, Komminoth P. Combined comparative genomic hybridization and genomic microarray for detection of gene amplifications in pulmonary artery intimal sarcomas and adrenocortical tumors. Genes Chromosomes Cancer. 2002 May;34(1):48–57
39.Kononen J, Bubendorf L, Kallioniemi A, Barlund M, Schraml P, Leighton S, Torhorst J, Mihatsch MJ, Sauter G, Kallioniemi OP. Tissue microarrays for high–throughput molecular profiling of tumor specimens. Nat Med. 1998 Jul;4(7):844–7
40.Martinez-Climent JA, Alizadeh AA, Segraves R, Blesa D, Rubio-Moscardo F, Albertson DG, Garcia-Conde J, Dyer MJ, Levy R, Pinkel D, Lossos IS. Transformation of follicular lymphoma to di use large cell lymphoma is associated with a heterogeneous set of DNA copy number and gene expression alterations. Blood. 2002 Oct 24
41.Kraus J, Pantel K, Pinkel D, Albertson DG, Speicher MR. High–resolution genomic profiling of occult micrometastatic tumor cells. Genes Chromosomes Cancer. 2003 Feb;36(2):159–66
42.Wilhelm M, Veltman JA, Olshen AB, Jain AN, Moore DH, Presti JC Jr, Kovacs G, Waldman FM. Array–based comparative genomic hybridization for the di erential diagnosis of renal cell cancer. Cancer Res. 2002 Feb 15;62(4):957–60
43.Fritz B, Schubert F, Wrobel G, Schwaenen C, Wessendorf S, Nessling M, Korz C, Rieker RJ, Montgomery K, Kucherlapati R, Mechtersheimer G, Eils R, Joos S, Lichter P. Microarray–based copy number and expression profiling in dedi erentiated and pleomorphic liposarcoma. Cancer Res. 2002 Jun 1;62(11):2993–8
44.Dohner H, Stilgenbauer S, Benner A, Leupolt E, Krober A, Bullinger L, Dohner K, Bentz M, Lichter P. Genomic aberrations and survival in chronic lymphocytic leukemia. N Engl J Med. 2000 Dec 28;343(26):1910–6
45.Veltman JA, Schoenmakers EF, Eussen BH, Janssen I, Merkx G, van Cleef B, van Raven-swaaij CM, Brunner HG, Smeets D, van Kessel AG. High–throughput analysis of sub-telomeric chromosome rearrangements by use of array–based comparative genomic hybridization. Am J Hum Genet. 2002 May;70(5):1269– 76
46.Flint J, Wilkie AO, Buckle VJ, Winter RM, Holland AJ, McDermid HE. The detection of subtelomeric chromosomal rearrangements in idiopathic mental retardation. Nat Genet. 1995 Feb;9(2):132–40
47.Lichter P, Joos S, Bentz M, Lampel S. Comparative genomic hybridization: uses and limitations. Semin Hematol. 2000 Oct;37(4):348–57
48.Lockhart DJ, Winzeler EA. Genomics, gene expression and DNA arrays. Nature. 2000 Jun 15;405(6788):827–36
49.Johansson B, Mertens F, Mitelman F. Cytogenetic evolution patterns in nonHodgkin’s lymphoma. Blood. 1995 Nov 15;86(10):3905–14