


6
Nanoarrays
Dan V. Nicolau, Linnette Demers, and David S. Ginger
6.1 Introduction
The field of microarray technology progressed, in the most general terms, along three directions: increase of the number of tests (biomolecules or cells) on the same chip; increase of the number of tested biomolecules on the same unit area (i.e. density); and increase in the sophistication of the biochips, with many alternative designs being proposed. The first two trends walk in the steps of the evolution of microchips proper, i.e. larger chips and higher density on the chip, but the last similarity (i.e. ‘smarter’ design) should be analyzed in more detail. While semiconductor technology imposed very early in its history a ‘champion’ device, i.e. bipolar and later CMOS transistor, microarray technology does not have yet a ‘champion’. It follows that microarray technology is still to reach its maturity, with all the benefits (e.g. e ervescent innovation) and drawbacks (e.g. di cult standardization) that arise from this still-emergent stage.
However, seen from another angle, microarray technology is much closer to a ‘technology crisis’. It has been argued for decades, and proven wrong every time, that semiconductor technology will come to a halt due to the inability of lithography to print smaller features at the pace asked by the unforgiving Moore’s Law [1], i.e. halving of the printed critical size on the chip every 18 months. Apart from the apparently endless capacity of microlithography to push the resolution limits, fundamentally the crisis has been always far away. Microelectronics and – nowadays – nanoelectronics ‘operate’ with electrons (which are much smaller than 1 nm), while the most advanced lithography is asked to print features of many tens of nanometers. Even if we consider the quantum e ects, the present lithography can print features that are at least ten times larger than the critical technological barrier. On the other hand, individual DNAs and proteins, the smallest ‘building elements’ of microarrays, are several to several tens of nanometers in size. Consequently advanced lithography is already capable of printing features that are on the same order of magnitude, if not smaller than, the ‘modules’ to be printed! Furthermore, for cell and tissue arrays, patterning resolution is a non-issue.
90 Dan V. Nicolau et al.
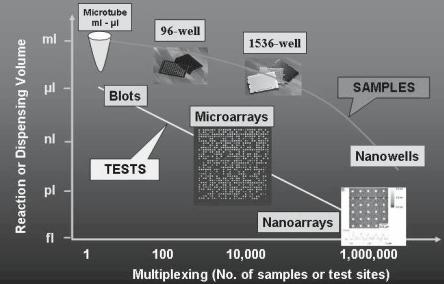
Then, why do we need nanoarrays? Firstly, the decrease of the ‘feature size’ does increase the capability of the microarrays via the decrease of the cost (less volume of analyte required per probed biomolecule) and via the e ciency and reliability (increase of the number of the probed biomolecules and/or tests on the same chip). This amplification of capability regarding the decrease of the sample volume and hence associated costs, which is further explored in a later section, is presented in Fig. 6.1. But the development of nanoarrays also allows much more, that is the fabrication of arrays with di erent complexity and functionality. For instance, the probing of single biomolecules, which is conceivably possible with nanoarray technologies, will address the present potential problem of probing the bioactivity of biomolecules collectively in ‘lumps’, rather than individually as it happens in actual natural biomolecular recognition.
Secondly, the capability of addressing single biomolecules allows the conceptualization of totally di erent micro/nanoarrays. For instance instead of ‘passive’, ‘one–use’ arrays, where biomolecules are probed (similar to a ‘read’ function) once, one can think of ‘active’, ‘multiple–use’ arrays, where biomolecules perform repetitive functions, e.g. ‘computation’. Another layer of complexity can be added if we progress from ‘static’ arrays, where the biomolecules reside and are probed on one location, to ‘dynamic’ arrays with biomolecules that move either laterally or circularly in order to perform repetitive tasks e.g. sensing, power generation and again computation.
Fig. 6.1. Evolution of the sample volume versus multiplexing density (courtesy of Uwe Muller)
6 Nanoarrays |
91 |
6.2 Passive Nano–scale Arrays
Typically, robotically-spotted microarrays contain spots of 100 microns, with up to 10,000 di erent cDNA sites on a chip. In situ synthesis, using 20 m2 spots is currently capable of producing up to 400,000 distinct oligonucleotides on a chip [2]. A reduction in feature size from 20–200 m to microns or sub– microns would vastly increase the amount of genetic information that could be screened simultaneously under certain conditions on one chip. This type of scaling, with appropriate readout system, could enable SNP analysis via tiling arrays of the entire human genome on a single 2 × 2 cm array [3]. In general, achieving such high resolution with directly patterned oligonucleotide probes would enable the study of binding and detection in arrays that are up to 10,000 times more complex, in the same area, than is presently possible. A decrease in feature size will also lead to assays wherein a fixed number of targets are screened with correspondingly smaller requirements of sample volume. Importantly, patterning at this scale will not only require, but greatly facilitate the development of high throughput, high resolution screening tools.
In principle, there are two major strategies for the fabrication of nanoarrays, which are common to the micro/nanolithography for both microchips and microarrays. First, one can alter the properties of an area e.g. with light, creating di erent chemical functionalities or hydrophobicities locally. Subsequently, this ‘island’ is used for further fabrication, e.g. immobilization of the target biomolecule. It has been shown (discussion in Chap. 3) that this fabrication strategy has certain fundamental limitations in terms of the achievable resolution. Second, one can deposit locally the chemical species (e.g. target biomolecules in solution) by mechanical means directly on the surface with e.g. a nano–sized ‘pencil’ – a strategy similar to several ‘new generation lithographies’ [4]. The deposition by mechanical means can also be performed in a non-contact manner using technologies developed on the back of ink jet printer technology.
Current methods for preparing microarrays vary with the specific application, and include contact and non-contact methods of spotting oligonucleotides or cDNA, or a combination of photolithography and in situ synthesis for oligonucleotides. However, without major investment in high end projections systems, conventional lithography techniques cannot fabricate features in the 150–200 nm range, due to the di raction of light. Extreme UV lithography and other next–generation photolithography strategies may o er the required resolution, but at ever increasing mask and fabrication facility costs, and operating under increasingly harsh conditions that may not be compatible with biological materials. Specifically, it will eventually become economically prohibitive to scale down microarray spots with conventional photolithography. As a comparison, the estimated cost of conventional microelectronics fabrication facilities will reach 200 billion dollars by 2015 [5]. Thus, there has been a significant e ort on the behalf of the research and industrial communities to develop strategies to replace conventional robotic
92 Dan V. Nicolau et al.
spotting and photolithographic methods for generating sub–100 nm biological nanoarrays. For instance, microcontact printing, developed at Harvard, is a direct–printing method that uses photolithographically generated masters to generate elastomer stamps which can be ‘inked’ with molecules and used to directly transfer the molecules in the form of a pattern to a substrate [2]. This technique is useful for forming large area patterns of organic or biological materials in a massively parallel fashion with pattern resolutions approaching 100 nm. However, this parallel technique is limited in its capabilities for generating multiple, chemically diverse, high resolution patterns in alignment on a surface.
The patterning strategies for biological arrays that rely on direct deposition avoid the indirect, resist or optical mask-based approaches. For instance, inkjet or other dispensing technologies capable of depositing nanoliter sized droplets of material are now employed to form array spots on the order of hundreds of microns. Advanced technologies of this type, such as that of Picoliter Inc. that uses acoustic droplet ejection technology, are capable of delivering picoliter volumes in a non-contact fashion, yielding spot sizes on the order of tens of microns. Still, true nanoscale patterning demands deposition volumes several orders of magnitude smaller than what is currently possible. In addition to the challenge of direct nanoscale delivery of biological molecules, ultra-precise nanoscale lateral positioning technologies must be developed and exploited, screening approaches for nanoscale bio-assays must be considered, as well as methods for increasing throughput and reliability for printing large numbers of distinct biological species. Recently, a number of compelling examples have emerged from the scanning probe microscopy community that address some or potentially all of these challenges.
6.2.1 Fabrication of Nanoarrays with sub–100 nm Resolution
Combinatorial Nano–surfaces Fabricated via Micro–ablation
Biomolecules, in particular proteins, strongly interact with the surfaces they are immobilized on. Nano–structures would have both the ability to probe large biomolecules individually, because they have comparable dimensions with the probed biomolecules, and also to make this probing largely parallel because nanostructures are amenable to large area densities. In general microfabrication is incapable of producing nanostructures, but recently [6] laser micro–ablation has been used for the fabrication of structures that are micron–sized laterally but nano–sized vertically. The micro–wells are fabricated via the localized laser ablation of a protein-blocked thin (tens of nm) metal (e.g. gold) layer deposited on a transparent polymeric (e.g. PMMA) film. The micro–ablation of gold induces local chemical and physical changes in the top surface of the polymer as well as a higher specific surface, which cooperate to achieve a higher and more reproducible surface concentration
6 Nanoarrays |
93 |
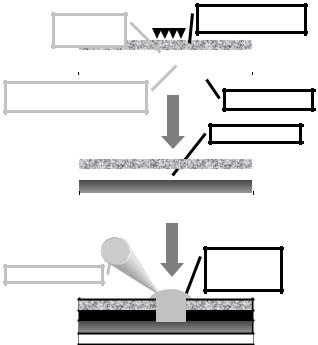
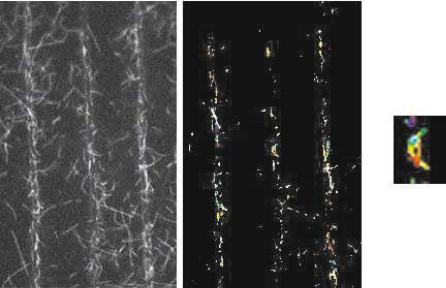
of proteins in micro–wells. The fabrication method can use a sequence of local ablation and ‘flood’ coverage with protein solution, or the ablation of the whole micro–assay followed by the ‘spatially-addressable’ deposition of different protein solutions with a pico–liter pipette (Fig. 6.2). It was observed that the micro–assays comprising line-shaped micro–structures o er a higher reproducibility and the opportunity to encode the information (e.g. type of protein, concentration) through a combination of vertical lines in a ‘bar code’, ‘informationally-addressable’ mode and not in a spatially-addressable mode like in the classical microarrays. It has been found that the ‘combinatorial’ nature of the inner surface of the channels (Fig. 6.3) allows for the increased adsorption of molecularly di erent proteins, from 3 to 10 times more than the adsorption on similar flat surfaces, with a higher amplification of smaller, globular proteins.
|
|
|
|
|
|
|
|
hυ |
ablatable |
|
|
|
|
|
|
|
protecting protein |
|
|
|
|
|
|
|
layer, e.g. BSA |
|
|
|
|
|
layer, e.g. Au
|
|
|
|
|
|
|
|
|
|
|
|
|
|
|
|
|
|
|
|
|
|
|
|
|
|
|
|
transparent, protein |
|
|
Glass substrate |
|||
adsorbing polymer layer |
|
|
||||
|
|
|
|
|||
|
|
|
|
|
Micro/nano-hole |
|
|
|
|
|
|
||
|
|
|
|
|
|
|
|
|
|
|
|
|
|
|
|
|
|
|
|
|
|
|
|
|
|
|
|
|
|
|
|
|
|
|
Protein
Picoliter pipette
solution droplet
Fig. 6.2. Procedure for the fabrication of microwells and deposition of protein solution droplets
94 Dan V. Nicolau et al.
50 nm |
|
|
|
|
|
Topograph |
Lysozyme largest |
II |
III |
|
I |
|||
25 |
|
dimension |
|
|
|
|
|
|
|
|
|
IgG largest |
|
|
0 |
|
dimension |
|
|
|
|
|
|
|
0 |
1 |
2 |
3 |
4 µm |
(relative) Hydrophobicity
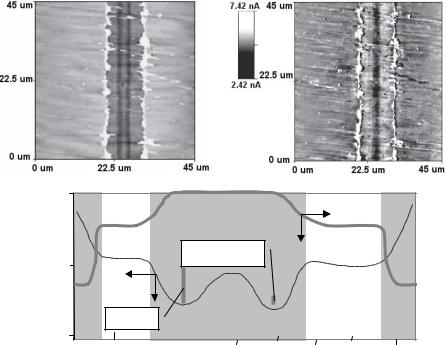
Fig. 6.3. AFM topographical (top left, brighter areas indicate elevated regions) and lateral force (top right) image of a channel fabricated via the ablation of a 30 nm Au layer on top of PMMA. The middle region (I) is the most hydrophobic, whereas the outer region (III) is the most hydrophilic. The lateral dimensions are much larger than the vertical dimensions. The vertical bars represent the largest dimension of the largest (IgG) and smallest (lysozyme) protein studied, respectively
Patterning Biomolecules via Nanografting
One method of ultra-high resolution patterning of biomolecules uses the probe tip of an Atomic Force Microscope (AFM) as an extremely sharp stylus to literally scrape away a swath of molecules on a resist-coated surface. In this approach, ‘Nanografting’, the freshly patterned surface is flooded with a patterning molecule which selectively binds to the exposed areas. Variations on this approach have been developed by Gang-Yu Liu’s group and others as relatively facile methods for fabrication of one molecule thick patterns of biomolecules such as oligonucleotides and proteins with line patterns less than 100 nm, and down to 10 nm on select substrates [7–9]. In a typical experiment, alkanethiol resists are deposited as self-assembled monolayers on ultra flat gold surfaces. A solution of oligonucleotides modified by alkanethiol tags bathes the substrate during patterning such that the molecules assemble into the gaps made by the path of the AFM tip in the resist layer (Fig. 6.4). A similar strategy

6 Nanoarrays |
95 |
has been employed for patterning protein molecules with exposed cysteine residues. In its present form, nanografting is a serial technique, thus inherently slow and limited in its application to miniaturization of bioarrays. In addition, the basic requirement of a monolayer resist limits the choice of substrate to those that can be well passivated with resists which are in turn easily removed. Furthermore, the etching/backfilling process may not be amenable to a parallel process because of the di culty of selectively filling in etched features with di erent molecules (e.g. di erent DNA sequences) on the sub– 100 nm scale. Finally, the method is essentially a negative tone lithography, inappropriate for multiple patterning, which is required for an array-like application. Direct–printing nanolithography techniques such as those described below will be useful for overcoming such limitations. However, nanografting is a potentially useful technique for specialized applications that require high
Fig. 6.4. (A)–(C) Schematic representation of general nanografting method for patterning biomolecules on gold surfaces. (D) AFM image of 3 DNA lines on generated on Au via nanografting, and (E), a line scan through the features in (d) showing height of individual DNA molecules in the pattern (Reprinted with permission from [8]. Copyright 1997 American Chemical Society Publications)
96 Dan V. Nicolau et al.
resolution patterns of a single type of molecule, for instance to examine e ects of nanoscale confinement of oligonucleotide or protein molecules, investigate new readout methods for miniaturized bioanalysis, and for preliminary research in the area of bioelectronic circuits.
Direct Nanopipet Deposition
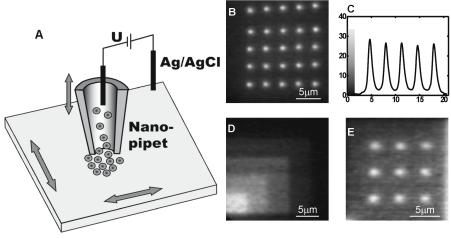
The ability to generate multicomponent arrays of biomolecules requires development of techniques for directly depositing materials on surfaces. In one example of e orts in this direction, Klenerman et al. used a modified version of Scanning Probe Microscopy called scanning ion–conductance microscopy to directly deposit biomolecules such as biotinylated DNA onto streptavidincoated glass surfaces and protein G onto positively charged glass surfaces [10]. In these experiments, nanopipets with inner diameters of 100–150 nm in an electrolyte solution as reservoirs for charged biomolecules which flow out of the tip with application of the appropriate bias (Fig. 6.5). The spatial resolution of the patterning methodology is limited to several microns due to lateral di usion of the molecules in solution en route to the surface. However, this technique may be particularly useful for generating and studying gradients of biomolecules on a surface because the number of molecules delivered from the tip per unit time is a function of the applied voltage [10]. To use to its full potential and in order to be implemented for the fabrication of nanoarrays, however, the method would require major parallelism of the tips.
Dip Pen NanolithographyTM
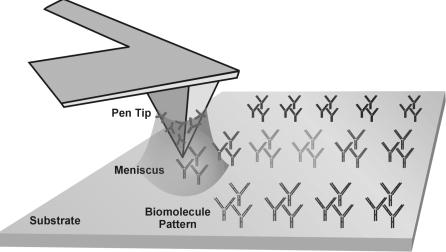
Recently a new SPM-based direct–write nanopatterning technique, ‘Dip Pen NanolithographyTM’ (DPNTM) was reported by Mirkin and coworkers from Northwestern University [11–15]. Based upon a conventional AFM, DPNTM combines resolutions comparable and in some cases superior to those of electron beam lithography (15 nm linewidths) with the broad chemical compatibility obtained by operating under ambient conditions. In a typical DPNTM experiment, a conventional AFM probe tip is coated with a molecule or ‘ink’ to be patterned by dipping the tip in a solution of the molecules. By contacting the tip with the surface molecules are deposited via a water meniscus that condenses at the tip–substrate contact. With this di usion-based process longer tip–substrate dwell times lead to larger pattern spot areas [11,15]. Due to its direct deposition nature, the DPNTM process has been shown to be very general, both with respect to the molecules that may be transferred from the AFM tip to a surface (small organic surfactants, charged macromolecules such as conjugated polymers and proteins, sol–gel forming materials, and even nanoparticles) [11, 16–19] and the substrate (metals, e.g. gold; insulators, e.g. silicon oxide; and semiconductors, e.g. GaAs). The main requirement for transport is that there is some interaction, covalent or physical between the ink and the surface. For instance, alkanethiols form a coordination bond with a
6 Nanoarrays |
97 |
Fig. 6.5. (A) Schematic of nanopipet strategy for deposition of biomolecules, (B) Fluorescence microscopy of biotin-modified DNA on streptavidin-coated glass. (C) Line scan showing spot profile of bottom row in B. (D) DNA patterns with increasing surface concentrations on glass, and (E) Fluorescence micrograph of protein G on a positively-charged glass surface (Reprinted with permission from [10]. Copyright 2002 Academic Press Inc Elsevier Science)
gold surface [20, 21]. While there are techniques that can be used to produce extremely fine structures on a surface (such as electron–beam or focused ion beam lithography), the challenge for the fabrication of nanoarrays lies in generating complex patterns composed of di erent materials, placed in precise locations relative to each other [22]. With DPNTM, one can exploit the ability to write and read high resolution chemical patterns with the same tool. Thus, multiple chemical or biological patterns can be generated using DPNTM with precise ( 5 nm) alignment registration. Among patterning techniques that can operate at sub–micron and sub–100 nm dimensions, such as e–beam lithography or contact stamping methods, DPNTM is the only technology that can directly deposit biological molecules under ambient conditions with ultrahigh precision and registration. Moreover, these molecules can be deposited in either ambient or inert environments without exposing them to ionizing UV or electron–beam radiation. Also, several di erent kinds of molecules can be deposited without exposing the patterned molecules to harsh solvents or chemical etchants, and without risking cross–contamination. The desired chemistry is carried out exactly, and only, where it is desired (Fig. 6.6).
Preliminary experiments suggest that DNA patterning via DPNTM is not only possible, but can be highly controllable in terms of pattern size/shape, and that the immobilized DNA is functional and accessible to specific binding of labelled targets [18]. Initial studies of direct transfer of DNA from an AFM tip to both metal and insulator substrates identified several key com-
98 Dan V. Nicolau et al.
Fig. 6.6. Schematic of the DPNTM process for direct deposition of biological molecules
ponents which modulate DNA patterning, including precise control of the ambient humidity and careful functionalization and inking of the AFM tips. In addition to tip–coating and humidity, a judicious choice of ink–substrate combination can facilitate the DPNTM process. For example, hexanethiolmodified oligonucleotides were used to directly pattern gold substrates with features ranging from 50 nm to several micrometers in size. For nanoarrays on oxidized silicon wafers or glass surfaces, acrylamide modified oligonucleotides are deposited directly via DPNTM onto activated (mercapto–propyl– trimethoxylsilane, MPTMS) substrates where subsequent reaction (under ambient temperature, 45% relative humidity) forms a covalent link to the surface. Similar chemistry has been developed for glass and quartz substrates. Nonspecific binding of target oligonucleotide was minimized by passivating the unpatterned regions of the substrate by reaction with bu ered acrylic acid monomer at pH 10. The feature size of individual DNA spots is controllable over a range of several orders of magnitude via the tip–surface dwell time, as observed with other DPNTM systems [11]. For example, 100 nm spots can be deposited in times less than 1 second. Moreover, the rate of patterning is controllable by tuning the relative humidity of the patterning chamber. For example, the diameter of a spot created by holding the AFM tip for 10 seconds changes from less than 50 nm to 1 m with a relative humidity increase from 30% to 80%. The selectively and function of patterned oligonucleotides was verified by hybridization of complementary fluorophore-labelled DNA or oligonucleotide derivatised gold nanoparticle probes of di erent sizes. For example, a 2-component DNA pattern consisting of micron scale features was characterized first by epi–fluorescence microscopy of bound fluorophore-
6 Nanoarrays |
99 |
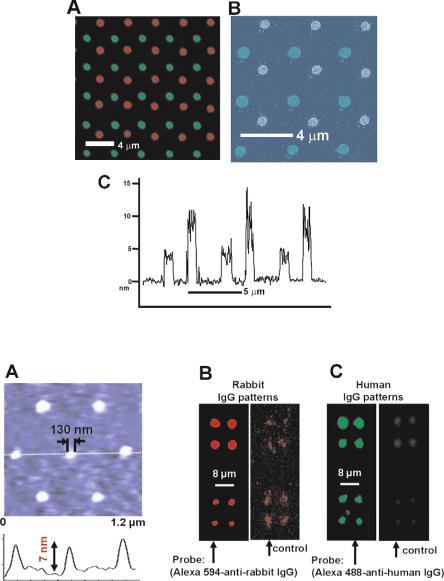
tagged complements, then by AFM topography measurements of two di erent sizes of DNA-modified gold nanoparticles (Fig. 6.7). Importantly, only fluorescence corresponding to the complementary target and the patterned area was detected, and the AFM topography images show that the gold particles react only with the correct oligonucleotide spot. In these preliminary experiments, spot shape, size, and emission intensity is extremely uniform, within individual features, and from spot to spot. With this technique, DNA spots with diameters as small as 50 nm were prepared, i.e. 10,000 times smaller (in terms of area density) than those in conventional microarrays. With the resolution demonstrated herein, arrays with 100,000 oligonucleotide spots can be generated in an area the size of a typical AFM scanner (100 × 100 m), making it possible to investigate scanned probe methods of microarray readout.
The DPNTM technique has recently been extended to deposition of proteins. In particular there have been reports of direct patterning of thiolated collagen and collagen-like peptides onto gold surfaces [17], human chorionic gonadotropin antibody onto 3 glycidoxy–propyl–trimethoxysilane modified glass surfaces [23], as well as a number of immunoproteins, enzymes, and viruses [24–26]. Significant e ort has been directed towards the characterization of the resulting protein nanostructures with regard to their activity. Although DPNTM is a gentle lithographic technique, surface interactions and covalent or non-covalent attachment chemistry could potentially serve to denature some classes of proteins. Researchers in the Mirkin group at Northwestern University have begun studying the complex issues involved in preserving the biological activity of immunoproteins such as IgG during a DPNTM experiment [24]. The use of additives such as glycerin to the protein patterning solution was found to enhance patterning by diminishing the negative e ects of drying the deposited proteins. For instance, Lim et al. used the DPNTM technique to deposit human IgG and rabbit IgG nanostructures on oxidized silicon surfaces through covalent attachment to carbonyl groups on the surface (Fig. 6.8a). The activity and identity of the immobilized proteins was confirmed by binding fluorescently-tagged antibodies specific for the two different nanopatterns [24]. The resulting two-color fluorescence images revealed specific biological activity and predicted cross–reactivity for the two patterns (Fig. 6.8b and c).
6.2.2 Strategies for Increased Throughput for Ultra-High Density Nanoarrays
In order to generate biological nanoarrays with significant improvements in complexity over those prepared by standard photolithographic or robotic spotting methods with adequate throughput, it is critical to develop nanopatterning technologies that operate in a massively parallel fashion. The common tools for generating microarrays deposit or assemble in situ hundreds of thousands of di erent probe features using photolithographic masks, or spot biomolecules directly using four or many pin configurations. The most signifi-
100 Dan V. Nicolau et al.
Fig. 6.7. Epi–fluorescent (A) and AFM topography (B) and (C) images of two di erent sizes of DNA-modified gold nanoparticles
Fig. 6.8. Protein nanostructures deposited by DPNTM. (A) Tapping mode . AFM image of high resolution IgG pattern on silicon oxide (line scan shows height of individual molecules in the pattern. Epi–fluorescence of (B) Rabbit IgG DPNTM pattern with Alexa 594-labelled anti-rabbit IgG probe, (C) Human IgG pattern with Alexa 488-labelled anti-human IgG probe. Note the faint spots indicating cross– reactivity for (B) and (C) (Reprinted with permission from [24]. Copyright 2003 Wiley-V C H Verlag GMBH)
6 Nanoarrays |
101 |
cant barrier to using the scanned probe nanolithography techniques described up to this point for arraying applications stems from the serial or ‘single pen’ nature of the techniques. Recognizing this limitation, several important advances have been made by researchers at IBM [27] and also at Stanford University [28–30] in the direction of parallel scanning probe methods. In particular, researchers at IBM have fabricated devices wherein 32 × 32 arrays of individually addressable and actuated cantilevers have been etched into a chip in an area of 3 mm × 3 mm [27]. Individual tips on this device are used to read and write ‘bits’ in a 100 × 100 micron area of a polymer film via thermally induced nanoindentation for ultra-high density data storage applications. In addition, Quate and co-workers at Stanford have developed a number of 1–D and 2–D probe arrays for both imaging and lithographic applications [28–30]. These results indicate that the MEMS technology expertise is available for designing and fabricating pen arrays suitable for deposition rather than indentation. The next challenge is to interface these engineering advances with direct write lithography methods such as DPNTM. In order to increase the throughput and area accessible to scanning-probe techniques, several groups around the world are pursing the development of parallel-probe cantilever arrays. A number of academic groups, as well as NanoInk Inc. are implementing similar MEMS based parallel-probe strategies designed specifically with the constraints of DPNTM applications in mind.
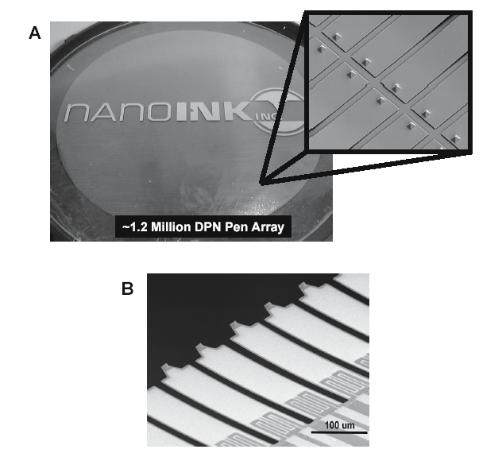
The simplest implementation of parallel-pen DPNTM is thus a passive probe array. In this case, the pens are not actuated independently but are simultaneously brought into contact with the surface and scanned together, allowing the duplication of a single pattern a number of times equal to the number of probes in the array. An example of preliminary e orts in this direction was reported by Hong and coworkers [12]. More recently, the microfabrication facility at NanoInk Inc. has produced cantilever arrays composed of more than 1.2 million pens on a single 4 inch wafer (Fig. 6.9a). Since active feedback is applied to only a single cantilever in the array, and the others are allowed to track the topography passively, specific constraints on the registration between the array and the surface, as well as the flexibility of the cantilevers must be met [31]. This ongoing work could eventually produce nanoarrays of more than 300 billion spots on a 4 inch wafer (50 nm diameter spots separated by 100 nm).
Independent control of each probe tip is another strategy with a di erent set of applications. Individual tip actuation can be accomplished using piezoelectric, capacitive, or thermoelectric actuation. In the first generation of active parallel-probe DPNTM arrays, researchers have used thermoelectric actuation: resistive heating of a multilayer cantilever results in di erential expansion of the components, leading to bending of the probe (Fig. 6.9b). Using this approach, a range of complex patterns can be generated at high speed because the contact between each tip and the writing surface is independently controlled. For instance, a 10–pen array can be used to write the numerals 0–9 simultaneously. The final challenge of complete MEMS integration of DPNTM
102 Dan V. Nicolau et al.
technology is the automation of tip coating and ink delivery. For certain applications it appears that custom microfluidic systems will ultimately be used to control the inking of individual cantilevers in a parallel probe–array. The realization of such systems will depend on the development and adaptation of a number of technologies. Large-scale integration of microfluidic technologies is still challenging, and arrays of 1000 individually addressable wells represent the current state of the art [32]. Thus, to meet the inking needs of parallel probe arrays (with an ultimate goal of being able to deliver a di erent ink to each probe in a large pen array), arrays of addressable ink wells must also be developed. Indeed it is clear that ultra-high density nanoarrays will re-
Fig. 6.9. (A) A 4” wafer containing more than 1.2 million silicon nitride DPNTM pens (inset is an SEM at 500× showing individual cantilevers and writing tips.) (Courtesy of NanoInk, Inc.) (B) SEM of active DPNTM probes equipped with thermoelectric actuation technology (courtesy of Chang Liu, University of Urbana– Champaign)
6 Nanoarrays |
103 |
quire incredibly complex sample handling. The synthesis and purification of large numbers of oligonucleotides for instance is daunting and may become prohibitive as the number of distinct probe features increases. An alternative strategy for fabrication of such high density nanoarrays may eventually exploit an in situ synthesis approach, whereby monomers are delivered sequentially by probe tips, building the probe molecules at each feature from the chip up in a strategy similar to that currently used by A ymetrix.
6.2.3 Strategies for Nanoarray Detection and Analysis
New technologies for generating nanoarrays with sub–100 nm sized features offer an opportunity for investigation and development of new detection methodologies that can operate below the di raction limit of light.
While present-day detection methods may be inadequate for screening such high density arrays, miniaturization on the scale accessible with DPNTM will allow the development of screening methods that are suitable for such nanoscale structures. There are many scientific opportunities in this regard: when a feature composed of receptors is miniaturized to the scale of the biological analytes or their attached labels, almost every mechanical, electrical and chemical property of the receptor feature is changed upon reaction with the analyte. These properties, including size, shape, electrical conductivity, and hydrophilicity, can all be monitored in situ with an AFM or with on-chip electronic circuitry. In the long term, it may even be possible to direct the attachment of proteins and virus particles in specific orientations to study reactivity as a function of structural configuration. One promising strategy for detecting analyte binding to nanoarrays is the use of labelled nanoparticle probes. Nanoparticles can be prepared from a host of di erent materials in di erent sizes and shapes and can be functionalized with biological recognition molecules such as antibodies or oligonucleotides [33–37]. Some of the particles have been shown to bind specifically to surface-immobilized receptors or complementary nucleic acids where they are detected using optical or electrical readout. This strategy is proving to be a particularly useful method of identifying and possibly quantifying binding in microarray assays due to the striking properties of the nanoparticles [18, 25]. For example, in addition to height change measurements after particle binding, there are already examples of electrical detection of DNA targets using DNA-modified gold nanoparticles between microelectrodes [36], as well as reports of detection strategies that make use of the strong resonant scattering [38, 39], optical absorbance [40], or fluorescent properties of certain metal or inorganic nanoparticles [41]. In general such strategies are amenable to spatially-resolved characterization of nanoarrays on surfaces through the wide variety of tools accessed by scanning probe microscopy, from topography, to friction, magnetic force, and even near field scanning optical configurations. This approach has been recently used in conjunction with topographical AFM to detect the selective binding of dif-
104 Dan V. Nicolau et al.
ferent sized DNA-modified nanoparticles to two component nanoarrays as in Fig. 6.7b. [18, 25, 42].
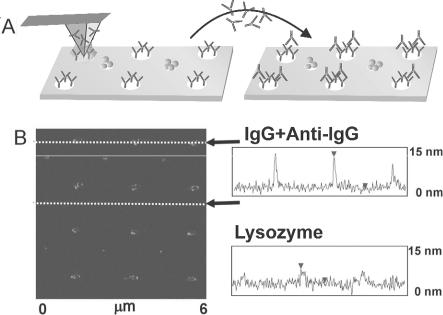
Furthermore, there is also the opportunity for label-free screening of nanoarrays using SPM imaging. For instance, Fig. 6.10 shows how such a DPNTM-fabricated 2-component protein array could potentially be used as a label free protein screening tool. Arrays of rabbit IgG and lysozyme proteins are deposited onto a gold substrate via DPNTM. Reacting the nanoarrays with rabbit anti-IgG leads to a 1:1 binding of the antibody–antigen IgG pairs, resulting in a doubling of the feature height of the IgG rows, which is observed in the micrographs. Perhaps more significantly, the control array (lysozyme in alternating rows) shows no change in feature height, indicating that the coupling retains its specificity. Although the orientation of the surface-bound IgG protein is not controlled in this experiment, a su cient fraction of the population apparently provides the solution-borne antibodies with access to the relevant binding domains of the protein [25].
Fig. 6.10. Label-less protein detection using Tapping Mode AFM. Alternating rows of rabbit IgG and lysozyme nanostructures were exposed to anti-rabbit IgG.
(A),(B): Line scans of IgG row and lysozyme row after anti-rabbit IgG treatment showing selective height increase at the IgG and no change at the lysozyme sites (Reprinted with permission from [25]. Copyright 2003 Academic Press Inc Elsevier Science)
6 Nanoarrays |
105 |
Clearly, the practicality of screening nanoarrays using scanned probe technology is currently limited by the slow imaging speed. A single 10 × 10 micron AFM image can take up to 20 minutes to acquire and conventional AFM at its fastest only acquires several frames a minute. However, SPM technology is advancing to address this particular issue. For example, Infinitesima’s novel technology combines a resonant scanned probe system with near-field optical detection to produce images in ten milliseconds or less, nearly video rate. With all the other advantages of conventional SPM it is ideally suited to following dynamic processes in situ and in almost any environmental conditions.
The path towards miniaturization will not proceed without requiring obstacles to be overcome along the way. However, it is widely thought that the potential rewards clearly justify the e ort. One potential di culty comes from cross–reactivity and non-specific binding of analyte or other species to the array spots. Although non-specific binding is a problem for any surface-based assay, it is likely to become more problematic as screening goes nanoscale: on a nanoscale receptor spot it would be possible for a few non-specifically- bound particles to completely overwhelm the intended signal. Fortunately, going nanoscale o ers new possibilities to alleviate the non specific binding. On one hand, for a small sacrifice in information density, redundancy and ‘error checking’ could be built into any array. On the other hand, controlling (and screening) the chemical environment with nanoscale precision could o er the opportunity both to reduce the frequency of non-specific binding events, and to more readily identify them when they do occur. Finally, with direct techniques such as DPNTM, cross–contamination of the patterned array features is entirely eliminated.
6.3 Computational Nanoarrays
The function of ‘classical’ bio–arrays, be they micro– or nano–, is to provide information regarding the biomolecular recognition through the docking of probe biomolecules on target biomolecules (or cells) spatially encoded on the surface of the array. But molecular recognition may be just the first of a concatenation of stages that represent a process of computation, in which case the last configuration of the microarray represents the ‘solution’. Although these functional arrays are not nanoarrays in the sense of lateral or vertical resolution as described in the previous section, they perform their function truly at the nano–level.
DNA computing is a new method of physical computing which is based on the molecular recognition of complementary biomolecules (DNA) and the massive parallelism that can be achieved through cycles of DNA synthesis, PCR, ligation, electrophoresis and use of restricting enzymes. This new computing method appears to be particularly suited to problems that cannot be solved by even the most advance traditional electronic computers that operate sequentially. Traditionally these are called NP problems, referring to the ex-
106 Dan V. Nicolau et al.
ponential (i.e. Nondeterministic Polynomial) time required to reach a solution for a linear increase of the size of the problem.
Adleman [43] was the first to describe a DNA-based method which solves the Hamilton path problem (e.g. finding an airline path that passes several cities optimally visiting each just once) in polynomial–time. The trade–o in Adleman’s experiment was to use a large number of ‘computers’ (i.e. DNA molecules) which perform operations in a massively parallel manner against time (number and type of physical procedural steps). The nodes and the pair between nodes were encoded in DNA strands, which self–assemble in all possible arrangements following Watson–Crick complementarity. Some of these dsDNA may contain possible solutions, which can be selected, amplified and detected using classical molecular biology techniques.
After the initial proof of concept carried out by Adleman [43], DNA computing received a lot of attention due to its potential for problem-solving e ciency, data storage capacity, energy e cient computation and new mathematical outlook on computation. Essentially, the basic operations of the DNA computing are: Amplify; Merge; Detect; Sequence-separate; Length-separate; and Position-separate. Using this basic mathematical apparatus, many algorithms have been proposed to solve specific problems using DNA computing, among others, the satisfiability problem [44], the maximal clique problem [45], the graph coloring problem [46], with many other (e.g. breaking the Data Encryption Scheme, Travelling Salesman Problem, decide graph connectivity, ‘knapsack’ problem) being possible.
The critical factor on which the success of DNA computing in solution– phase depends is the capacity to achieve very small error rates for various biochemical operations. Because the grand idea behind DNA computing is to perform massively parallel operations, it follows that an e cient computation relies on an as complete as possible search of the possible solutions space (DNA strands). Classically, this can be achieved by a high ratio of DNA strands available per number of candidate solutions. As the complexity of the problem (expressed in terms of the dimensions of the input) increases, this ratio decreases for a given initial amount of DNA, i.e. the average number of strands encoding one candidate solution becomes smaller. This places demands on the maximum acceptable error rate or, equivalently, on the minimum amount of DNA needed. Thus, DNA computing as defined su ers from a ‘scalability’ problem. This has prompted the search for means to better control the error rates in DNA computing operations (e.g. PCR, hybridization). One avenue for improving experimental control during DNA computing experiments is to immobilize the DNA strands on a surface before manipulation.
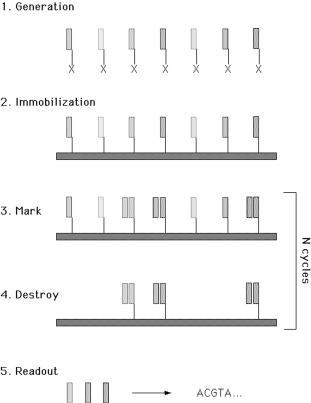
Microarray technology helped move the concept of manipulation of DNA molecules for DNA computing from solution-based to surface-based processes. For instance, Smith et al. [47] proposed a new surface-based DNA computation (Fig. 6.11). Firstly, ssDNA molecules that correspond to ‘all’ possible solutions to a problem (‘make’ function) are synthesized and covalently immobilized (‘attach’ function) on a surface. Then, subsets of the surface-bound
6 Nanoarrays |
107 |
Fig. 6.11. Schematic of DNA computation at surfaces (Reprinted with permission from [47]. Copyright 1998 Mary Ann Liebert Inc Publishers)
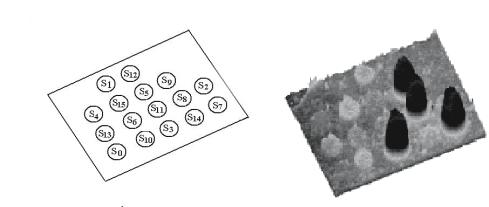
combinatorial ssDNA library are recognized by hybridization to their complements (‘mark’ operation), making these parts double stranded. An enzyme (e.g. exonuclease) destroys the non-hybridized oligonucleotides (‘destroy’ function). Finally, the previously hybridized oligonucleotides are regenerated (‘unmark’ operation). All strands that do not represent the solution are removed via the repetition of the ‘mark’, ‘destroy’ and ‘unmark’ operations, leaving only the ‘solution’ bound on the surface. Finally, the solution is read through sequence of decoupling from the surface, PCR and further hybridization to a designed microarray (Fig. 6.12). Frutos et al [48] developed the method further, proposing the use of enzymatic ligation reactions of DNA ‘words’ on surfaces for DNA computing.
This method of computation has been used by Liu et al. [49] for solving a simple case of the 3–SAT problem, which is considered to be the hardest of all NP problems. The solution of the 3–SAT problem has to satisfy a set of logical clauses, each composed of three true or false variables, connected
108 Dan V. Nicolau et al.
Fig. 6.12. Fluorescence profile (right) with the surface-bound oligonucleotide locations (left) for a DNA computing on surface chip (Reprinted with permission from [47]. Copyright 1998 Mary Ann Liebert Inc Publishers)
by ‘or’ logical operators. The problem has been solved in a reasonable time by coding the variables in binary strings which have been in turn coded in ssDNA strings. For n variables, 2n unique ‘answer’ (or ‘Watson’) strands exist, e.g. TGCGG = 001, complemented by unique ‘Crick’ strands. The solution is accepted if it satisfies all the logical clauses of a 3–SAT formula. If ssDNA strands representing all candidate solutions are immobilized on a gold surface, the addition of Crick strands will create a combination of ss– and dsDNA. The non-solution ssDNA, which do not satisfy the first clause encoded in the added Crick strands, are destroyed by enzymes leaving still–possible solutions locked in the dsDNA strands, which are subsequently melted – and the process starts again for the next clause. The last remaining strand is the solution which is decoded in a microarray format. The synthesis of DNA strands aside, the computation proceeds in 3k + 1 steps for the exploration of all 2n possibilities (k is the number of clauses). This procedure is much more e cient than the best conventional computer algorithm [50], which scales as 1.33n (n = number of variables). To put things in perspective, a 3–SAT problem with 30 clauses and 50 variables would be solved classically in about 1.6 million steps, but the method described above would solve it in 91 steps [51].
From a mathematical point of view, surface-based DNA computing is a competitor to solution–phase DNA computing. It is known [51] that surfacebased DNA chemistry supports general circuit computation on many inputs in parallel e ciently and that the number of parallel operations needed to decide the satisfiability of a Boolean circuit is proportional to the size of the circuit. Both solution phase and surface-based DNA computation present advantages and disadvantages. Surface-based DNA computing is more molecularly– e cient, because less strands are lost at each step and subsequently, there are less pressures on the needed initial representation redundancy, due to the
6 Nanoarrays |
109 |
immobilization of the oligos at the surface. Other advantages include ease of purification and the ability to use more advanced biochemical techniques, in particular those developed for microarrays. However, these gains come at the price of a massively reduced physical density (from 3D storage to 2D storage). Additionally, the number of operations per second is limited by the slower enzyme kinetics and lower hybridization e ciency. Finally, the surface-based method does not eliminate scaling problems since discrimination of singlebase mismatches becomes more di cult as the strand length increases and the operations are not error-free. The most serious of these limitations is the loss of information density. One must either increase the surface area (e.g. by using microbeads instead of a planar surface) or attempt to employ a local three–dimensional surface chemistry.
6.4 Dynamic Nanoarrays
Another characteristic of the ‘classical’ micro/nanoarrays is their single-use. Once their function, be that simple molecular recognition or biomolecular computation, is fulfilled and the information is passed further to appropriate information processing systems, the product –the microarray– becomes obsolete and therefore micro/nanoarrays are essentially single-use devices (with the notable exception of Nanogen’s approach derived from biosensors). More advanced devices would be designed to use molecular recognition for, rather than being, their function, which would be then continuous rather than one– o . These future devices, which would operate in a highly parallel arrangement, possibly in a microarray format, would comprise moving elements that are propelled by external means, or preferably self-propelled. The first option, i.e. external powered dynamic devices, has been launched by microfluidics and manipulation of magnetic beads. However, it is the self-propelled dynamic devices that o er the highest expectations of technological revolutions. Fortunately, Nature o ers several working models of molecular motors, many tested in primitive hybrid dynamic nano–devices.
Protein molecular motors, which work either as a pair in tandem, i.e. linear motors, or single, i.e. rotary motors, transform chemical energy, through the hydrolysis of adenosin–triphosphate (ATP), into mechanical energy or movement. Molecular motors, which are ubiquitous proteins, are responsible for biological functions as diverse as cell movement and division, transport of vesicles and muscle function.
Two experimental techniques, motility assays and single molecule visualization, manipulation and measurement, resulted in important advances in the understanding and quantification of the functions of molecular motors. Motility assays, which were pioneered some 15 years ago, are essentially primitive nano–devices operating in a ‘distributed’ microarray format, which allow the probing of the functions of molecular motors in a ‘black box’ manner. On the other hand, single molecule techniques allow the measurement of fundamen-
110 Dan V. Nicolau et al.
tal parameters, e.g. forces, and are therefore useful for the design of future nanodevices based on molecular motors.
Rotary Motors
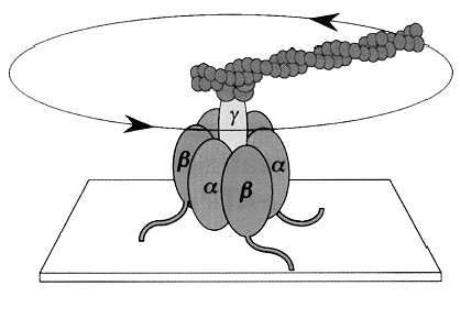
Protein molecular motors perform their function through either rotary or linear motion. Although it has been demonstrated that actin filaments also perform a rotary motion along their axis when sliding atop of myosin functionalized surfaces [52], there are two motors that operate in a truly rotary mode, i.e. the bacterial flagellum motor and the ATP synthase enzyme. The latter appears to be the smallest (approximately 12 nm, [53]), the most e - cient (generating some 100 pN nm with almost 100% e ciency [52]), and the quickest (unloaded rotational velocity of approximately 17 r.p.s, [54]) rotary motor. All of these advantages make this system quite attractive for its use in hybrid nanodevices. ATP synthase is a large enzyme, which synthesizes ATP in the mitochondria. Similar enzymes can be found in other organisms, e.g. plant chloroplasts and bacterial cell membranes, with the latter being specifically appropriate for robust hybrid nanodevices. The structure of the protein comprises the actual engine (F1 unit) mounted on a ‘pedestal’ (F0 unit) as in Fig. 6.13 [55, 56].
Actin filament
Streptavidin
α3β3γ complex
His-tag
Coverslip coated with Ni-NTA
Fig. 6.13. Architecture of the F1 ATPase rotary motor anchored on a surface at the non-working end [56]
6 Nanoarrays |
111 |
Montemagno and co-workers’ crucial work [57] provided the proof of principle for the building of a hybrid nanodevice based on a rotary motor. Their hybrid nanodevice powered by a rotary molecular motor consisted of three major elements: (i) a microarray of a nano-sized nickel posts, fabricated by e– beam lithography; (ii) a thermostable form of Ni-selective F1–ATPase which selectively attach on the Ni nano–posts; and (iii) Ni nanopropellers (Ni rods) with functionalized surfaces that allow specific attachment of the lever of the motor. The design, the fabrication concept and the microarray organization of the hybrid nanodevice are presented in Fig. 6.14. Despite the low fabrication yield (only 5 out of 400 propellers rotated) no backward steps have been observed, possibly due to the high ATP concentration. Also the device showed a 2.5 hours long endurance cycle. Subsequent work [58, 59] discussed the many engineering issues produced by the di cult interfacing between inorganic nano-engineered objects and very delicate proteins.
Fig. 6.14. Hybrid dynamic device in a microarray architecture. (A) Top view of the pole; (B) Molecular engineering of the rotary motor for anchoring on the surface and attachment of the Ni nanorod; (C) Top view of an array of Ni rods mounted on rotary motors; (D) Side view of a rotary motor mounted on a pole (Reprinted with permission from [57]. Copyright 2000 American Association for the Advancement of Science)
112 Dan V. Nicolau et al.
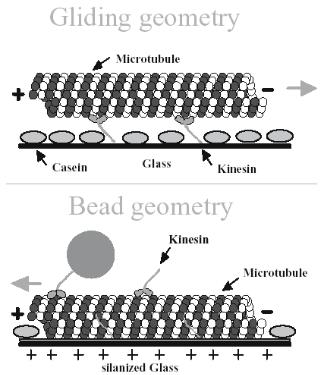
Fig. 6.15. Modes of operation of motility assays for linear molecular motors (Reprinted with permission from [60]. Copyright 2001 Academic Press Inc Elsevier Science)
Linear Motors
Apparently, linear motors have been studied more intensively than rotary ones because of the directed motion which can be used for transport of cargos. Linear motors are comprised of two protiens operating in tandem, i.e. the filament (F–actin or microtubules, MTs) and the motor (myosin, or kinesin, respectively). As mentioned before, motility assays are e ectively primitive hybrid dynamic nanodevices, which can have two generic architectures: (i) a gliding geometry with the surface functionalized with the motor protein and the filament/MT sliding atop, possibly carrying a fluorescent tag; or (ii) an inverted, or bead, geometry with the filaments/MTs immobilized on the surface and the motor proteins, which are immobilized on cargo beads, ‘walking’ on tracks. Fig. 6.15 [60] presents the two motility assay geometries for the kinesin/MT system. Motility assays, which have been proposed for almost 2 decades for both actin–myosin [61] and kinesin–MT [62] systems, are still the technological paradigm of hybrid dynamic nano–devices based on molecular
6 Nanoarrays |
113 |
motors due to their extreme ease of use and low cost. More advanced devices, however, will need to incorporate ‘smarter’ features.
The success of the future dynamic nanodevices based on linear molecular motors will depend on successful resolution of several technological problems:
(i) confinement of the movement of motile elements exclusively on fabricated paths; (ii) enforcement of unidirectional polarity of the movement; (iii) endurance of the devices; and (iv) appropriate applications and designs. The first technological barrier has been addressed in many studies in the last decade, in both motility assay architectures. The gliding motility assay architecture has been used more extensively due to easier fabrication, e.g. movement of actin or MT on motor-functionalized tracks [63–66] and channels [67–69]. The bead architecture has more operational potential because the unipolarity of the movement is naturally achieved through the built-in directionality information in the filaments/MTs. Fig. 6.16 presents a color encoded trajectory of actin filaments with movement confined in myosin-functionalized channels [67]. However, because the filaments/MTs have to be unipolarly aligned
– another di cult technological problem, the bead architecture is less successful, with the notable exception of a very early study at NRL [70]. The more di cult problem of unidirectional movement has been also recently addressed through the use of strong electric fields outside the flow cell [71] which enforce the movement of actin filaments in a preferential direction, and the use of arrow shaped channels [72] to favor the movement of MTs in one direction due to their relative rigidity. The third technological hurdle (device endurance) is very much modulated by the stability of the motor proteins, which are reputedly prone to denaturation following minute changes in carefully optimized bu er media. Many operational aspects of hypothetical biomolecular dynamic devices based on linear molecular motors have been recently comprehensively reviewed [60].
Possible Applications of Hybrid Dynamic Nano–Devices
in a Micro/Nanoarray Format
Whatever their future use, hybrid nano–devices based on rotary or linear molecular motors are likely to operate in largely parallel manner, with many individual ‘clusters’ of nano–devices organized in a microarray architecture. While the devices based on rotary motors have been already presented in a simple and explicit microarray format, the devices based on linear motors would raise interesting design issues. The possible applications for future dynamic nanodevices will use their natural functions, i.e. power generation and cargo transport, as their primary purposes or for di erent purpose, e.g. sensing and computation.
Power generation would be the most obvious application with both rotary and linear motors being in principle capable of inducing electric currents if a complex between the motile element and a metallic micro-sized object (a
114 Dan V. Nicolau et al.
rod or bead) is moving in the vicinity of an electric current capturing device (e.g. a metallic wire loop). Many elements of the devices proposed by Montemagno’s team prompt to this application (but not exclusively) with the rotary motor based devices already being organized in micro– and nanoarray formats (Fig. 6.13). An engineering study [73] tested the hypothesis of obtaining a reasonable electric current from an array of nano–electric generators, i.e. beads moved by actin–myosin system in microfabricated structures. It was found that, in an ideal situation, although the generated electric field is approximately a few tens of pV per bead, a purposefully designed array would amplify this to several nV – enough for micro-level local needs, e.g. powering electronic circuits.
A number of devices performing mechanical functions have been recently proposed by a group at University of Washington. A light-powered nano– assembly line uses molecular shuttles, which exploit UV-induced release of caged ATP combined with enzymatic ATP degradation, and which carry cargos along engineered paths [74]. Also a forcemeter capable of measuring the strength of biological receptor/ligand pairs i.e. pN forces, has been demonstrated [75]. The device is assembled from nanoscale building blocks, using a cantilevered MT as a beam of known sti ness, loaded by a second MT transported by kinesin.
Fig. 6.16. Confinement of the movement of actin filaments in channels (left) and color-coded trajectories of actin filaments (right: red and purple – start and end of sequence). (Adapted from [67]. Copyright 2002 Kluwer Academic Publishers)
6 Nanoarrays |
115 |
Imaging devices are another possible application. Vogel’s group proposed an imaging device based on the kinesin–MT system [76]. Information about surface properties such as topography is obtained by repeated acquisition of an optical signal from a large number of microscopic, self-propelled probes moving on random paths across a surface. Nicolau et al. [65] observed that the fluorescence of rhodamine-labelled actin filaments decreases when the filaments pass across hydrophilic (myosin-poor) surfaces. This system can be then used for the readout of encoded surface properties with nanometer precision.
Molecular motors based devices can be also used, in principle, for biosensing applications. If biomolecular recognition can induce a dramatic change in the movement characteristics of motile elements, e.g. motor functionalized beads, or antibody decorated filaments, then a very sensitive biosensing device is available. The detection of the movement characteristics can be detected by a giant magneto resistance (GMR) detector and integrated on a chip if the beads are magnetic. The sensitivity of such a device is also its drawback, especially in the context of the sensitivity of protein molecular motors to minute changes in environmental conditions. However, the major benefit of such biosensing molecular motors-based devices lies in the motility of the ‘molecular sensor’ which allows for improved process kinetics by adding a moving component to the otherwise di usion-limited tangent–probe binding process. This is especially important for detection of sensors aimed at highly toxic or pathogenic agents, where speed of detection is critical.
Finally, molecular motors based devices can be used for computation, in a similar, algorithmically–speaking, fashion as DNA computing. It has been recently proposed [77] that motile elements can explore in a highly parallel manner graphs that encode a mathematical problem. The most intuitive example would be to solve the travelling salesman problem in a maze that represents at a small scale the air paths in Adleman’s experiment.
6.5 Conclusion
We hope we have shown in this chapter that nanoarray technology opens many new fields for microarray industry in many ways. In the immediate to short term, static nanoarrays open the possibility of probing biomolecular recognition on an enormous scale and also at the single molecule level. DNA computation microarrays are possibly the best technological avenue for DNA computing, which in itself is a tremendous development. New possibilities, unforeseen at the moment, would be opened by the development of dynamic nanodevices working in a microarray architecture.
References
1.Dammel, R. Diazonaphthoquinone–based Resists; SPIE Tutorial Texts; SPIE: Bellingham, WA, 1993; Vol. 11, Chapter 1
2.Pirrung, M. C. Angew. Chem. Int. Ed. 2002, 41, 1276–1289
116 Dan V. Nicolau et al.
3.Lander, E. S. Nature Genet. 1999, 21, 3–4
4.Xia, Y.; Rogers, J. A.; Paul, K. E.; Whitesides, G. M. Chem. Rev. 1999, 99, 1823–1848
5.Geppert, L. IEEE Spectrum 1996, 33–38
6.Ivanova, E., Wright, J.P., Pham, D.K., Filipponi, L., Viezolli, A., Nicolau, D.V. Langmuir, 18, 9539–9546, 2002
7.Liu, G.-Y.; Xu, S.; Qian, Y. Acc. Chem. Res. 2000, 33, 457–466
8.Xu, S.; Liu, G. Langmuir 1997, 13, 127–129
9.Shoer, J. K.; Crooks, R. M. Langmuir 1997, 13
10.Bruckbauer, A.; Ying, L.; Rothery, A. M.; Zhou, D.; Shevchuk, A. I.; Abell, C.; Korchev, Y. E.; Klenerman, D. J. Am. Chem. Soc. 2002, 124, 8810–8811
11.Piner, R. D.; Zhu, J.; Xu, F.; Hong, S.; Mirkin, C. A. Science 1999, 283, 661–663
12.Hong, S. H.; Mirkin, C. A. Science 2000, 288, 1808–1811
13.Hong, S. H.; Zhu, J.; Mirkin, C. A. Langmuir 1999, 15, 7897–7900
14.Hong, S. H.; Zhu, J.; Mirkin, C. A. Science 1999, 286, 523–525
15.Piner, R. P.; Hong, S.; Mirkin, C. A. Langmuir 1999, 15, 5457–5460
16.Ivanisevic, A.; Mirkin, C. A. J. Am. Chem. Soc. 2001, 123, 7887–7889
17.Wilson, D. L.; Martin, R.; Hong, S.; Cronin-Golomb, M.; Mirkin, C. A.; Kaplan,
D.L. Proc. Natl. Acad. Sci. USA 2002, 98, 13660–13664
18.Demers, L. M.; Ginger, D. S.; Park, S.-J.; Li, Z.; Chung, S.-W.; Mirkin, C. A. Science 2002, 298, 1836–1838
19.Su, M.; Liu, X.; Li, S.-Y.; Dravid, V. P.; Mirkin, C. A. J. Am. Chem. Soc. 2002, 124, 1560–1561
20.Troughton, E. B.; Bain, C. D.; Whitesides, G. M.; Nuzzo, R. G.; Allara, D. L.; Porter, M. D. Langmuir 1988, 4, 365–385
21.Bain, C. D.; Whitesides, G. M. J. Am. Chem. Soc. 1989, 111, 7164–7175
22.Pique, A.; Chrisey, D. B., Eds. Direct–write technologies for rapid prototyping applications: sensors, electronics, and integrated power sources; Academic Press: San Diego, CA, 2002
23.Noy, A.; Miller, A. E.; Klare, J. E.; Weeks, B. L.; Woods, B. W.; DeYoreo, J. J. Nano Letters 2002, 2, 109–112
24.Lim, J. H.; Ginger, D. S.; Lee, K. B.; Heo, J.; Nam, J. M.; Mirkin, C. A. Angew. Chem. Int. Ed. Engl. 2003, 42, 2309–2312
25.Lee, K. B.; Lim, J. H.; Mirkin, C. A. J. Am. Chem. Soc. 2003, 125, 5588–5589
26.Lee, K.-B.; Park, S. J.; Mirkin, C. A. Science 2002, 295, 1702–1705
27.Vettiger, P.; Cross, G.; Despont, M.; Drechsler, U.; Durig, U.; Gotsmann, B.; Haberle, W.; Lantz, M. A.; Rothuizen, H. E.; Stutz, R.; Binnig, G. K. IEEE Transactions on Nanotechnology 2002, 1, 39–55
28.Chow, E. M.; Yaralioglu, G. G.; Quate, C. F.; Kenny, T. W. Appl. Phys. Lett. 2002, 80, 664–666
29.Sulchek, T.; Grow, R. J.; Yaralioglu, G. G.; Minne, S. C.; Quate, C. F.; Manalis,
S.R.; Kiraz, A.; Aydine, A.; Atalar, A. Appl. Phys. Lett. 2001, 78, 1787–1789
30.Degertekin, F. L.; Hadimioglu, B.; Sulchek, T.; Quate, C. F. Appl. Phys. Lett. 2001, 78, 1628–1630
31.Zhang, M.; Bullen, D.; Chung, S.-W.; Hong, S.; Ryu, K. S.; Fan, Z.; Mirkin, C. A.; Liu, C. Nanotechnology 2002, 13, 212–217
32.Thorsen, T.; Maerkl, S. J.; Quake, S. R. Science 2002, 298, 580–584
33.Storho , J. J.; Mucic, R. C.; Mirkin, C. A. J. Cluster Sci. 1997, 8, 179–216
34.Storho , J. J.; Elghanian, R.; Mucic, R. C.; Mirkin, C. A.; Letsinger, R. L. J. Am. Chem. Soc. 1998, 120, 1959–1964
6 Nanoarrays |
117 |
35.Niemeyer, C. M.; Burger, W.; Peplies, J. Angew. Chem. Int. Ed. 1998, 37, 2265– 2268
36.Niemeyer, C. M. Angew. Chem. Int. Ed. Engl. 2001, 40, 4128–4158
37.Park, S. J.; Taton, T. A.; Mirkin, C. A. Science 2002, 295, 1503–1506
38.Haes, A. J.; Van Duyne, R. P. J. Am. Chem. Soc. 2002, 124, 10596–10604
39.Taton, T. A.; Lu, G.; Mirkin, C. A. J. Am. Chem. Soc. 2001, 123, 5164–5165
40.Taton, T. A.; Mirkin, C. A.; Letsinger, R. L. Science 2000, 289, 1757
41.Parak, W. J.; Boudreau, R.; Le Gros, M.; Gerion, D.; Zanchet, D.; Micheel, C. M.; Williams, S. C.; Alivisatos, A. P.; Larabell, C. Adv. Mater. 2002, 14, 882–885
42.Demers, L. M.; Park, S. J.; Taton, T. A.; Li, Z.; Mirkin, C. A. Angew. Chem. Int. Ed. Engl. 2001, 40, 3071–3073
43.Adleman, L. M. Molecular computation of solutions to combinatorial problems. Science 1994, 266, 11 November
44.Lipton, R. J. DNA solution of hard computational problem. 1995, Science 268, 28 April
45.Ouyang, Q.; Kaplan, P. D.; Liu, S.; Libchaber, A. DNA solution of the maximal clique problem. Science 1997, 278, 17 October
46.Liu, Y., Xu, J. Pan, L., Wang, S. DNA Solution of a graph coloring problem. J. Chem. Inf. Comput. Sci. 2002, 42, 524–528
47.Smith L. M, Corn R. M, Condon A. E, Lagally M. G, Frutos A. G, Liu Q, Thiel A. J. A surface–based approach to DNA computation. J Comput Biol. 1998 Summer, 5(2):255–67
48.Frutos, A. G., Smith, L. M., and Corn, R. M. (1998) Enzymatic ligation reactions of DNA “words” on surfaces for DNA computing. J. Am. Chem. Soc. 120, 10277– 10282. York, Vol. 1
49.Liu, Q, Wang, L., Frutos, A. G., Condon, A.E. Corn, R. M. Smith, L. M. DNA computing on surfaces. Nature, Vol. 403, 13 Jan 2000 175–178
50.Sch¨oning, U. in Proc. 40th Ann. IEEE Conf. Found. Comp. Sci. (FOCS) 410–414 (IEEE Comp. Sci., Los Alamitos, California, 1999)
51.Ogihara M. Ray, A. DNA computing on a chip. Nature Vol 403, 143–144, 2000
52.Kinosita Jr, K., Yashida, R., Noji, H., Ishiwata, S., Yoshida, M. Cell 93, 21 (1998)
53.Noji, H., Yasuda, R., Yoshida, M., Kinosita Jr, K., Direct observation of the rotation of F1ATPase. Nature, 386, 299–302, 1997
54.Bachand, G.D. Montemagno, C. D. Constructing Organic/Inorganic NEMS Devices Powered by Biomolecular Motors. Biomedical Microdevices 2:3, 179–184, 2000
55.Yoshida M, Muneyuki E, Hisabori T. ATP synthase–a marvelous rotary engine of the cell. Nat Rev Mol Cell Biol. 2001 Sep;2(9):669–77
56.Noji H, Yasuda R, Yoshida M, Kinosita K Jr. Direct observation of the rotation of F1-ATPase. Nature, 1997, 386 :299–302.
57.Soong, R.K., Bachand, G.D., Neves, H.P., Olkhovets, A.G., Craighead, H.G., Montemagno, C.D. Powering a nanodevice with a biomolecular motor. Science, 290, 1555–, 2000
58.Bachand, G.D. Montemagno, C. D. Constructing Organic/Inorganic NEMS Devices Powered by Biomolecular Motors. Biomedical Microdevices 2:3, 179–184, 2000
59.Soong, R.K., Neves, H.P., Schmidt, J.J., Bachand, G.D., Montemagno, C.D.
Engineering Issues in the fabrication of a hybrid nano–propeller system powered by F1–ATPase, Biomedical Microdevices, 3:1, 71–73, 2001
118 Dan V. Nicolau et al.
60.Hess H, Vogel V. Molecular shuttles based on motor proteins: active transport in synthetic environments. J Biotechnol. 2001 Nov; 82(1):67–85
61.Yanagida, T., Nakase, M., Nishiyama, K. & Oosawa, F. (1984). Direct observation of motion of single F–actin filaments in the presence of myosin. Nature 307, 58–60
62.Spudich, J. A., Kron, S. J. & Sheetz, M. P. (1985) Nature, 315, 584–586
63.Suzuki, H., Oiwa, K., Yamada, A., Sakakibara, H., H. Nakayama and Mashiko
S.1995. Linear arrangement of motor protein on a mechanically deposited fluoropolymer thin film. Jpn. J. Appl. Phys. 34:3937–3941
64.Suzuki, H., Yamada, A., Oiwa K., H. Nakayama and S. Mashiko. 1997. Control of actin moving trajectory by patterned poly(methylmethacrylate) tracks. Biophys.
J.72:1997–2001
65.Nicolau, D.V., Suzuki, H., Mashiko, S., Taguchi, T., Yoshikawa, S. Movement of actin filaments on microlithographically–functionalized myosin tracks. Biophysical Journal, 77 (2), 99044–99065, 1999
66.Dennis, J. R., Howard, J. & Vogel, V. (1999). Molecular shuttles: directing the motion of microtubules on nanoscale kinesin tracks. Nanotechnology 10, 232–236
67.Mahanivong, C., Wright, J. P., Kekic, M., Pham, D. K., dos Remedios, C., Nicolau, D.V. Manipulation of the Motility of Protein Molecular Motors on Microfabricated Substrates. Biomedical Microdevices 4(2): 111–116; 2002
68.Clemmens, J.; Hess, H.; Howard, J.; Vogel, V. Analysis of Microtubule Guidance in Open Microfabricated Channels Coated with the Motor Protein Kinesin. Langmuir; 2003; 19(5); 1738–1744
69.Bunk, R., Klinth , J., Rosengren , J., Nicholls, I., Tagerud, S., Omling, P., Mansson, A., Montelius, L. Towards a ‘nano–tra c’ system powered by molecular motors. Microelectronic Engineering 67–68 (2003) 899–904
70.Turner, D. C., Chang, C., Fang K., S. L. Brandow and D. B. Murphy. 1995. Selective adhesion of functional microtubules to patterned silane surfaces. Biophys.
J.69:2782–2789
71.Riveline, D., Ott, A., Julicher, F., Winkelmann, D. A., Cardoso, O., Lacapere,
J.J., Magnusdottir, S., Viovy, J. L., Gorre-Talini, L. & Prost, J. (1998). Acting on actin: the electric motility assay. Eur Biophys J 27, 403–8
72.Hiratsuka, Y., Tada, T., Oiwa, K., Kanayama, T., Uyeda, T.Q. P. Controlling the Direction of Kinesin–Driven Microtubule Movements along Microlithographic Tracks. Biophysical Journal, 81 2001 1555–1561
73.Fulga, F., Myhra, S., Nicolau, Jr. D. V., D.V. Nicolau, Interrogation of the dynamics of magnetic microbeads on the meso–scale via electromagnetic detection. Smart Materials & Structures, 11 (5) 722–727, 2002
74.Hess, H., Clemmens, J., Qin, D., Howard, J. & Vogel, V. (2001). Light–Controlled Molecular Shuttles Made from Motor Proteins Carrying Cargo on Engineered Surfaces. Nano Letters 1, 235–239
75.Hess, H.; Howard, J.; Vogel, V. A Piconewton Forcemeter Assembled from Microtubules and Kinesins. Nano Lett. 2002; 2(10); 1113–1115
76.Hess, H.; Clemmens, J.; Howard, J.; Vogel, V. Surface Imaging by Self–Propelled Nanoscale Probes. Nano Lett. 2002; 2(2); 113–116
77.Nicolau, D. V., Jr.; Nicolau, D. V. Computing with the Actin–Myosin molecular motor system. In Biomedical Applications of Micro– and Nanoengineering. Nicolau, Dan V. (Ed.) SPIE Proc. 4937, 219–225, 2002

7
The Use of Microfluidic Techniques
in Microarray Applications
Piotr Grodzinski, Robin H. Liu, Ralf Lenigk, and Yingjie Liu
7.1 Introduction
The area of hybridization arrays enjoyed unprecedented growth in the last decade [1,2]. These arrays, allowing for a highly parallel analysis of a multitude of single-stranded DNA fragments, found use in many di erent areas, ranging from microscale sequencing and cDNA expression microarrays for analysis of gene expression [3, 4] to drug discovery and development [5] and single nucleotide polymorphism (SNP) analysis [6].
Conventional DNA microarray chips are still hampered, however, by numerous imperfections. They usually use sizable sample volumes of 200 l, which prohibits evolution towards further chip miniaturization. Current onchip hybridization assays take several hours to be completed, since the majority of them rely solely on di usion to control the reaction kinetics. Finally, most of the available array chips are not equipped with on-chip sample preparation provision, therefore requiring elaborate robot-based sample preparation using traditional bench techniques. Slow reaction kinetics and lack of integrated sample preparation prohibits further penetration of the microarray technology into diagnostic applications.
The recent, rapid developments in chip micro-fabrication technologies and microfluidics provide potential for elevating many of current deficiencies of microarray techniques. Microfluidic chips (also called “lab chips”) contain interconnected fluidic microchannel networks, reaction chambers, mixers, and valves, and can carry out conventional biochemical measurements with increased speed and reliability [7]. They have the capacity to improve reaction kinetics with the use of target stirring or mixing techniques, thereby allowing expansion to high throughput analysis. Also, with the incorporation of micro–Total Analysis Systems ( TAS) on the chip, they have the potential to integrate front-end sample preparation with back-end hybridization detection stages.
In this chapter, we will discuss chip technologies developed at Motorola Labs and address the use of microfluidics in conjunction with microarray
120 P. Grodzinski et al.
hybridization detection techniques. We will cover three general areas pertinent to 1) multi-sample analysis in ‘biochannel’ devices, 2) improvement of reaction kinetics using acoustic microstreaming target mixing and target oscillation in the biochannel, and 3) integration of on-chip PCR amplification to bring sample preparation and hybridization detection into a single chip.
7.2 Biochannel Hybridization Arrays
Conventional DNA hybridization assays rely solely on the di usion of target to surface-bound probes. This di usion limitation of the reaction leads to hybridization times on the order of 3 to 12 hours, depending on the size and concentration of the target and on the hybridization conditions. While amplification of genetic material has become faster with the development of rapid micro-system PCR cycling methods [8–10], detection is still hampered by the slow process of DNA hybridization. It has been recognized that mixing is important to achieve maximum rates of hybridization [11] and various methods have been devised to accelerate this process. They include electronic enhancement of DNA hybridization [12, 13], dynamic DNA hybridization using paramagnetic beads [14,15], rotation of the whole device [16], and the use of a micro porous three–dimensional biochip with the hybridization solution being pumped continuously through it [17].
While ultra-high density arrays are powerful tools for expression analysis studies, highly parallel low or medium density arrays will be useful in many other applications such as clinical diagnostics and pharmacogenomic applications based on genotyping and SNP scoring. Therefore, the ability to perform massively parallel assays with only a few micro–liters of sample/reagent per assay would provide substantial time and cost savings, and hence is highly desirable. The ‘biochannel’ approach presented here addresses these points: it enables the simultaneous analysis of a multitude of samples at a time, requires only small sample volumes, improves hybridization kinetics, and provides ease of integration with other micro-fluidic device components. Fig. 7.1 depicts the ‘working space’ for biochannel devices, plotted as number of samples versus number of targets analyzed within one chip. Biochannel structures o er distinct advantages for analysis of a large number of di erent samples in the array environment, with a low to medium density of detection probes.
Two di erent sets of chips have been prepared: 1) plastic, multi-channel arrays for multi-sample analysis with optical detection schemes [18–20] and 2) hybrid arrays for single sample analysis used for studies of reaction kinetics with electrochemical detection schemes [20].
7.2.1 Biochannel Devices with Optical Detection
The first generation of multi-channel arrays was built using microfabricated PDMS networks containing channels which were 200 m wide, 50 m
7 The Use of Microfluidic Techniques in Microarray Applications |
121 |
Fig. 7.1. Operational space for biochannel devices
deep, and few centimeters long [18,19]. These channel networks, fabricated using a molding process [21, 22], were then aligned and bonded to CodeLinkTM glass-based microarray slides (developed by Motorola Life Sciences, currently part of Amersham Biosciences operation) to form a closed channel array. The flat glass slide was coated for the immobilization of oligonucleotides (SurModics, Eden Prairie, MN) and spotted with DNA oligonucleotide probes (100 m diameter). A selective oxygen plasma surface treatment and bonding/alignment technique was developed to obtain a robust but reversible bonding between the PDMS and microarray glass chip. Although this fabrication approach was easy to implement, its yield was low due to channel–to–channel cross–talk. Accurate alignment of the chip and the channel network were also di cult.
Fig. 7.2. Evolution of the fabrication process for biochannel devices, (a) oligo probes are spotted on the flat surface and overlaid with PDMS channel network,
(b) oligo probes are spotted into the channels directly and overlaid with flat cover piece

122 P. Grodzinski et al.
In order to avoid the above deficiencies, we have modified the fabrication procedure and used hot embossing to create channel networks in polycarbonate (1 × 3 inch format) first. The evolution of the fabrication method is depicted in Fig. 7.2. The surface of the channels was functionalized for the immobilization of oligonucleotides with a photo-reactive bi-functional linker molecule that formed a covalent bond with the plastic substrate, the other end carrying a succinimide group which readily reacts with amino-terminated oligonucleotides. Oligonucleotide probes (Operon Technologies, Alameda, CA) were spotted into these channels using contact printing (‘Spotbot’, Telechem, Sunnyvale, CA). To demonstrate the ability of the biochannel device to simultaneously analyze several samples at once, a detection assay for surrogates (due to safety concerns) of pathogenic bacteria strains (E. coli, S. epidermidis, E. faecalis and S. salivarius) was performed (Table 7.1). Unique sequences for identification of the organisms were found and primer sets were developed to allow specific amplification. Several probes were evaluated for each amplicon and those with the best performance were selected (results not shown). After immobilization of the oligonucleotide probes, the channels were sealed using tape into which inlet and outlet ports had been cut using a computer controlled CO2 laser tool (Universal Laser Systems, Scottsdale, AZ).
Table 7.1. Nosocomial etiologic agent surrogate genetic targets
Agent |
Surrogate |
Strain |
Genetic |
Relevant |
Amplicon |
|
|
|
Targets |
Characteristics size |
|
|
|
|
|||
Staphylococcus Staphylococcus ATCC |
ArgABC AA uptake |
371 |
|||
aureus |
epidermidis |
14990 |
|
|
|
Enterococcus |
Enterococcus |
ATCC |
DnaE |
DNA |
195 |
faecalis |
faecalis |
19433 |
|
replication |
|
Streptococcus |
Streptococcus |
ATCC 9758 Dal |
D-Ala Ligase |
293 |
|
Group B |
salivarius |
|
|
|
|
Escherichia |
Escherichia |
DH5α(pBS) bla |
AmpR |
627 |
|
coli |
coli K12 |
|
|
|
|
|
|
|
|
|
|
To generate the samples, an aliquot of 10,000 bacteria cells was asymmetrically amplified using a ratio of 1:100 of forward to fluorescent (Texas Red R ) reverse primer. The PCR mixture contained 0.005 M forward and 0.5 M reverse primer, 400 M dNTP, 80 mM KCl, 16 mM Tris–HCL (pH 8.3), 2.5 mM MgCl2, and 0.05 U/ l Taq polymerase. Cycling parameters were: 35 cycles (94◦C for 60 seconds, 55◦C for 60 seconds, 72◦C for 60 seconds), ending with 72◦C for 6 minutes to extend all unfinished DNA strands. One PCR amplification product was introduced in each channel, and after a washing step the tape cover was removed and the bottom of the channels scanned in a commercial laser scanner (GeneScan 4000, Axon, Union City, CA).
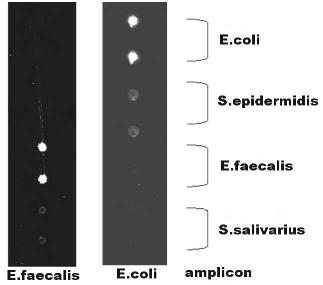
7 The Use of Microfluidic Techniques in Microarray Applications |
123 |
The results of the hybridization in biochannel devices with single-stranded amplicon are shown in Fig. 7.3, which presents the fluorescent scanner image of two adjacent channels that have been hybridized with samples obtained by PCR amplification of E. coli and E. faecalis samples. Probes for each of the pathogenic bacteria surrogate strains were printed in duplicate, with all channels being treated identically. The mainly single-stranded amplification product of the PCR was hybridized directly to the channel network, without the addition of hybridization bu er. The salinity was only one–tenth of conventional hybridization solutions, which have a salinity of at least 0.5 M. Although slow hybridization would be expected under these low-salt conditions, the salinity was su cient to produce intense, specific hybridization signals in only 30 minutes.
Fig. 7.3. Fluorescent scanner image of two biochannel device channels after hybridization. The left channel has been hybridized to amplicon obtained with a PCR from E. faecalis, the right channel with E. coli amplicon
7.2.2 Biochannel Devices for Electrochemical Detection – Reaction Kinetics Studies
In order to evaluate the kinetics of hybridization in the biochannel devices, we chose to use electrochemistry-based single-nucleotide polymorphism (SNP) detection arrays (eSensorTM) from Motorola Life Sciences [24]. The use of a homogenous assay allowed for continuous measurement of DNA hybridization.
124 P. Grodzinski et al.
The channel network made of double-sided tape was placed over eSensorTM array chips. To accelerate hybridization, a pump was integrated into the device. The pump consisted of a thin-film heater evaporated onto the plastic cover of the chip, in contact with an air–pocket. Cyclical heating and cooling of this air volume resulted in pumping of the hybridization solution inside the channel to overcome the di usion-limited reaction.
ESensorTM chips for the experiments were provided by Motorola (Motorola Life Sciences, Pasadena, CA). The chips had 16 electrodes, with electrodes 1–4 and 13–16 containing identical probes and the remaining electrodes containing negative controls. The channels were made in 200 m thick double-sided adhesive tape with a Teflon R core (Fralock, Canoga Park, CA). The tape was patterned by a computer-controlled CO2 laser tool. The channel was covered by a 500 m thick polycarbonate slide, into which inlet and outlet holes had been drilled. The heater for the integrated air pump was made by vacuum– evaporation of a platinum–film onto the polycarbonate piece. Contact to the heater coil was made by clamping wires onto the metal film. A conventional low-voltage power supply was used to manually operate the heater.
An assay for the detection of single-nucleotide polymorphisms in HFE–H gene was used as the model assay. To generate the samples, 100 ng of human genomic DNA (Clontech, Palo Alto, CA) was asymmetrically amplified using a set of three primers with a final concentration of 0.5 M each primer, 400 M dNTP, 50 mM KCl, 10 mM Tris–HCL (pH 8.3), 2 mM MgCl2, 0.05 U/ l Taq polymerase, and 100 g/ml bovine serum albumin. Cycling parameters were: 95◦C (3 minutes) to denature human DNA, followed by 40 cycles (94◦C for 45 seconds, 58◦C for 55 seconds, 72◦C for 60 seconds), and ending with 72◦C for 6 minutes to extend all unfinished DNA strands. The PCR–product was mixed with signaling probes in hybridization bu er (Motorola Life Sciences, Pasadena, CA) in a ratio of 1:2. The hybridization cocktail was manually filled into the channel. For the devices containing an integrated pump, the pump was switched on and o in regular time intervals of 3 minutes. The di usion-controlled experiments were carried out in commercial eSensorTM cartridges (Motorola Life Sciences, Pasadena, CA) with an internal volume of 65 l. All hybridizations were performed at room temperature, with devices placed horizontally. The signals were read using a Hydra R 600 instrument (Motorola Life Sciences, Pasadena, CA) using eSensorTM software (Motorola Life Sciences, Pasadena, CA); the AC voltammetry technique to gather the electrochemical signal is described in more detail elsewhere [24].
Figure 7.4 shows fabricated eSensorTM biochannel devices inside electrical connectors. Figure 7.4a depicts the device used for di usion controlled experiments, and Fig. 7.4b shows the device with an integrated electrical heating coil, consisting of a metal–film evaporated onto the area of polycarbonate cover in contact with an air–pocket inside the channel. The total channel volume is 25 l. When voltage is applied to the heater, the air pocket expands, pushing the hybridization solution through the channel and into a reservoir. Care must be taken to prevent the liquid from being pushed too far, which
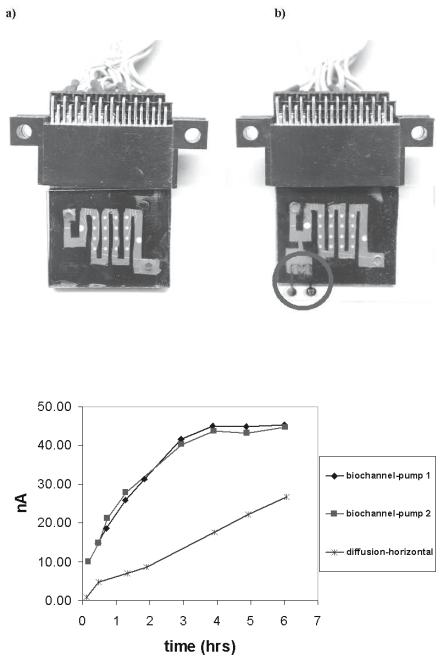
7 The Use of Microfluidic Techniques in Microarray Applications |
125 |
Fig. 7.4. ESensorTM chip covered with biochannel microfluidic channels (a) and biochannel with integrated air-pump (b) to allow for oscillation of the hybridization mixture
Fig. 7.5. Comparison of hybridization kinetics in biochannel with integrated pump and di usion-controlled hybridization chamber
126 P. Grodzinski et al.
would expose the electrodes to air. By repeatedly switching the power on and o , fluid oscillation can be achieved. Due to the slow actuation process of the pump, the chosen oscillation frequency was 0.167 Hz for one expansion/contraction cycle, corresponding to a mass–flow rate of 0.4 l / sec. The results for the genotyping experiment using target obtained by PCR amplification of human genomic DNA are shown in Fig. 7.5. All values are mean values from 4 electrodes in the same device. Because of the homogenous nature of the assay, results were obtained at di erent time points to monitor hybridization kinetics. In the di usion-controlled device, the signal increased linearly, and equilibrium was not achieved within the time–frame of the experiment. The rates of hybridization in the pumped biochannel devices were much higher, reaching steady–state after 4 hours. Using the rate definition adopted from reference [24], which compares the time required to achieve half of the saturation (maximum) signal, we conclude that the hybridization process is accelerated 6–fold in biochannel devices as compared to di usion driven chips. Moreover, in the pumped devices, the first measurement point taken immediately after filling the device already shows a signal of 10 nA, corresponding to a S/N value of over 20, already su cient to determine the genotype with a high level of confidence. This large signal at the first time– point is likely to be due to the passing of target molecules in close proximity to the surface-bound probe molecules during the loading process, with subsequent rapid hybridization.
7.2.3 Simulation of Hybridization Biochannel Reactors
Hybridization assays in a given reactor depend on a number of parameters related to probe and target characteristics (length, concentration, binding rates, surface immobilization characteristics), and parameters related to physical reactor design (size, shape, probe patch locations, sample motion, di usion lengths etc). Assessing the e ects of these di erent parameters on the hybridization rates using experiments can be a challenging task. With proper physical inputs, simulations can provide very detailed information on the physical and chemical aspects of a given reactor, allowing one to predict reaction performance, assess e ects of di erent physical strategies (e.g. mixing, oscillating sample) and allow pre-fabrication optimization of a given reactor design. CFD–ACE+, an advanced multiphysics solver [25], was used to perform coupled flow and chemistry simulation of hybridization reactors. The detailed set of equations and simulation procedures is given in reference [20]. Here, we present only the results relevant to assessing a relationship between the target oscillation within the channel, target concentration, and reaction kinetics. These biochannel simulation results are compared with those obtained for bulk, static (di usion-controlled) hybridization reactors.
In Fig. 7.6, the normalized surface target concentration histories are plotted for each of the individual reactors. Figures 7.6a, 7.6b and 7.6c show the hybridization behavior for 10 nM, 1 nM and 0.1 nM sample target concen-
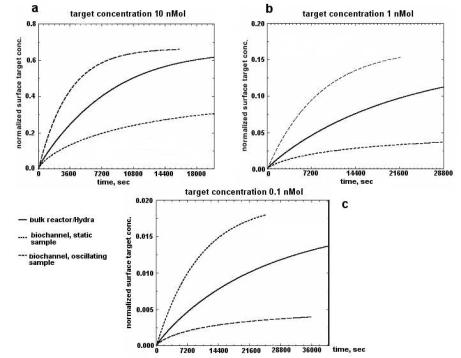
7 The Use of Microfluidic Techniques in Microarray Applications |
127 |
trations, respectively. A comparison of Fig. 7.6a to Fig. 7.6c reveals that increasing the sample target concentration speeds up the surface reaction in all of the configurations. At all sample concentrations, the static biochannel device exhibits the slowest hybridization rates. This result is expected for two reasons. First, the transport of sample targets to the probes is controlled by di usion. Second, and more importantly, the channel configuration limits the amount of targets that are easily accessible to each of the probe sites. The bulk reactor, which is also a di usion-dominated device, shows a better performance, while the device with the oscillating sample provides for the best hybridization performance. This result is as expected, since convection provides a faster means of transporting the targets to the surface. One of the findings from these simulations is that at the highest concentrations, the bulk reactor hybridization rates approach those for the oscillating biochannel device. This indicates that at higher target concentrations, the overall rates of hybridization may be governed more by chemical kinetics at the surface than by the e ciency of transport of target species to the surface.
Fig. 7.6. Time-variation of the surface-bound target for three di erent types of hybridization reactors, (a) at 10 nMol target concentration, (b) at 1 nMol target concentration, (c) at 0.1 nMol target concentration
128 P. Grodzinski et al.
7.3 Chips with Cavitation Microstreaming Mixers – Kinetics Studies
The biochannel oscillation technique discussed in the previous section was successfully applied to the improvement of hybridization kinetics. This technique is limited, however, to lowand medium-density 1–dimensional arrays. We have also developed a more general mixing technique which can be used on 2–dimensional arrays of any size. This technique relies on the principle of cavitation microstreaming [26] and has many advantages over most existing techniques used for hybridization enhancement, including simple apparatus, ease of implementation, low power consumption ( 2 mW), and low cost.
The mixing enhancement was tested using dye experiments, and the technique was subsequently used to enhance DNA hybridization in both optical detection-based and electrochemical detection-based DNA microarray chips [27, 28].
7.3.1 Theory of Cavitation Microstreaming
An air bubble in a liquid medium can act as an actuator (i.e., the bubble surface behaves like a vibrating membrane) when it is energized by an acoustic field. The behavior of a bubble in a sound field is determined largely by its resonance characteristics. For frequencies in the range considered here ( kHz), the radius of a bubble at resonant frequency f is given by:
2πaf = |
3γP0/ρ |
(7.1) |
where a is the bubble radius, γ is the ratio of specific heats for the gas, P0 is the hydrostatic pressure and ρ is the density of the liquid.
When a bubble undergoes vibration within a sound field, the frictional forces generated at the air/liquid interface induce a bulk fluid flow around the air bubble, called cavitation microstreaming or acoustic microstreaming [26]. It was found that cavitation microstreaming is orderly at low driving amplitudes when the insonation frequency drives the bubbles at their resonance frequency for pulsation and when the bubbles are situated on solid boundaries. Bubble-induced streaming is strongly dependent on frequency for a given bubble radius, and on bubble radius for a given frequency. Acoustic microstreaming arising around a single bubble excited close to its resonance frequency produces strong liquid circulation flow in the liquid chamber. This liquid circulation flow can be used to e ectively enhance mixing beyond the di usion-limited process.
Although cavitation microstreaming has been studied since the 1950s [29, 30], we have not found any report on the use of this phenomenon to enhance micromixing. One challenge here is to precisely control the size of the air bubbles. In this work, we have developed an air bubble trapping design using micromachined air pockets for mixing enhancement.
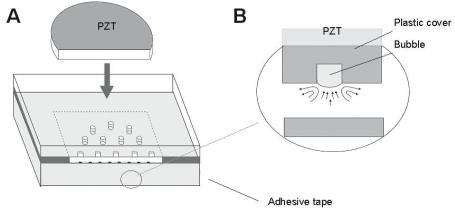
7 The Use of Microfluidic Techniques in Microarray Applications |
129 |
7.3.2 Proof–of–concept Chips for Mixing Experiments
Practical embodiment of the chip capable of inducing acoustic microstreaming within the cavity is depicted in Fig. 7.7. The chamber is constructed by sealing a conventional DNA microarray glass chip with a polycarbonate cover layer using a double-sided adhesive tape (3 M, St. Paul, MN). The adhesive tape, with thickness of 200 m, serves as a spacing gasket to define the shape and dimension (16 × 16 mm) of the chamber. The cover layer has a desired number of air pockets distributed uniformly above the chamber with a pitch of 2 mm. The air pockets (500 m in depth and 500 m in diameter) were machined using a Prolight milling machine (Light Machines, Manchester, NH) and were used to trap air bubbles in the reaction solution. A piezoelectric (PZT) disk (15 mm diameter, APC Inc., Mackeyville, PA) was bonded on the external surface of the cover layer using a super glue (DuroTM Loctite Corp., Avon, Ohio).
In order to evaluate mixing e ciency, control experiments were performed using a colored dye. The chamber contents were irradiated with the sound generated by the PZT disk driven by a HP functional generator (Hewlett– Packard Co., Palo Alto, CA). Visual observations were made from above using a stereoscope. One–half of the chamber was filled with DI water and the other half with a red dye solution (a mixture of phenolphthalein and sodium hydroxide solution, both from Aldrich Chemical Co., Milwaukee, WI) in order to visualize motion of fluid elements in the chamber. The frequency employed was 5 kHz (square wave) with a peak–to–peak amplitude (Vpp) of 40 V.
The fluidic dye experiments showed that sonic irradiation caused little motion of the liquid if air bubbles were excluded from the chamber. However, with air bubbles that have a resonant frequency matching the insonation frequency induced by the PZT transducer, a gross liquid motion was seen to take place
Fig. 7.7. Schematic showing a chip realization of cavitation microstreaming phenomenon, (A) overview; (B) sideview
130 P. Grodzinski et al.
around individual bubbles. Since the top pockets were uniformly distributed above the chamber, the resulting cavitation microstreaming dominated the mixing in the whole chamber (16 × 16 × 0.2 mm). Complete mixing was achieved across the whole chamber within 6 seconds, while di usion-based mixing (i.e., without acoustic mixing) in the same chamber took approximately 8 hours to complete (considering di usion in lateral direction). Dye experiments were also performed to investigate the relationship between mixing rate and acoustic parameters. It was found that the use of square waves resulted in faster mixing then the use of sinusoidal waves at the same Vpp. Lower voltage amplitudes also resulted in less mixing enhancement. The most e ective mixing enhancement was provided by pulsation of a desired number of air bubbles having a size and resonant frequency selected in accordance with the insonation frequency induced by the PZT transducer (7.1). A more detailed discussion of these dye mixing experiments can be found in reference [28].
7.3.3 High density DNA Microarray Hybridization
High density DNA microarray hybridization experiments were performed to evaluate the e ect of mixing enhancement on hybridization e ciency and uniformity as compared to conventional di usion-based hybridization. A fluorescent detection-based microarray biochip consisting of a high density array of oligonucleotide probes dispensed on a 1 × 3 inch pre-treated glass slide (developed by Motorola Life Sciences, currently part of Amersham Biosciences operation) was used. Two di erent oligonucleotide probes (NEO and YJEK, both obtained from Operon Technologies Inc., Alameda, CA) and a positive control were arranged in a uniform pattern across the entire slide. Both NEO and YJEK are Cy3-labelled bacterial oligonucleotides. The sequence of the NEO probe is GCGTTGGCTACCCGTGATATTGCTGAAGAG with a 5 amine. The sequence of the YJEK probe is TTTGTAGATTAGCACTGGAACTGGCACCGC with a 5 amine. A 1 × 3 inch piece of double-sided adhesive tape with a thickness of 0.25 mm (3 M, St. Paul, MN) was cut into four 15 × 12 mm windows and used to bond a polypropylene cover layer to the glass slide. The tape also served as a spacing gasket to define the shape and dimension of the chambers on the glass slide. The polypropylene cover layer contained a number of uniformly distributed air pockets (500 m in depth and 500 m in diameter with a pitch of 2 mm) on the side facing the DNA array. A PZT disk (15 mm diameter) was glued on the outer surface of one chamber, in which cavitation microstreaming was implemented. Static di usion-based hybridization was performed as a control in one of the other three chambers on the same chip. During hybridization, a fluorescently-labelled oligonucleotide target solution (45 L) containing 50% formamide (Sigma Chemical Co., St. Louis, MI) and 10 nM Cy3 labelled NEOand YJEK-specific targets (Operon Technologies Inc., Alameda, CA) was loaded into each detection chamber. The PZT transducer was driven at 5 kHz (sinusoidal sound wave) and 10 Vpp. The
7 The Use of Microfluidic Techniques in Microarray Applications |
131 |
device was kept in a temperature-controlled chamber at 37 ◦C. Hybridization was carried out for 2 hours, after which the polypropylene layer was removed from the array glass slide, which was subsequently washed with TNT solution (TRIS/Sodium Chloride/Tween, from Sigma Chemical Co., St. Louis, MI) for 30 minutes at 42◦C and rinsed three times with water. The glass slide was then scanned using a microarray scanner (Axon Instruments, Inc., Union City, CA).
Cavitation microstreaming was implemented in one of the four chambers (each 15 × 12 × 0.25 mm) on a fluorescent detection based microarray biochip consisting of a high density array of two types of oligonucleotide probes (NEO and YJEK) and a positive control. The continuous repetition of the two probe oligonucleotides in a uniform pattern across the entire slide allowed for signal comparisons across the entire array area. This is critical in understanding the signal homogeneity. The resulting fluorescent scanning images are shown in Fig. 7.8. Fluorescent intensity data for the mixing-enhanced array and the static hybridization array (di usion-based) were analyzed. As shown in Figs. 7.9a and b, the average signal intensity of the mixing array is five times greater than that of the static hybridization array, and signal uniformity (co-variance) is also greatly improved by implementation of cavitation microstreaming. These results indicate that hybridization reactions in oligonucleotide array formats can generally be a ected by the level of mixing of the target ligand. E cient and e ective micromixing maximizes delivery of the sample targets to the array surface, and thus significantly improves hybridization e ciency and uniformity.
7.3.4 Hybridization Kinetics Study
An assay for single nucleotide polymorphisms (SNP) associated with hematochromatosis (HFE–H) was performed in an eSensorTM device (Motorola Life Sciences, Pasadena, CA) equipped for induction of cavitation microstreaming. The use of the eSensorTM device allowed for continuous measurement of DNA hybridization signals during the reaction due to the homogenous nature of the assay, thus allowing hybridization kinetics to be studied [20]. Each device consisted of a plastic cover layer assembled with a printed circuit board (PCB) chip with 16 detection electrodes. Four electrodes contained identical oligonucleotide probes for HFE–H gene while the remaining electrodes contained other probes and negative controls. The plastic cover layer contained a 4 × 4 array of air pockets (500 m in depth and 500 m in diameter) facing the DNA probes on the PCB substrate. A PZT disk was glued on the outer surface of the cover layer to induce cavitation microstreaming during the hybridization.
Target solution preparation and measurement protocols were the same as those described in section 7.2.2. The hybridization cocktail was loaded into the eSensor chip with an internal volume of 65 L. Hybridization was performed at 35◦C. During the hybridization process, the PZT was driven at 5 kHz and 10 Vpp (square sound wave). The signals were read using a
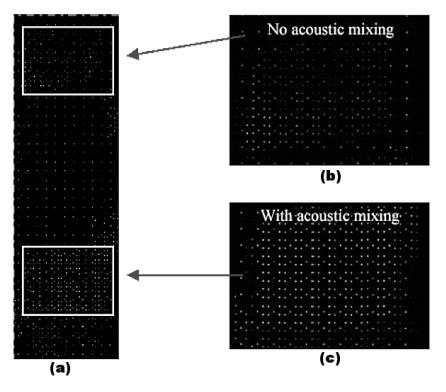
132 P. Grodzinski et al.
Hydra R 600 instrument (Motorola Life Sciences, Pasadena, CA). For comparison purposes, the same hybridization reaction was also performed in a conventional di usion-based eSensorTM chip using the same amplicon mixture. Hybridization kinetics as a function of acoustic amplitude (Vpp) were also studied using amplitudes of 5 Vpp and 40 Vpp, as compared to 10 Vpp, while maintaining the same frequency of 5 kHz.
Kinetic data from the genotyping experiments using target DNA obtained by PCR amplification of human genomic DNA were collected by monitoring the electrochemical signal as a function of time. Figure 7.10 summarizes the hybridization kinetics results for a mixing-enhanced device and a di usionbased device under the same assay conditions. The results show that in the static (di usion-based) device, the hybridization signal evolved slowly and increased linearly. Saturation of the hybridization signal was not achieved within the time frame of the experiment. Moreover, the standard deviation associ-
Fig. 7.8. (a) Fluorescent image of a 4-chamber, high density array, biochip after a 2-hour hybridization reaction. One chamber (15 × 12 × 0.25 mm) undergoes static hybridization (b), while hybridization in another chamber (15 × 12 × 0.25 mm) is aided with cavitation microstreaming (c)

7 The Use of Microfluidic Techniques in Microarray Applications |
133 |
Fig. 7.9. Numerical data gathered from fluorescent images shown in Fig. 7.8. (a) averaged fluorescent intensity of probes NEO in the mixing-enhanced array vs. static hybridization array, (b) uniformity of signal intensity of probes NEO for the mixingenhanced array vs. static hybridization array (note: 0% CV = fully uniform)
ated with each data point indicates that the static hybridization results in relatively large electrode–to–electrode variation. For the hybridization assay coupled with cavitation microstreaming, the signal increased more rapidly, and showed a much more uniform distribution (small standard deviations) compared to the pure di usion-based device. After 40 minutes of hybridization, the sample in the mixing-enhanced device reached a saturated current value. It took approximately 6 hours for the static sample to reach the saturated level (data not shown). If the relative rates of hybridization in the two devices are calculated as the ratio of the time it takes for the signal to reach
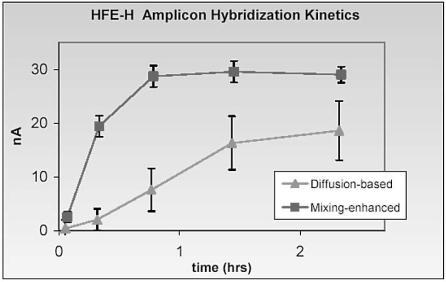
134 P. Grodzinski et al.
one–half of the saturated value [24], it can be seen that hybridization in the mixing-enhanced device occurs 5 times faster than in the di usion-based device.
Theoretically, the relative rate of hybridization in both devices can also be estimated from the ratio of the square of the di usion layer thickness in each device, since the di usion time constant is proportional to the square of the di usion length [31]. In such a di usion layer model, it is assumed that convection maintains the concentrations of all species uniform and equal to the bulk values up to a certain distance from the surface. Within the boundary layer, no solution movement occurs and mass transfer takes place by di usion. The thickness of the di usion layer on a flat surface in a static hybridization is assumed to be 50 m [24, 28], while the di usion layer on an acoustic microstreaming-enhanced surface is estimated to be 20 m using the steady oscillation model [32]. This theoretical ratio of 6.25 is in close proximity to the observed relative rate of hybridization. Moreover, the standard deviation of each data point in the mixing-enhanced assay is much smaller than that in the di usion-based assay, showing that cavitation microstreaming greatly enhances the uniformity of hybridization across the chip.
A mixing-enhanced hybridization can be treated as a three-step process: 1) transport of targets (via di usion and/or convection) in the solution to the di usion (stagnant) boundary layer; 2) transport (primarily di usion) of
Fig. 7.10. Hybridization kinetics study performed on static hybridization vs. mixing-enhanced hybridization (square sound wave, 5 kHz and 10 Vpp) using eSensorTM chips. Each data point is the mean value obtained from four electrodes with identical DNA capture probes in the same device
7 The Use of Microfluidic Techniques in Microarray Applications |
135 |
target within the di usion boundary layer to the probes on the chip surface; and 3) reaction of target with probes on the surface. Since the last step is a chemical process of association and dissociation at the surface on which extended research has been reported [33, 34], we have focused on the first two steps. Both fluidic and hybridization experiments have demonstrated that cavitation microstreaming not only provides rapid lateral mass transport of fluidic elements, but also enhances the vertical mass transport of target DNA in the solution. The combination of rapid lateral and vertical fluid movements results in rapid transport of targets in solution to the di usion boundary layer and thus allows for continuous replenishment of fresh DNA targets around probes that have been depleted of complementary targets. As a result, the hybridization rate is increased. Moreover, the rapid fluid movement associated with cavitation microstreaming in a shallow hybridization chamber reduces the thickness of the di usion boundary layer by 2.5–fold. Targets are therefore in closer proximity to the immobilized probes on the chip surface, resulting in faster hybridization due to shorter di usion lengths.
The rapid lateral fluidic movement, as observed in the fluidic dye experiments, also ensures a homogenous mixture of targets and su cient fluid exchange across the large surface area of the chip, thus allowing for uniform hybridization signals to be achieved. Uniformity of the hybridization signal is critical, especially for high density microarrays and/or for detection of lowabundance targets. Lack of lateral convection can lead to non-homogeneous array performance and hybridization di erences that are independent of differences in target concentration. Although the enhancement of hybridization rates using acoustic microstreaming is not as significant as that in the biochannel [20], flow–through [17], and electronic DNA [12, 13] devices, cavitation microstreaming has distinct advantages over the above methods, due to the rapid lateral mass transport that can be achieved, resulting in significantly enhanced uniformity of hybridization. Moreover, cavitation microstreaming requires a very simple mixing apparatus, and thus can easily be incorporated into most existing biochip devices.
7.4 Integrated Microfluidic Reactors
for DNA Amplification and Hybridization
The use of microfabrication technologies has created the potential to integrate biological sample preparation with DNA analysis in a single Lab–on–a–Chip device [35, 36]. The prospective goal is to fully integrate sample collection and pretreatment with the DNA extraction, amplification, and detection into a single microfluidic platform. The ability to perform all of the steps of the biological assay, in a single self-contained microchip, promises significant advantages in terms of speed, cost, sample/reagent consumption, contamination reduction, e ciency and automation [37, 38].
136 P. Grodzinski et al.
In recent years, developments in Lab–on–a–Chip technologies have been substantial. Previously, integrated micro devices with reagent mixing, enzymatic reactions, and DNA sizing by electrophoresis were demonstrated [39]. The integration of micro PCR with microchip capillary electrophoresis (CE) has also been developed [40, 41]. The devices reported by Burns et al. [42] were capable of metering aqueous reagents, mixing, amplification, enzymatic digestion, electrophoretic separation, and detection with no external lenses, heaters, or mechanical pumps. Other integrated devices, demonstrated by Sosnowski et al. [43], utilized electrical forces to accomplish such functions as cell separation, sample transport, hybridization acceleration, and denaturation. In another report [35], integrated monolithic genetic assay devices have been fabricated in polycarbonate to carry out serial and parallel multistep molecular operations, including nucleic acid hybridization. Recently, Taylor et al. [44] reported on devices capable of carrying out automated sample preparation followed by real time PCR detection of pathogens. Similarly, Wilding, Kricka and Fortina [45] have developed a prototype of an integrated semi-disposable microchip analyzer. The system, which is currently under further testing, is capable of cell separation and isolation, PCR amplification, and amplicate detection.
The overall performance of an integrated device does not depend only on that of its individual functional units, but also on that of the functional integration. As a result, microvalves have become critical components for the further development of Lab–on–a–Chip technology. Some very ingenious microvalves have been designed and built as alternatives to silicon based microvalves [46,47]. Electrokinetic valves have been successfully used for sample injection in microchip CE, on-chip fluid mixing, and dilution [36, 48]. Hydrophobic passive valves have been implemented in microfabricated centrifugal microfluidic systems [49]. Systems containing on–o valves and switching valves have been built in elastomeric materials by soft lithography [50]. Polymer monoliths containing grafted thermally responsive polymers have been thermally controlled to block or allow flow in micrometer size structures [51]. Various designs of hydrogel valves, which operate on the principle of hydrogel volume change with external stimuli, have enabled the fabrication of an organic microfluidic system [52]. Because of the unique valving requirements (high pressure, biocompatibility, and device complexity) for the integration of PCR and hybridization functionality, none of these valves could be implemented into our monolithic integrated devices.
7.4.1 Integrated Chip Design and Fabrication
Here [53], we discuss plastic, disposable devices capable of carrying out PCR amplification, hybridization, and hybridization wash assays. These microfludic devices were fabricated into polycarbonate plastic using CO2 laser machining. Reagent transport through the device was provided by syringe pumps, which were docked onto the device. Peltier thermal electrical devices powered
7 The Use of Microfluidic Techniques in Microarray Applications |
137 |
the heating and cooling functionality of the device. Oligonucleotide probes were deposited inside plastic hybridization channels using surface attachment chemistry and spotting techniques previously discussed in section 7.2.1. Novel Pluronics phase change valves accomplished the integration of such functional units as PCR amplification, hybridization and hybridization wash on the same device. An air permeable hydrophobic membrane valve was implemented into the device to allow for the flow of solution into the sealed hybridization chamber. All of the reagents needed for the assay were loaded into the device before the assay. Genomic DNA from the bacteria Escherichia coli K–12 (E. coli ) and Enterococcus faecalis (E. faecalis) were used to amplify the E. coli K–12 MG1655 gene (221 bp) and the E. faecalis DNAE gene (195 bp) by single or multiplex asymmetrical PCR (A–PCR) reactions. The single strand amplicons were hybridized to the detection probes inside the hybridization channel. The performance of each individual functional unit and that of the integrated system were tested.
7.4.2 Pluronics Phase Change Valves
Microvalves are critical to the successful integration of PCR amplification with DNA hybridization assays. Suitable microvalves have to meet a number of requirements. First, the valves must be able to withhold the pressure generated during the PCR reaction, caused by degassing and air expansion at elevated temperature. If the valve fails, the PCR sample will be pushed out of the PCR chamber, resulting in failed PCR reaction. The amount of pressure required to prevent degassing has been estimated by Chiou et. al. [54] to be about 3.1 psi. The evaluation was performed using solubility data for air in water and Henry’s law. The presence of an air gap between the PCR chamber and the valves will cause additional internal pressure build–up. Heating of this air gap will generate an additional 3.7 psi pressure at 94◦C (using the ideal gas law), therefore the valve must be able to withhold at least 6.8 psi total pressure to ensure the successful confinement of the PCR sample during thermal cycling. Second, because valves will be in direct contact with PCR solution, the valve material must not inhibit the PCR reaction. Third, the valve needs to be easily opened after the PCR reaction to allow PCR solution to flow into the hybridization channel.
Pluronics F127, a commercially available surfactant, is composed of uncharged (EO)106(PO)70(EO)106 triblock copolymers. Solutions of Pluronics within a concentration range of 18–30% are low viscosity liquids (< 2 poise) at low temperature (0–5◦C), but form self-supporting cubic liquid crystalline gels at room temperature [53]. Therefore, Pluronics solutions at the proper concentration can be used as one-shot, phase change valves. These one shot valves are initially closed and become permanently opened once activated by a lowering of the valve temperature below the Pluronics gel transition temperature. We have found that the presence of Pluronics molecules does not inhibit PCR reactions, and a 9 mm × 0.25 mm × 0.25 mm valve made of 30%
138 P. Grodzinski et al.
Pluronics in a polycarbonate channel can hold 20 psi pressure, well above the 6.8 psi generated during the PCR reaction. The advantages of Pluronics temperature transition valves are their simplicity of implementation and operation. Although in solid gel form, Pluronics gels are not cross–linked and can be easily injected into microfluidic structure to form one-shot valves using a preloaded syringe at room temperature.
7.4.3 Assay in an Integrated Reactor
Two genetic targets were asymmetrically amplified in the assays: E. coli K– 12 MG1655 gene (221 bp) and E. faecalis DNAE gene (195 bp). The A– PCR reaction mixture contained 10 mM Tris–HCl (pH 8.3), 50 mM KCl, 1.5 mM MgCl2, 0.001% gelatin, 250 g/mL bovine serum albumin, 125 M each deoxynucleotide triphosphate, 1.2 M reverse primer, 12 nM forward primer, 25 units/mL AmpliTaq, DNA polymerase (Perkin–Elmer), and E. faecalis or E. coli genomic DNA (50 pg/mL). The primer set used to amplify a 221 bp segment of E.coli gene target was 5 AAC GGC CAT CAA CAT CGA ATA CAT3 (forward) and 5 [cy3] GGC GTT ATC CCC AGT TTT TAG TGA3 (reverse). The probe used for hybridization was AAG CGA CAG TTC GGC TTC GTG NH2 3 . The primer set used to amplify E. faecalis gene was 5 GCC AGA TTT TTC GTT CGC TCA T3 (forward) and 5 [Cy3] AAA TCG GCA ACT TCT CGC TCA G (reverse). The probe used for hybridization is CGG AAG AAA GCT CTG AGC G NH2 3 . The probe for negative control was AGC TCA CGT GCC TGC AGA AG NH2 3 . All the oligo probes and PCR primers were ordered from Operon Technologies Inc. (Alameda, CA).
The integrated device is shown in Fig. 7.11. The device contains a PCR chamber (38 L), a hybridization channel (7 L), a syringe coupled to a hybridization wash solution channel (20 L), a waste channel coupled to a waste syringe, four Pluronics trapping reservoirs, one hydrophobic membrane valve, four Pluronics valves, seven reagent introduction holes, and three external syringe pump interface reservoirs. The dimensions of the device are 5.4 mm × 8.6 mm × 0.75 mm, and resemble that of a miniature credit card. The PCR chamber volume (38 L) is large relative to the current hybridization channel volume (7 L). But this volume can be utilized in a longer hybridization channel with a higher density array. The hybridization channel was designed to accommodate e cient dispensing of probes, using a SpotBotTM Personal Microarrayer. With this spacing, all 4 pins of the microarrayer were utilized, with no need for device position adjustment. It took the SpotBotTM about ten minutes to dispense 120 probes into the four channels. Pluronics valves were installed before any reagent solution was introduced into the device. The two Pluronics valves adjacent to the PCR chamber enclose the PCR solution during the reaction. The first Pluronics valve (V1) isolates the PCR chamber from the external pump, and the second Pluronics valve (V2) is located between the PCR chamber and the hybridization channel. The third
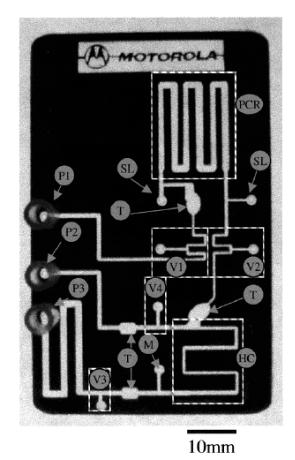
7 The Use of Microfluidic Techniques in Microarray Applications |
139 |
Pluronics valve (V3) is placed between the hybridization channel and the wash solution channel. The fourth Pluronics valve (V4) isolates the hybridization channel from the waste chamber. PCR mixture and hybridization wash solution were introduced into their corresponding chambers on the device prior to permanent sealing of all reagent access holes by application of 1 layer of adhesive tape and 1 layer of parafilm.
During PCR thermal cycling, only the PCR chamber portion of the device was sandwiched between Peltier thermal electric heating units. After PCR thermal cycling, the two Pluronics valves adjacent to the PCR chamber were cooled to 5◦C with a Peltier thermal electrical device, and the syringe
Fig. 7.11. Monolithic, integrated DNA assay device. Legend: Serpentine PCR channel (PCR), hybridization channel (HC), Pluronics valves (V1–4), Pluronic traps (T), Hydrophobic air permeable membrane (M), PCR reagent loading holes (SL), Sample driving syringe pump P1, waste withdrawing syringe pump (P2), wash syringe pump (P3)
140 P. Grodzinski et al.
pump (P1) was then used to push the Pluronics valve solution and PCR amplification solution toward the DNA hybridization channel. When Pluronics solution entered the Pluronics traps, located outside of the Peltier cooler zone, the Pluronics solution resolidified into a solid gel state and did not travel any further. This prevented the Pluronics gel from blocking the connecting channel to the hybridization chamber. The amplified PCR sample solution was then continuously pushed into the hybridization channel. The air permeable hydrophobic membrane vent at the end of the hybridization channel allowed air from the channel to flow out of the device, while sealing target solution that flowed into the channel. Because of the small dimension of the fluidic channel, target DNA molecules were confined in close proximity to the capture probes. Assuming a target di usion coe cient of 1.7 × 10⁻⁷ cm2/s, it was estimated that it would take only about 30 minutes for a 200 base target to reach capture probes from the top of the channel by di usion. We determined experimentally that one hour reaction time is su cient for detection of hybridization event. Further improvement of hybridization e ciency could be realized when in-channel target solution oscillation is implemented in the future design [20]. The Peltier device, underneath the hybridization chamber, was maintained at 50◦C during the one-hour hybridization reaction. After hybridization, valve three (V3) and valve four (V4) were opened by activation of the syringe pumps, P2 and P3. Since the pressure–holding requirement for V3 and V4 is not as high as for V1 and V2, V3 and V4 were designed to hold less pressure and allow activation by syringe pumps alone. The first 10 L of the wash solution was pushed into the hybridization channel, while the waste syringe withdrew the target solution. The next 10 L of the wash solution was left in the hybridization channel, to incubate for 20 minutes. The wash solution was manually removed by the waste syringe before scanning. We attribute the successful integration of multiple functions on a monolithic device to the implementation of the Pluronics valves. Plastic devices containing only fluidic channel structures are very inexpensive when produced in large quantities by injection molding. However, the cost of the device will increase if an additional complicated fabrication process is needed for addition of mechanical valves. The implementation of Pluronics phase change valves does not require additional fabrication steps and thus is desirable for low cost, disposable chip solutions. Since the device is preloaded with all of the necessary reagents needed for the assay, potential contamination from human interference is eliminated, and automation is made possible.
Three di erent types of probes (E. coli, E. faecalis, and control) were dispensed in four horizontal sections of the serpentine hybridization channel. The probe layout was identical in each of the four horizontal sections. Two sets of a 1 × 5 array of each type of probe was located in each horizontal channel section, with a total of eight sets in the entire serpentine hybridization channel. Assymetrical PCR protocol was used to produce single stranded DNA targets. Depending on which target DNA template molecules were present in the PCR chamber, the corresponding probe sites were detectable by fluores-
7 The Use of Microfluidic Techniques in Microarray Applications |
141 |
cence after successful hybridization. Figure 7.12a is the fluorescent image of the hybridization chamber, using the E. coli 221 bp gene as amplification target. Hybridization reactions occurred at the sites of E. coli probes. Two sets of hybridization sites were enlarged for better view. The fluorescent signals of corresponding probes in the same array were very uniform. Interestingly, the fluorescent background inside the fluidic channel is lower than that from the surrounding ridges. One possible explanation is that thermal bonding causes increased roughness at the bonding interface and therefore causes an increase in scattered light during scanning. These integrated devices were also tested
Fig. 7.12. PCR hybridization results from monolithic integrated device, (a) E. coli 221 bp hybridization after amplification. Portions of the biochannel were enlarged for better viewing, (b) Fluorescent image of portion of biochannel after E. fae amplification and hybridization, (c) Fluorescent image of portion of biochannel after multiplex (E. fae and E. Coli) amplification and hybridization
142 P. Grodzinski et al.
for E. faecalis gene (195 bp) amplification and detection, and for multiplex PCR (E. coli and E. faecalis) amplification and detection. All amplification and hybridization reactions were successful, as shown in Fig. 7.12(b,c).
7.5 Summary and Conclusions
Microarray hybridization technologies have become indispensable tools in the studies of gene mapping, gene expression, and single nucleotide polymorphisms. The microarray field has enjoyed tremendous progress in the last decade, resulting in successful commercialization of several chip approaches [1,2,12,13,17,24]. However there is still significant room for improvements, particularly in the areas of assay kinetics, on-chip sample preparation and further functional integration. These improvements will not only increase analysis throughput and reduce analysis cost, but will enable broadening of the practical applications to such areas as doctor’s o ce diagnostics, field environmental monitoring, and rapid biothreat recognition. A clever combination of existing microarray techniques and newly developing microfluidic chips promise powerful analytical solutions where high parallelism of sensing is complimented with high throughput, rapid assay kinetics and compact, portable instrumentation.
References
1.Fodor, S. P., Read, J. L., Pirrung, M. C., Stryer, L., Lu, A. T., Solas, D. (1991) Light–directed, spatially addressable parallel chemical synthesis. Science 251, 767–773
2.Schena, M. Microarray BiochipTechnology. Eaton Publishing: Natick, MA, 2000
3.Duggan, D. J., Bittner, M., Chen, Y., Meltzer, P., and Trent, J. M. (1999)
Expression profiling using cDNA microarrays. Nature Genetics 21, 10–14
4.Brown, P. O., and Botstein, D. (1999) Exploring the new world of the genome with DNA microarrays. Nature Genetics 21, 33–37
5.Debouck, C., and Goodfellow, P. N. (1999) DNA microarrays in drug discovery and development. Nature Genetics 21, 48–50
6.Hacia, J. G. (1999) Resequencing and mutational analysis using oligonucleotide microarrays. Nature Genetics 21, 42–47
7.Liu, R. H., Grodzinski, P. In Microfluidic and BioMEMS Applications; Tay, F. E. H., Ed.; Kluwer Academic Publishers: Boston, 2002, pp 143–184
8.Wittwer, C. T., Fillmore, G.C., Garling, D.J. (1990) Minimizing the time required for DNA amplification by e cient heat transfer to small samples. Anal Biochem 186, 328–331
9.Belgrader, P., Benett, W., Hadley, D., Richards, J., Stratton, P., Mariella Jr. , R., Milanovich, F., (1999) PCR detection of bacteria in seven minutes. Science, 284, 449–450
10.H¨uhmer, A. F. R. (2000) Noncontact infrared–mediated thermocycling for effective polymerase chain reaction amplification of DNA in nanoliter volumes. Analytical Chemistry 72, 5507–5512
7 The Use of Microfluidic Techniques in Microarray Applications |
143 |
11.Southern, E., Mir, K., and Shchepinov, M. (1999) Molecular interactions on microarrays. [Review] [37 refs]. Nature Genetics 21, 5–9
12.Edman, C. F., Raymond, D. E., Wu, D. J., Tu, E., Sosnowski, R. G., Butler, W. F., Nerenberg, M., and Heller, M. J. (1997) Electric field directed nucleic acid hybridization on microchips. Nucleic Acids Res 25, 4907–14
13.Radtkey, R., Feng, L., Muralhidar, M., Duhon, M., Canter, D., DiPierro, D., Fallon, S., Tu, E., McElfresh, K., Nerenberg, M., and Sosnowski, R. (2000)
Rapid, high fidelity analysis of simple sequence repeats on an electronically active DNA microchip. Nucleic Acids Res 28, E17
14.Fan ZH, M. S., Granzow R, Heaney P, Ho W, Dong Q, Kumar R. (1999) Dynamic DNA hybridization on a chip using paramagnetic beads. Anal Chem 71, 4851–4859
15.Fan, Z. H., Kumar, R. (2001) In Biochip Technology, Cheng, J., Kricka, L., Ed., Harwood Academic Publishers, Philadelphia, PA, pp. 291 – 307
16.Chee, M., Yang, R., Hubbell, E., Berno, A., Huang, X. C., Stern, D., Winkler, J., Lockhart, D. J., Morris, M. S., and Fodor, S. P. (1996) Accessing genetic information with high–density DNA arrays. Science 274, 610–4
17.Cheek, B.J., Steel, A.B., Torres, M.P., Yu, Y-Y., Yang, H. (2001) Chemiluminescence Detection for Hybridization Assays on the Flow–Thru Chip, a Three– Dimensional Microchannel Biochip. Anal Chem 73, 5777–5783
18.Liu, R. H., Chen, H., Luehrsen, K. R., Ganser, D., Weston, D., Blackwell, J., Grodzinski, P., In Technical Digest of International MEMS Conf., Interlaken, Switzerland, Jan. 21–25 2001; 439–442
19.Liu, R., Lenigk, R., Luehrsen, K. R., Yu, H., Chen, H., Ganser, D., Bonanno, J., Grodzinski, P., In Micro Total Analysis Systems 2001 ; Ramsey, J. M., Van den Berg, A., Eds.; Kluwer Academic Publishers: Monterey, CA, 2001, 465–467
20.Lenigk, R., Liu, R., Athavale, M., Chen, Z., Ganser, D., Yang, J., Rauch, C., Liu, Y., Chan, B., Yu, H., Ray, M., Marrero, R., Grodzinski, P. (2002) Plastic biochannel hybridization devices: A new concept for microfluidic DNA arrays. Analytical Biochemistry 311, 40–49
21.Jackman, R. J., Brittain, S. T., Adams, A., Prentiss, M. G., Whitesides, G. (1998) Design and Fabrication of Topologically Complex, Three–Dimensional Microstructures. Science 280, 2089–2091
22.Jo, B. H., Lerberghe, L. M. V., Motsegood, K. M., Beebe, D. J. (2000) Three– dimensional micro–channel fabrication in Polydimethylsiloxane(PDMS) elastomer. Journal of Micro–electro–mechanical Systems 9, 76–81
23.Umek RM, L. S., Vielmetter J, Terbrueggen RH, Irvine B, Yu CJ, Kayyem JF, Yowanto H, Blackburn GF, Farkas DH, Chen YP. (2001) Electronic detection of nucleic acids: a versatile platform for molecular diagnostics J Mol Diagn 3, 74–84
24.Steel, A., Torres, M., Hartwell, J., Yu, Y.-Y., Ting, N., Hoke, G., Yang, H. In Microarray Biochip Technology; Schena, M., Ed.; Eaton Publishing, 2000, pp 87–117
25.Corporation, C. R. (2001) CFD–ACE+ User’s Manual, CFD Research Corporation, Huntsville, AL
26.Elder, S. A. (1959) Cavitation Microstreaming. J. Acoust. Soc. Am. 31, 54–62
27.Liu, R.H., Lenigk, R., Ganser, D., Bonanno, J., Sanchez, B., Singal, P., Grodzinski, P., Improvement of DNA Microarray Biochips using Microfluidic Mixing Technique, presented at Solid–State Sensor and Actuator Workshop, Hilton Head Island, SC, June, 2002
144 P. Grodzinski et al.
28.Liu, R. H., Lenigk, R., Yang, J., Druyor-Sanchez, R., Singal, P., Grodzinski, P. (2003) Hybridization Enhancement by Bubble–induced Acoustic Microstreaming. Analytical Chemistry, 75 1911-1917
29.Nyborg, W. L. (1958) Acoustic streaming near a boundary. J. Acoust. Soc. Am. 30, 329–339
30.Kolb, J., Nyborg, W. L. (1956) Small–Scale Acoustic Streaming in Liquids. J. Acoust. Soc. Am. 28, 1237–1242
31.Bard, A. J., Faulkner, L. R. Electrochemical Methods; Wiley: New York, 1980
32.White, F. M. Viscous Fluid Flow ; McGraw-Hill: New York, 1974
33.Jonsson, U. L., al., e. (1991) Real–time biospecific interaction analysis using surface plasmon resonance and a sensor chip technology. BioTechniques 11, 620– 627
34.Garland, P. B. (1996) Optical evanescent wave methods for the study of biomolecular interactions. Q. Rev. Biophys. 29, 91–117
35.Anderson, R. C., Su, X., Bogdan, G. J., Fenton, J. (2000) A miniature integrated device for automated multistep genetic assays. Nucleic Acids Res 28, E60
36.Harrison, D. J., Fluri, K., Seiler, K., Fan, Z., E enhauser, C. S., Manz, A. (1993)
Micromachining a Miniaturized Capillary Electrophoresis–based Chemical Analysis System on a Chip. Science 261, 895–897
37.Wang, J. (2000) From DNA biosensors to gene chips. Nucleic Acids Res 28, 3011–3016
38.Ramsey, J. M., Jacobson, S. C., Knapp, M. R. (1995) Microfabricated Chemical Measurement Systems. Nature Medicine 1, 1093–1096
39.Jacobson, S. C., Hergenroder, R., Moore Jr., A. W., Ramsey, J. M. (1994)
Precolumn Reactions with Electrophoretic Analysis Integrated on a Microchip. Anal. Chem. 66, 4127–4132
40.Woolley, A. T., Hadley, D., Landre, P., deMello, A. J., Mathies, R. A., Northrup,
M.A. (1996) Functional Integration of PCR Amplification and Capillary Electrophoresis in a Microfabricated DNA Analysis Device. Anal. Chem. 68, 4081– 4086
41.Waters, L. C., Jacobson, S. C., Kroutchinina, N., Khandurina, J., Foote, R. S., Ramsey, J. M. (1998) Microchip Device for Cell Lysis, Multiplex PCR Amplification, and Electrophoretic Sizing. Anal. Chem. 70, 158–162
42.Burns, M. A., Johnson, B. N., Brahmasandra, S. N., Handique, K., Webster,
J.R., Krishnan, M., Sammarco, T. S., Man, P. M., Jones, D., Heldsinger, D., Mastrangelo, C. H., Burke, D. T. (1998) An integrated nanoliter DNA analysis device. Science 282, 484–487
43.Sosnowski, R. G., Tu, E., Butler, W. F., O’Connell, J. P., Heller, M. J. (1997)
Rapid determination of single base mismatch mutations in DNA hybrids by direct electric field control. Proc Natl Acad Sci U S A 94, 1119–1123
44.Taylor, M. T., Belgrader, P., Joshi, R., Kintz, G. A., Northrup, M. A. In Micro Total Analysis Systems 2001 ; Ramsey, J. M., Van den Berg, A., Eds.; Kluwer Academic Publishers: Monterey, CA, 2001, pp 670–672
45.Yuen, P., Kricka, L., Fortina, P., Panaro, N., Sakazume, T., Wilding, P. (2001)
Microchip Module for Blood Sample Preparation and Nucleic Acid Amplification Reactions. Genome Research 11, 405–412
46.Smith, L., Hok, B., In Transducers ’91, San Francisco, CA 1991; 1049–1051
47.Barth, P. W. In Transducers’95 : Stockholm, Sweden, 1995, pp 276–277
7 The Use of Microfluidic Techniques in Microarray Applications |
145 |
48.Jacobson, S. C., McKnight, T. E., Ramsey , J. M. (1999) Microfluidic Devices for Electrokinetically Driven Parallel and Serial Mixing. Analytical Chemistry 71, 4455–4459
49.Du y, D. C., Gillis, H. L., Lin, J., Sheppard, N. F., Kellogg, G. L. (1999) Microfabricated Centrifugal Microfluidic Systems: Characterization and Multiple Enzymatic Assays. Analytical Chemistry 71, 4669–4678
50.Unger, M. A., Chou, H. P., Thorsen, T., Scherer, A., Quake, S. R. (2000) Monolithic microfabricated valves and pumps by multilayer soft lithography. Science 288, 113–116
51.Peters, E. C., Svec, F., Frechet, J. M. J. (1999) Rigid Macroporous Polymer Monoliths. Advanced Materials 11, 1169–1181
52.Beebe, D. J., Moore, J. S., Bauer, J. M., Yu, Q., Liu, R. H., Devadoss, C., Jo,
B.H. (2000) Functional hydrogel structures for autonomous flow control inside microfluidic channels. Nature 404, 588–590
53.Liu, Y., Rauch, C., Stevens, R., Lenigk, R., Yang, J., Rhine, D., Grodzinski,
P.(2002) DNA Amplification and Hybridization Assays in Integrated Plastic Monolithic Devices. Analytical Chemistry 74, 3063–3070
54.Chiou, J., Matsudaira, P., Sonin, A., Ehrlich, D. (2001) A closed–cycle capillary polymerase chain reaction machine. Anal Chem 73, 2018–2021