


8
Labels and Detection Methods
James J. Storho , Sudhakar S. Marla, Viswanadham Garimella, and Chad A. Mirkin
8.1 Introduction
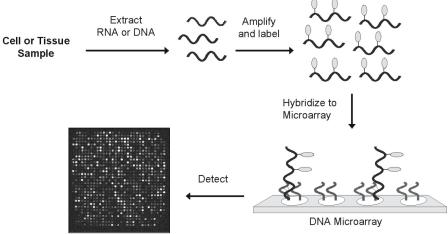
The sequencing of the human genome [1, 2] along with other organisms is fuelling the development of new tools for the highly parallel analysis of genomic information. Microarray technology has emerged as a robust methodology for quantitatively analyzing a large number of nucleic acid sequences in parallel, as shown in Fig. 8.1 [3, 4]. High density oligonucleotide [5] or cDNA microarrays have been utilized for measuring the abundance of mRNA transcripts, which is typically referred to as gene expression analysis [6, 7]. Di erential gene expression analysis is used to determine which genes are up-regulated or down-regulated during specific cellular processes or in response to environmental stimuli [8]. Cellular responses triggered during specific disease states, or by exposure to drugs, toxins, or other molecules of interest have been studied [9, 10]. Such arrays are currently being developed for diagnosis of specific diseases such as cancer [11] as well as for identifying novel mechanisms of drug action [10]. In addition, microarrays have found applications in identifying single nucleotide polymorphisms (SNPs) or other genetic variations [7,12–15]. The detection of SNPs associated with genetic disorders has led to the development of diagnostic microarrays for diseases such as cystic fibrosis [16]. For pharmacogenomic applications, SNP arrays are used to identify key mutations in genes that encode for enzymes responsible for drug metabolism [17].
The major factors that have limited the utility of microarrays in the research and diagnostic applications described above are the amount of target needed, detection specificity, as well as cost and reliability of detection equipment and assays. A critical determinant of these parameters is the labelling and detection methodology. While the current gold standard is fluorescence technology, the emphasis on higher sensitivity, specificity, and cost-e ective detection instrumentation has spurred the development of a number of new labelling and detection methodologies. Recent reports have demonstrated that fluorophore-labelled dendrimers, up-converting phosphor reporters, electrochemical detection techniques and semiconductor or metal nanoparticle labels
148 James J. Storho et al.
Fig. 8.1. Oligonucleotide microarrays are generated on glass slides via robot deposition ( < 10,000 oligonucleotide/cm2) or in situ photolithographic synthesis ( > 250,000 oligonucleotide/cm2 possible). Labelling and detection of nucleic acid targets on arrays typically is achieved by using the following procedure. First, target RNA or DNA is extracted from the sample and amplified to generate more copies. During the amplification process, a reporter group (e.g. fluorophore) is incorporated into the target for detection. The labelled targets are subsequently hybridized to a microarray containing the specific gene sequences of interest. The amount of target bound to each location on the microarray is quantified by detecting the attached label with the appropriate instrument
can positively impact sensitivity, specificity, cost and complexity of detection instrumentation. The development of such technologies will not only improve current microarray applications, but also point to new opportunities for microarrays. These emerging labelling and detection methodologies will be the focus of this chapter with particular emphasis on metal nanoparticle probes. The important considerations that will be used to evaluate each microarray label and detection methodology are sensitivity, specificity, dynamic range, cost, and number of distinguishable labels.
8.2 Fluorophore Labelling and Detection Methods
Fluorophore labelling has become the technology of choice for detection on microarrays in both gene expression and SNP analysis [7, 18, 19]. In a fluorescence experiment, photons absorbed by a dye molecule illuminated at a specific wavelength are re-emitted (in part) as radiation at a lower frequency that is measured with a photodetector. A multitude of fluorophore dyes with spectrally unique signatures have been developed for high sensitivity biological labelling studies. The fluorophore labels most commonly used for microarray

8 Labels and Detection Methods |
149 |
analysis are Cyanine 3 (Cy3) and Cyanine 5 (Cy5). These fluorophores exhibit e cient quantum yields, moderate photostability, unique excitation and emission spectra which enable multiplexing, and can be e ciently incorporated enzymatically into biomolecules via reverse transcription, ligation, or PCR. The sensitivity and dynamic range of fluorophore labelling is dependent on the detection system. Individual fluorophores have been detected on surfaces using highly sophisticated optical detection equipment [33]. However, the utilization of such detection instrumentation is not practical for microarray analysis. Instead, fluorescence scanners that utilize red and green lasers for Cy3/Cy5 excitation and a photo multiplier tube (PMT) for quantitation of specific fluorophore signals were developed for this purpose [34]. These scanners reliably detect < 1 attomole of fluorophore on a 100 m diameter spot which translates to a detection limit of < 75 fluorophores/ m2. The reported dynamic range of quantifiable fluorescence signal was over 3 orders of magnitude using this detection methodology. Today, other types of fluorophore microarray scanners that utilize di erent methods of illumination and detection have been developed and are commercially available [35]. Recent fluorescence detection data collected with commercially available instrumentation suggest that Cy3 probe densities of 5 Cy3 molecules/ m2 are detectable (Table 8.1) [25]. Instrument manufacturer specifications for a variety of scanners indicate detection limits of < 1 fluorophore/ m2 [20]. These values represent the lower limit of a detection system based upon fluorescence. The actual detection limit of an assay is typically limited by the background resulting from any autofluorescence associated with the solid support and non-specific binding of the fluorophore-labelled biomolecule targets.
A detailed description of fluorescence-based labelling for gene expression applications is provided in Chap. 11, and the application to SNP genotyping and genomic analysis is provided in Chaps. 10 and 12, respectively. For all of these applications, a detection label that provides higher sensitivity than fluorescence would enable analysis of smaller target quantities, and for some
Table 8.1. Detection and assay sensitivity for selected probe technologies
Technology |
Probe |
Assay sensitivity |
|
|
detection |
Assay description |
Detection limits |
|
sensitivity |
|
(amount/copies) |
|
(probes |
|
|
|
/ m2) |
|
|
|
|
|
|
Fluorescence/ |
|
T = Target |
|
Phosphorescence |
|
D = Detection |
|
Fluorescently-labelled 5 |
T: Spiked transcripts 2.8 × 10⁷ copies |
||
dyes [20] |
|
D: Laser scanning |
(580 fM) |
|
|
Continued on next page |
|

150 James J. Storho et al.
Technology |
Probe |
Assay sensitivity |
|
|
detection |
Assay description |
Detection limits |
|
sensitivity |
|
(amount/copies) |
|
(probes |
|
|
|
/ m2) |
|
|
|
|
|
|
Fluorescently– |
– |
T: Total RNA |
2.5 g |
labelled DNA |
|
D: Laser scanning |
|
dendrimers [21] |
|
|
|
Up-converting |
Single |
T: Labelled DNA |
1 ng/ L |
phosphors [22] |
particle |
fragment |
|
|
|
D: Modified fluorescence ( 1 × 10⁹ |
|
|
|
microscope |
copies/ L)* |
Electrochemical |
|
|
|
Electrochemical |
– |
T: 74 base DNA strand |
50nM |
sensor Motorola [23] |
|
D: Electron transfer |
(3 × 10¹⁰ copies/ L)* |
Nanoparticles |
|
|
|
Quantum dots [24] |
– |
T: Single-stranded DNA 10 nM |
|
|
|
D: Fluor. microscope |
(6 × 10⁹ copies/ L)* |
DNA-modified gold |
Single |
T: Total genomic |
6 × 10⁶ copies |
probes with silver |
particle |
DNA/PCR products |
(200 fM) (gen. DNA) |
amplification |
(0.0025) |
D: Evanescent wave- |
3000 copies |
(Nanosphere) [25] |
|
based scatter |
(100 aM) (PCR) |
|
|
measurements |
|
Resonant Light |
Single |
T: Spiked transcripts |
8 × 10⁶ copies |
Scattering |
particle |
D: CCD-based system |
(170 fM) |
(Genicon) [26, 27] |
(0.005) |
|
|
Streptavidin-coated |
5 |
T: PCR products |
6 × 10⁷ copies |
gold nanoparticles |
|
D: Laser illuminated |
( 1 pM) |
with silver |
|
scatter |
|
amplification (AAT) |
|
|
|
[28] |
|
|
|
High resolution |
– |
T: Single-stranded DNA 3.2 × 10⁶ copies |
|
surface plasmon |
|
D: SPR spectrometer |
(54 fM) |
resonance [29] |
|
|
|
Gold nanoparticle– |
0.5–20 |
T: Single-stranded DNA 10 pM |
|
enhanced SPR [30] |
|
D: Scanning angle SPR |
(6 × 10⁶ copies/ L)* |
SERS probes [31] |
– |
T: Single-stranded DNA 20 fM |
|
|
|
D: Raman spectroscopy |
(1.2 × 10⁴ copies/ L)* |
Gold nanoparticle- |
– |
T: Single-stranded DNA 500 fM |
|
based electrical |
|
D: Conductivity |
(3 × 10⁵ copies/ L)* |
detection [32]
*NOTE: copies/mL are reported for assays where reaction volumes were unavailable.
8 Labels and Detection Methods |
151 |
applications, eliminate the need for target amplification steps such as PCR. This is a major driver for the development of new labels since it has the potential to lower the cost and complexity of such assays, while increasing data reliability. In addition, the development of a labelling methodology that provides a larger number of distinguishable ‘colors’ for analysis is highly desirable since it would increase multiplexing capabilities for such applications. Two color Cy3/Cy5 labelling methodology is commonly used for gene expression analysis [6,7], and up to four uniquely colored fluorophore dyes have been used in multiplex SNP genotyping applications [36]. It is important to note that the complexity of the microarray scanner increases with the number of fluorophore dyes since each dye requires a di erent excitation wavelength. Ultimately, a multicolor, high sensitivity labelling methodology that utilizes low cost and complexity instrumentation is desired for microarray-based applications.
8.3 Enhanced Fluorescence-Based Assays
8.3.1 DNA Dendrimer Technology
One pathway for achieving higher detection sensitivity is to increase the number of labels associated with each cDNA or target nucleic acid bound to a microarray. A number of research groups have explored using branchedor dendrimer-based nucleic acid structures to increase the label density per nucleic acid target [37–40]. For microarray labelling, Genisphere has developed fluorophore labelled nucleic acid dendrimers which are referred to as 3DNA probes [21]. The 3DNA probes are prepared by hybridizing and crosslinking complementary oligonucleotide building blocks to form a ‘core’ dendritic structure. Cy3 or Cy5 labelled oligonucleotides are subsequently hybridized
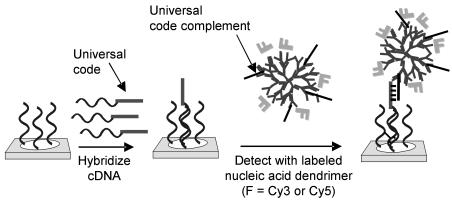
Fig. 8.2. Schematic illustration of cDNA detection on microarrays using fluorophore labelled dendrimers. Note that dendrimers typically contain 250 fluorophores
152 James J. Storho et al.
and crosslinked to the core dendrimers so that each 3DNA probe contains on average 250 fluorophore dyes. For gene expression monitoring, cDNAs are coded with a single universal sequence tag during transcription which is recognized by a 3DNA probe containing the universal code complement in a second labelling step, Fig. 8.2. The 3DNA probe yields 250 fluorophores/cDNA target compared to 12 fluorophores/cDNA target through direct incorporation of fluorophore labelled dNTPs [6]. This corresponds to a 20 fold increase in the number of fluorophores/cDNA probe over direct enzymatic incorporation. For comparison of experimental detection limits, 1–50 g of total RNA was transcribed and labelled with both methods. After hybridization to cDNA arrays, the average specific signal for each gene was measured [21]. The specific signal obtained with the 3DNA dendrimer probe using 2.5 g of total RNA was equivalent to the specific signal obtained with direct Cy3 incorporation using 40 g of total RNA. This amounts to a 16–fold increase in detection sensitivity which correlates well with the number of fluorophores bound per probe. In addition, it was noted that the 3DNA probe signal was stable to repetitive scanning whereas the Cy3 labelled cDNA signal significantly degraded over time, demonstrating that this labelling technology is more robust. In summary, the use of significantly less RNA starting material, the higher stability of the label compared with conventional fluorophores, and the ready integration of the labels with existing fluorescence microarray scanners make the 3DNA dendrimer labelling technology attractive for gene expression analysis.
8.3.2 Semiconductor Quantum Dots
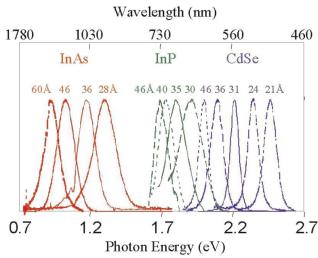
Semiconductor quantum dots (QDs) have emerged as a new class of fluorophore labels [41–43]. These new labels comprise nanometer sized particles of group II–VI or III–V atoms from the periodic table of elements such as CdSe or InAs that are smaller than the exciton Bohr radius (typically 1– 10 nm in size) [44–46]. As a result, the QDs exhibit quantum confinement e ects resulting in optical properties that are significantly di erent than the corresponding bulk material or the atoms that comprise the particle [47]. The fluorescence emission of the particles may be tuned from blue to the near infrared by controlling particle size and chemical composition, which alters the band gap of the particles, as shown in Fig. 8.3. Narrow fluorescence emission bandwidths (25–30 nm FWHM for CdSe QDs) have been observed which makes it possible to generate many spectrally unique QDs for multiplexing applications [45]. Importantly, the particles exhibit broad light absorption that occurs from the ultraviolet through the lowest energy band gap, and as a result, multicolored QDs may be excited by a single UV light source. QDs have exhibited quantum yields of 40–50%, which are slightly lower than the quantum yields for commercial organic fluorophores. This is compensated by the high molar extinction coe cients of such particles at 105–106 M−1 cm−1, which is 10–100 times larger than that for typical organic fluorophores. In
8 Labels and Detection Methods |
153 |
Fig. 8.3. Sizeand material-dependant fluorescence emission spectra of several surfactant-coated semiconductor nanocrystals. (Reprinted with permission from Professor Paul Alivisatos at UC Berkeley)
one study, it was estimated that single ZnS-capped CdSe QDs are 20 times brighter than rhodamine 6G organic dye molecules [43]. The QDs are also highly stable against photo–bleaching.
These fluorescence properties are suitable for many biological applications such as cellular imaging [48] and fluorescent in situ hybridization (FISH) [49] where stable fluorophores are desired, and microarray labelling where multiple colored probes are possible using a single excitation source [24]. However, a limitation of QD technology to date has been the di culty in functionalizing the particles with biomolecules for robust labelling in such applications [24]. As a result, only a few examples of direct QD labelling for biological applications have been reported. An innovative approach designed to utilize the unique fluorescent properties of QDs for optical coding of biomolecules was recently reported by Nie and coworkers [50]. In this approach, 1.2 m polymeric microbeads are optically encoded by embedding di erent colored QDs at defined ratios for use in ‘liquid arrays’, where a biomolecule attached to the surface of the microbead is barcoded by the unique signal from a single QD or a group of di erent QDs in a well-defined ratio. Beads encoded with organic fluorophores were previously reported for liquid array applications [51]. However, major benefits of QDs for barcoding include a single UV excitation source for bead detection, and the potential for many more unique colors. The number of codes in this approach is defined by the number of unique colors and intensities, such that n intensities and m colors generate nm − 1 codes. The authors suggest that six spectrally unique QDs at 6 intensity levels is feasible, generating approximately 10,000 recognizable QD codes [50]. Exper-
154 James J. Storho et al.
imentally, polymeric beads were loaded with di ering amounts of a single color QD, and the fluorescence intensity was quantified from individual beads using wavelength resolved fluorescence spectroscopy. Using a single color bead, the fluorescence intensity scales linearly with the number of QDs/bead from loadings of 640 to 50,000 QDs/bead, with 10 distinct intensity levels at 3 standard deviations. In a model system, three DNA labelled beads with unique QD barcodes were used to detect complementary DNA sequences in a multiplex detection assay. The fluorescence intensities from each bead and the fluorophore labelled target were measured using single bead spectroscopy. In a more recent report, 5 SNPs were simultaneously genotyped from a single solution using QD encoded microbeads in conjunction with flow cytometry [52].
Alivisatos and coworkers have demonstrated that direct QD labelling for conventional microarray based applications is feasible [24]. Four separate gold substrates were derivatized with four unique DNA sequences for study, along with four spectrally unique QDs, each derivatized with the complement of one of the surface bound targets. In these studies, an argon ion laser was used for excitation, and the fluorescence emission was captured with a CCD camera through a 60× objective. Sequence specific hybridization of each color QD was demonstrated by exposing each substrate to a mixture of the four QDs, which predominantly resulted in hybridization of only the perfectly complementary QD. The surface density required for detectable signal was not reported, but 10–100 nM concentrations of the QDs are needed to produce detectable signal. The low sensitivity probably stems from poor functionalization or unoptimized assays given that the high quantum yields of QDs should yield signal intensities that are at least comparable to organic dye labels. Therefore, further work in labelling will likely significantly improve detection capabilities of QDs for microarray applications. An additional focus area is the preparation of QDs made of more environmentally benign materials than CdSe which is toxic. The benefits of more robust and reliable multicolor detection with simplified instrumentation are attractive if this can be achieved. Quantum Dot Corporation and others are currently marketing semiconductor quantum dot probes for a variety of biological labelling applications.
8.4 Phosphor Reporters
Autofluorescence background on microarray substrates negatively impacts the sensitivity of fluorophore labelling. A novel approach devised to eliminate autofluorescence utilizes up-converting phosphor labels that absorb two photons of lower frequency light in the infrared region and emit a single photon at a higher frequency in the visible region [22,53–55]. Up-converting phosphor (UP) labels typically comprise submicron-sized yttriumYoxysulfide particles (0.2– 0.4 m diameter) that are doped with lanthanide ions such as Ytterbium and Erbium for excitation and emission [55]. Phosphorescence from the lanthanide ions persists for > 10−8 seconds after excitation while organic fluorophores
8 Labels and Detection Methods |
155 |
emit light for < 10−9 seconds after illumination; thus, phosphorescence is distinguishable from autofluorescence using time resolved fluorescence spectroscopy [56,57]. Up-converting phosphor labels with di erent emission colors are generated by using the same absorber ion with di erent lanthanide ions for emission. For example, the Ytterbium/Erbium excitation/emission pair emits green light while the Ytterbium/Thulium pair emits blue light. UP materials also are characterized by narrow emission bandwidths (25–50 nm), which has enabled the development of over six spectrally unique emission colors [22]. Additionally, infrared excitation is advantageous for microarrays since other assay components (e.g. substrates) do not absorb infrared light resulting in lower overall background. A detection limit of 12 UP particles in a 30– 40 mm2 well was achieved using infrared laser excitation and detection with a photomultiplier tube [22]. Therefore, the theoretical detection limit of a few UP labels per microarray spot is orders of magnitude better than molecular Cy3 fluorophores with detection limits of 1–5 fluors/ m2 (Table 8.1).
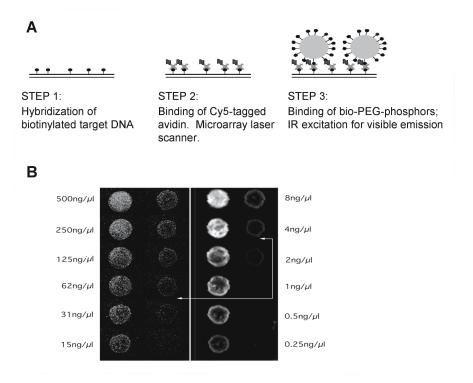
In an actual microarray labelling experiment, the specific and non-specific binding properties of the UP particles to the array surface and kinetics of binding play a role in determining assay sensitivity. In a recent study conducted by Tanke and coworkers, arrays containing a serial dilution of human elongation factor (HEF) probes ( 1000 base–pair) were hybridized to a biotin labelled (HEF) target, followed by staining with Cy5-labelled avidin, and subsequent labelling with an UP particle for comparison [22] (Fig. 8.4). The limit of detection (LOD) for Cy5 was 4 ng/ L using a laser-based microarray scanner, while the LOD of the UP labels was 1 ng/ L recorded with a fluorescence microscope modified for infrared excitation. Therefore, the assay sensitivity was increased 4–fold when compared to conventional fluorescence detection. The phosphor luminescence was found to correlate linearly with probe and target concentration over a concentration range of 3 orders of magnitude, which was comparable to Cy5 labelling.
Phosphor technology o ers a greater number of ‘colors’ for labelling (currently 6) than fluorescence with single source infrared excitation [22]. For microarrays, this translates to a greater potential for multiplexing with simplified and lower cost detection instrumentation. Despite the sensitive UP probe detection capabilities, the assay sensitivity is currently in the same range as molecular fluorophore probes. This is likely due to the large particle size, which results in poor di usion, steric hindrance, and large van der Waals forces between surface and substrate. The use of smaller particles and improved conjugation methods o ers a potential route to higher sensitivity detection. More recently, glass microbarcodes with lanthanide ion emitters were reported for multiplexed DNA detection assays [58]. The combination of single source excitation and multiple colors is also extremely attractive for barcoding applications.
156 James J. Storho et al.
8.5 Electrochemical Detection
Electrochemical and electronic detection have received significant interest as a viable means for microarray labelling since inexpensive and robust instrumentation may be used for detection [23,59,60]. In addition, such sensors can function in complex sample environments such as blood where optical sensing is di cult. Electrochemical sensors are used in point–of–care diagnostic applications such as glucose testing, where inexpensive electronic circuitry rapidly quantifies glucose levels in blood samples [61]. The biggest drawback of electrochemical detection is low sensitivity. For molecules such as glucose that are present at micromolar concentrations in vivo, sensitivity is not an issue [61]. However, genetic targets such as nucleic acids are typically present at significantly lower concentrations presenting a significant challenge for this technology. Electrochemical detection platforms that utilized redox active probes,
Fig. 8.4. (a) Schematic outline of the experiment. (b) Model low complexity microarray hybridization with biotin HEF–DNA detected with avidin–Cy5 and laser scanning (right panel) and subsequent detection with Bio–PEG UPT (left panel) (Reprinted with permissions from [22]. Copyright 2001 Macmillian Magazines Limited)
8 Labels and Detection Methods |
157 |
redox active intercalators, or the inherent redox active properties of DNA have been developed for nucleic acid analysis on microarrays.
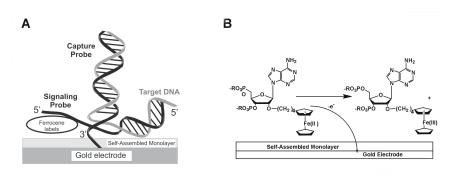
The first platform, which has been under development at Motorola’s Clinical Microsensors division, utilizes ferrocene labelled nucleic acid probes in a low density array format that is geared towards clinical diagnostic applications [23, 62]. Electrochemical detection of ferrocene labelled probes, which contain FeII/FeIII redox centers, is achieved in a sandwich hybridization assay format on gold electrodes (Fig. 8.5). Disposable low density arrays of gold electrodes ( 250–500 m diameter) are fabricated via conventional printed circuit board technology, and individual electrodes are derivatized with a monolayer that contains specific thiol modified oligonucleotide sequences for target capture. When target is bound to capture strands on the electrode surface, a reporter nucleic acid probe containing multiple ferrocene moieties hybridizes to the target/capture complex. When a given potential is applied to the electrode, electron transfer occurs between the ferrocene labels and the gold electrode. The current generated by the ferrocene labels is used to quantify the amount of nucleic acid present. It should be noted that only ferrocene labels hybridized to the surface generate signal so that hybridization and detection may be performed in a single solution without the removal of excess probes.
Fig. 8.5. (a) Schematic illustration of electrochemical detection of nucleic acids on gold substrates. (b) Scheme depicting electrochemical oxidation of ferrocene groups at an electrode surface
Using this approach, 50 nM solutions of single stranded nucleic acid target are detectable in a sandwich hybridization assay, but double stranded targets of similar concentration yield almost no signal [23]. As a result, asymmetric PCR is used to generate high concentrations of single stranded nucleic acid for detection. Genotyping of the C282Y mutation of the Hfe gene was achieved using asymmetric PCR by comparing signal intensities from wild type and mutant capture probes. Asymmetric RT–PCR also demonstrated that gene expression monitoring of a small number of genes (5 in the reported example) is feasible with this approach, although the dynamic range was not reported.
158 James J. Storho et al.
The most important attributes of this detection approach are the simple and in-expensive electronic detection system and electrode chips, and the integration of hybridization and detection into a single step. Additionally, multiple reporter groups have been developed by tuning the redox potential of the ferrocene moiety. A disadvantage of this approach is the relatively low sensitivity compared to fluorescence detection and the inability to detect double stranded DNA targets (Table 8.1).
The second electrochemical detection platform utilizes the electron transfer properties of nucleic acids for detection, eliminating the need for nucleic acid probes labelled with redox active groups [59, 60]. Thorp and coworkers developed a label free electrochemical detection strategy that utilizes mediated electron transfer from guanine in target nucleic acids bound to an electrode [60]. The amount of peak current correlates with the number of guanine residues in the target. Detection limits of 26 molecules/ m2 were reported for a 1497 bp PCR amplicon deposited directly onto an Indium Tin Oxide (ITO) electrode [63]. In a proof–of–concept study for gene expression, RT–PCR amplified RAK gene products from six breast tissue samples were quantified via fluorescence and then measured via electrochemical detection [64]. Overexpression in the breast cancer samples was correctly identified by measuring the peak current associated with each PCR amplicon on individual ITO electrodes. ITO microelectrode arrays with gene specific capture sequences have been applied to low density gene expression applications [65]. The benefits are label-free detection in addition to the inexpensive detection hardware, but low detection sensitivity is still a disadvantage when compared to fluorophore labelling.
Alternatively, Barton and coworkers have utilized redox active intercalators to signal the presence of specific nucleic acid sequences [59, 66]. The approach uses an electrocatalytic signal amplification strategy involving the intercalators coupled to [Fe(CN)6]3−. This technique has been used successfully in SNP discrimination by measuring the electrochemical signal at the electrodes containing matched and mismatched probes. The electrochemical response from the mismatched hybrids is diminished owing to the disrupted electron transfer between the electrode and the intercalator, allowing the identification of the perfectly matched hybrid. In addition, electrocatalytic signal amplification strategies o er the potential to improve detection sensitivity by generating more electrochemical signal per target. GeneOhm Sciences, Inc. is currently developing this technology for SNP analysis.
8 Labels and Detection Methods |
159 |
8.6 Metal Nanoparticle Labels and Metal Thin Films for Microarrays
8.6.1 Introduction to Metal Nanoparticle Based Detection Methodologies
Gold nanoparticles have been utilized as labels for cellular imaging [67] as well as detection of proteins [68, 69] and nucleic acids [70], but it was not until recently that nanoparticle labelling was applied to biomolecule detection on microarrays [71]. Recent interest in metal nanoparticles as labels has been fuelled by the development of reliable preparation methods [72] and robust functionalization techniques with nucleic acids or proteins [69,73]. Metal nanoparticles exhibit unique optical, catalytic, and electronic properties owing to their size, and therefore, can be used in a variety of detection schemes based on di erent modes of signal transduction. An explosion of research in this area has led to a number of di erent approaches that may be utilized for detecting such particles in both optical and electrical detection formats. Reported detection formats include colorimetric changes [73, 74], silver enhanced imaging [28, 71], surface plasmon resonance imaging [30, 75], light scatter [76, 77], surface enhanced Raman spectroscopy [31], photo–thermal imaging [78], electrical detection [32], and scanning electrochemical microscopy [79].
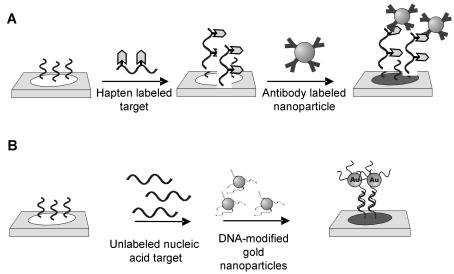
The preparation and properties of colloidal gold particles were studied in the early 1800s by Faraday [80]. Reproducible methods have now been developed for preparing highly monodisperse 1–100 nm diameter gold particles which are available through commercial sources. Although gold is the easiest metal to prepare in nanoparticle form, the synthesis of other metal particles such as silver have now been realized. The method used for functionalizing the nanoparticles with biomolecules for detection is critical, as it dictates the binding properties of the resulting label, as well as the application of the labels for detection. Both direct and indirect nanoparticle labelling strategies have been developed for nucleic acid detection on microarrays (Fig. 8.6). For indirect nucleic acid labelling, metal nanoparticles are functionalized with antibodies such as antibiotin or streptavidin which passively adsorb to the surface (Fig. 8.6a). For detection, haptens are incorporated into the nucleic acid target and bound to the microarray, followed by labelling with the complementary antibody-labelled gold nanoparticle in a separate step. The advantage of this method is that a single particle may be used for detection of all nucleic acid sequences. Disadvantages include compromised sensitivity due to passive adsorption, and the requirement of incorporating a label into the target sequence of interest. Direct nanoparticle probe labelling was pioneered by Mirkin and coworkers [73]. In this approach, oligonucleotides are covalently anchored to the nanoparticle surface using thiol linkers (Fig. 8.6b). For detection, the DNA-modified gold nanoparticle probes are hybridized to nucleic acid targets in a sandwich assay format. The probes exhibit high stability toward thermal fluctuations as well as elevated concentrations of salt [73] and are typically
160 James J. Storho et al.
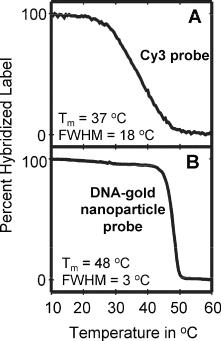
used directly in the assay for detection. Multiple oligonucleotides attached to each nanoparticle confer unique properties to the probes when compared to molecular fluorophores (Fig. 8.7) [81]. These include an elevated melting temperature (Tm) and an unusually sharp melting transition, which provides for enhanced sequence discrimination and enables higher stringency hybridizations. In addition, this approach does not require the incorporation of labels into the target, which simplifies direct detection of nucleic acid sequences. A potential disadvantage is that multiple probes may be required for analysis of multiple sequences, although universal nucleic acid labelling strategies are well established and feasible. Experimental data for each of these labelling approaches will be described in the ensuing sections on detection methodologies.
8.6.2 Scatter-Based Detection of Metal Nanoparticle Probes on Microarrays
Gold and silver nanoparticles are characterized by a plasmon resonance absorption band that gives rise to intensely colored solutions. The absorption band is due to electrons confined at the particle surface that collectively oscillate at a specific frequency, which is commonly referred to as the surface plasmon resonance frequency. According to Mie theory, the plasmon frequency is defined by particle composition, size, shape, and the dielectric medium, which determines the maximal absorption wavelengths, and therefore, the resulting color of the particle solutions. For example, the plasmon band of a 20 nm Ag
Fig. 8.6. Nucleic acid detection on microarrays using metal nanoparticles. (a) Antibody modified gold nanoparticle labels. (b) DNA-modified gold nanoparticle probes
8 Labels and Detection Methods |
161 |
particle is centered at 395 nm resulting in a yellow solution, while a 20 nm Au particle absorbs at 520 nm resulting in a red solution [82]. The plasmon bands are typically broad (50–100 nm bandwidths for 50 nm diameter particles), and absorption extends from the plasmon band to higher energy into the UV. The extinction coe cient of the plasmon bands of gold and silver nanoparticles scales with particle volume and is extremely large at 108–1011 M−1 cm−1 for 15–100 nm diameter particles [83]. As a result, the particles can be visualized by absorbance in solution at nanomolar to picomolar concentrations. Silver amplification techniques have been developed to enhance visualization of gold particles at lower concentrations for immunochemistry applications [84].
A more sensitive method for detecting larger metal nanoparticles (> 30 nm diameter) is to monitor scattering. When illuminated with white light, metal nanoparticles in the 20–120 nm diameter size range scatter light of a specific color at the surface plasmon resonance frequency (Fig. 8.8) [26,83,85]. This has been referred to as resonance light scattering (RLS) or plasmon resonance scattering by various groups. The light scattering scales with particle volume as observed for absorbance, but the scattered light is detectable at much lower concentrations than the absorbed light. For example, light scattered by a solution of 80 nm diameter gold particles is detectable down to
Fig. 8.7. (a) Melting analysis of Cy3 labelled probes in a sandwich hybridization assay. (b) Melting analysis of DNA-modified gold nanoparticle probes in same assay
162 James J. Storho et al.
5 fM concentration [86] which is roughly 1000–fold lower concentration than detectable by absorbance. In a direct comparison with fluorescence, a single 60 nm diameter gold particle emitted roughly the same amount of light as 5 × 10⁵ fluorescein molecules [86]. The enhanced detection sensitivity of this approach is attractive for microarray labelling applications. Additionally, the metal particles produce a stable signal and do not photobleach or quench upon prolonged illumination as observed for fluorophore labels.
DNA-Modified Gold Nanoparticle Probes
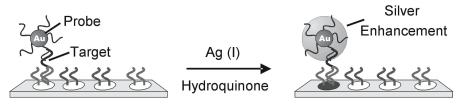
Mirkin and co-workers were the first to report the use of nanoparticle labels for microarrays [71]. The initial method employed 15 nm diameter gold particles labeled with oligonucleotides in a sandwich assay format (see Fig. 8.6b). These probes are visible at high surface coverages on glass and provide su - cient sensitivity to allow detection of targets in the nanomolar concentration range [87]. A simple and elegant method was devised to improve their optical detection by using these gold nanoparticle probes to promote the reduction of Ag (I) to silver metal (Fig. 8.9) [71]. Briefly, after the sandwich hybridization assay, catalytic reduction of silver onto the gold nanoparticle surface was promoted by the reducing agent hydroquinone, which intensified the visual signal. Signal quantitation was accomplished using grayscale intensity from an ordinary flatbed scanner. A greater than 105–fold sensitivity improvement was achieved by silver enhancement with a reported detection limit of 50 fM nucleic acid target. This limit of detection was 2 orders of magnitude better than the 5 pM detection limit achieved under the same conditions with Cy3 labelling and fluorescence-based confocal scanning. In addition, the dynamic range of the assay spanned 2 orders of magnitude with a single silver de-
Fig. 8.8. Scatter of metal nanoparticle, based on particle size, shape and composition of matter. All particles were aqueous suspensions. (Reprinted with permission from [85]. Copyright 2001 American Association for the Advancement of Science)
8 Labels and Detection Methods |
163 |
velopment, but could be extended to 6 orders of magnitude by using three consecutive silver development steps.
The selectivity of the oligonucleotide functionalized nanoparticle probes was compared initially to a corresponding fluorescence-based system in a sandwich assay [71]. Detection of nanoparticle probes by flatbed scanner was approximately four fold better than detection of Cy3 fluorocescence by confocal scanning with regard to discriminating the A:T match from the di cult to resolve G:T wobble pair, with signal ratios of 10:1 and 2.6:1 respectively. In addition, the nanoparticle probe system also demonstrated a much sharper melting transition and higher melting temperature (see Fig. 8.7), which may be attributed to the multiple equivalent sites made available to the target by the nanoparticle probe [81]. More recently, it has been demonstrated that the selectivity factor in the case of DNA-modified gold nanoparticle probes in conjunction with electrical-based detection could be increased to 500,000:1 with a salt-based stringency wash at room temperature.
Nanosphere Inc. is currently developing the silver-amplified gold probe technology originally reported by Mirkin and coworkers [71] for diagnostic applications. A major distinction of Nanosphere’s work is the development of a scattering-based detection system for the silver amplified gold nanoparticles [25]. The detection system illuminates the glass slide with a planar waveguide and captures the scatter of the silver amplified gold particles with a CMOS detector. A single image of the entire slide is recorded by this optical configuration, which eliminates the need for moving parts and image stitching. The detection limit of the silver amplified nanoparticle probes was determined by spotting a serial dilution of the respective probes on standard glass slides. After silver amplification of the nanoparticle probes a scatter signal from < 0.0025 probes/ m2 could be detected with 95% confidence above background using the Nanosphere detection system. This is roughly 2–3 orders of magnitude better than detection of Cy3 molecules, Table 8.1. In addition, the dynamic range recorded with the new detection system covers greater than 3 orders of magnitude, which is an order of magnitude improvement over the flatbed scanner discussed previously.
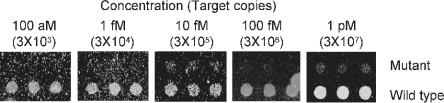
An assay sensitivity of 100 aM (3000 total copies) was demonstrated on a Factor V Leiden gene SNP array (1691 G → A), Fig. 8.10. This assay sensitivity is greater than 3 orders of magnitude better than other nanoparticle-based
Fig. 8.9. Illustration of silver amplification of gold nanoparticle probes which leads to signal enhancement
164 James J. Storho et al.
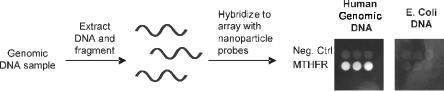
detection systems that utilize larger metal particles labelled with antibodies (Table 8.1). In addition, the high melting temperature and sharp melting transitions of the DNA-modified nanoparticle probes have enabled single base mismatch discrimination, even at 100 aM detection levels. Direct detection in human genomic DNA also requires high specificity since the complexity is extremely high at 1 × 10⁹ bp [88]. DNA-modified nanoparticle probes permit operation at high stringencies owing to the sharp melting transitions. For initial testing, the MTHFR gene sequence was targeted in a sandwich hybridization format using a single step hybridization reaction (Fig. 8.11). Remarkably, the MTHFR gene was directly detected from a 20 g sample of human genomic DNA (6 × 10⁶ copies) using the DNA-modified gold probes in conjunction with silver amplification [25]. Assays for discriminating SNPs in unamplified genomic DNA are currently under development. In addition, mecA gene detection in Staphylococcus genomic DNA samples has been used to determine methicillin resistance status with DNA-modified gold nanoparticle probes [25].
This work demonstrated the potential of DNA-modified gold probes in conjunction with silver amplification for microarray-based applications. In addition to a detection sensitivity of 103 copies, the DNA-modified gold probes provide enhanced specificity, which has enabled improved SNP discrimination and sequence identification in complex genomic DNA samples. The combination of increased specificity and sensitivity is unique to the Nanosphere labelling and detection methodology and is leading to the development of nucleic acid diagnostic assays for infectious diseases and SNPs that do not require target amplification or complexity reduction. Additionally, the low complexity and cost of the detection instrumentation is well suited for diagnostic applications and also separates Nanosphere’s detection platform from other nanoparticle labelling strategies that utilize more complex instrumentation. The main limitation of this system is that the silver amplification methodology yields a single color format when scatter based detection is utilized. For applications requiring more than a single color, larger DNA-modified gold nanoparticle probes (50–100 nm diameter) have been developed in conjunction with scatter-based detection for two color labelling [76]. In this detection
Fig. 8.10. Detection of a single nucleotide mismatch in a 250 base pair PCR amplicon of the factor VLeiden gene. Panel shows a serial dilution of amplicon in an overnight hybridization reaction. The assay detection limit is 100 aM
8 Labels and Detection Methods |
165 |
methodology, two di erent probe colors are achieved by controlling particle size, shape, and chemical composition, which determines the color of scattered light in the absence of silver amplification [76, 85].
Antibody-Functionalized Metal Nanoparticles
Yguerabide and coworkers and Genicon Sciences Corporation first reported the use of antibody labelled metal nanoparticles with resonant light scattering (RLS) detection for microarray applications [86]. Light scattered from 60 nm diameter gold particles deposited onto glass microarray surfaces was detectable at 0.005 particles/ m2 using white light illumination and CCD based imaging (Table 8.1) [86]. This detection sensitivity is 2–3 orders of magnitude better than the corresponding 1–5 Cy 3 molecules/ m2 using a standard fluorescence microarray scanner.
Bao et al. have reported the use of 80 nm diameter metal nanoparticles conjugated with anitibiotin (RLS labels) for gene expression [77]. A human gene cDNA array consisting of 2000 genes was employed to test the sensitivity and specificity of the RLS labels in comparison with Cy3. cDNA probes prepared from human poly(A) RNA were co-labelled with biotin and Cy3 and hybridized to the human gene array. The Cy3 fluorescence signal for each expressed gene was quantified using a confocal fluorescence scanner, followed by incubation with the RLS labels and detection using a CCD-based imaging system. Both labelling technologies detected nearly 100% of the genes when the cDNA arrays were challenged with 500 ng of target, but the RLS labels outperformed the Cy3 at lower target dilutions, allowing detection of 10–300 times as many genes when challenged with 1–5 ng of target. By comparison, approximately 20 times the amount of target was required for Cy3 labelling to detect an equivalent number of genes. Comparable reproducibility was observed when 100 ng of the co-labelled target was hybridized to two separate slides using the procedure described above, and the net hybridization signals for each label were evaluated. The data from this experiment also indicated comparable dynamic range for the two labels at > 2 orders of magnitude. A strong correlation in di erential gene expression levels was observed for leukemia samples using single color fluorescence or RLS labelling verifying
Fig. 8.11. Detection of a specific gene from a human genomic DNA sample using an oligonuceotide array and DNA-modified gold nanoparticle probes with silver amplification
166 James J. Storho et al.
the signal specificity. A more recent report by Genicon Sciences assessed the dynamic range and limit of detection in gene expression studies using known amounts of specific cDNA transcripts that were spiked into complex cDNA samples [107]. The reported lower limit of detection (LLOD) was 8.2 × 10⁶ copies ( 170 fM, 80 uL) with a 3.3 log dynamic range. By comparison, a Cy3 label had an LLOD of 2.8 × 10⁷ copies ( 580 fM, 80 uL) with a 3.2 log dynamic range. It should be noted that although a single color was reported in this study, two color nanoparticle labelling is now available using silver and gold particles [27].
In an approach similar to Genicon, Schultz and coworkers have utilized large silver nanoparticles referred to as plasmon resonant particles (PRPs) and resonant scatter based detection for microarray labelling [89]. The 40– 100 nm diameter silver particles are prepared by solution-based reduction of silver onto small gold particle seeds ( 5 nm diameter). The PRPs scatter light based on the position of the surface plasmon band as observed for gold particles [90]. In this study, 55 ± 17 nm diameter particles which exhibit maximum scatter at 430 nm were utilized. The particles were derivatized with mouse anti-biotin antibodies for detection of biotin labelled targets, Fig. 8.6a. For detection, the slide is illuminated in dark field using a halogen lamp, and a high resolution image of each microarray spot is captured using a CCD camera through a 10× or 100× dark-field/bright-field objective lens on an optical microscope [89]. Individual plasmon resonant particles provide a scattering signal that is distinguishable from other sources of scatter, thereby enabling particle counting to be used for measuring the amount of total signal from each microarray spot. This unique detection methodology was applied on a small model array containing positive and negative control capture sequences. A biotin labelled 30–mer target was hybridized to the array overnight followed by overnight incubation with the antibiotin labelled silver particles. A detection limit of 1×10⁶ target copies (830 fM, 2 uL) was achieved, which was 10–fold better than obtained by measuring average scatter intensity (1 × 10⁷ copies) using this illuminaton/detection technique. The improvement in sensitivity is attributed to the elimination of background pixels that decrease the average scattering signal on microarray spots that are not completely coated with particles. This labelling technology is under development at Seashell Corporation for microarray applications [89].
The above cited literature clearly demonstrates that RLS labels hold promise as high sensitivity labelling systems for gene expression. However, the 3–4 fold increase in assay sensitivity observed with spiked transcripts was significantly less than the expected 2–3 orders of magnitude improvement predicted based on the theoretical RLS detection limit of 0.005 RLS particles/ m2. This significant disparity is likely attributed to the large size of the gold particles required, which presents steric and kinetic limits to the number of particles bound to each cDNA probe. In addition, the passive adsorption of the antibiotin antibodies to the nanoparticle surface may be prone to desorption [77]. Particle counting may be used to increase sensitivity in
8 Labels and Detection Methods |
167 |
such detection systems, but this strategy requires the use of slower and more complex instrumentation [89]. While the use of smaller metal nanoparticles for labelling can enhance hybridization kinetics and relieve steric issues, this approach will result in lower scattering intensity. Alexandre et al. in collaboration with Advanced Array Technology (AAT) have employed streptavidin coated 10 nm gold nanoparticles in conjunction with silver amplification for nucleic acid analysis on microarrays [28, 91]. In a direct comparison, this approach yielded detection limits (0.1 fmol, 6×10⁷ copies) equivalent to a Cy3 labelled target. These detection limits in comparison to the DNA-modified nanoparticle probes (Table 8.1) indicate that in addition to the smaller size of the nanoparticles, the functionalization strategy, antibody or DNA, must play an important role in determining assay sensitivity.
In summary, scatter-based nanoparticle detection enables single particle detection capabilities. Therefore, the major determinant of assay sensitivity in these detection strategies is background, target binding a nity, particle binding kinetics and sterics. A detection limit of 100 aM (3000 target copies) has been achieved using Nanosphere’s oligonucleotide-modified gold nanoparticle (15 nm diameter)–silver amplification technology in conjunction with simple optical detection instrumentation for nucleic acid detection. Antibody-labelled gold or silver particles (> 60 nm diameter) without silver amplification have achieved fM to pM detection limits ( 106–107 target copies) in nucleic acid detection assays. The higher sensitivity achieved with the Nanosphere strategy is likely a combination of the small particle size which increases binding kinetics and limits sterics, the use of covalent DNA particle modification which enhances target binding a nity, and the use of silver amplification which results in a higher signal per nanoparticle probe due to increased particle size. More importantly, the assay sensitivity achieved with the Nanosphere technology is roughly 3 orders magnitude more sensitive than a comparable assay with fluorescently-labelled dyes (Table 8.1) which has enabled direct detection of genomic DNA samples.
8.6.3 Surface Plasmon Resonance Detection
Surface plasmon resonance (SPR) spectroscopy is a detection methodology that enables measurement of changes in thickness and/or index of refraction of organic or biomolecular thin films at noble metal surfaces (Au, Ag, or Cu) [75]. This technology has been reviewed extensively [75,92,93], therefore discussion will be limited to recent advancements in using SPR with microarrays. Surface plasmons are generated by conduction electrons at the metal surface that collectively oscillate at a specific frequency. The surface plasmon resonance frequency is sensitive to the metal/dielectric medium interface such that the adsorption of biomolecules at the surface interface results in changes in the SPR which can be measured by scanning angle SPR, SPR wavelength shift, or SPR imaging [75]. The scanning angle SPR technique is the most commonly employed method, and instruments are commercially available through Bia-
168 James J. Storho et al.
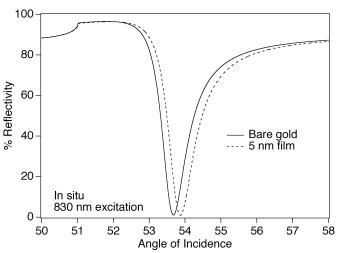
core and others. This method utilizes a single wavelength such as a HeNe laser for excitation, and measures the percent reflectance change at the surface of a gold thin film ( 50 nm thick) as a function of incident angle. Theoretical Fresnel calculations are used to model changes in reflectivity at gold surfaces [75]. Figure 8.12 shows theoretical SPR changes for the adsorption of a 5 nm film of refractive index 1.45 onto a gold thin film. Recent reports have demonstrated that SPR imaging is a powerful technique for monitoring biomolecule interactions on microarrays [94, 95]. SPR has been used for in situ, label-free, optical detection of antibody–antigen binding, DNA hybridization, and protein DNA interactions [96,97]. Sensitivity limits achieved by using this technology are in the nanomolar range for DNA detection. Recent improvements in instrumentation and signal amplification strategies have significantly improved the limits of detection. Zhou and coworkers have developed higher resolution SPR spectrometers to enhance detection sensitivity [29]. With commercially available instrumentation, SPR angle shifts are measurable to 0.001 degrees. The high resolution SPR spectrometer measures angle shifts down to 10−4–10−5 degrees. In a model DNA assay, a 30–mer oligonucleotide capture probe was immobilized on a gold thin film, and the hybridization of a 47 base single stranded target oligonucleotide was monitored in real time using the high resolution SPR spectrometer. A detection limit of 54 fM was achieved in5 minutes utilizing this detection methodology.
Nanoparticle amplified surface plasmon resonance (SPR) utilizes gold nanoparticle labels to enhance detection sensitivity, with a > 1000 fold improvement in nucleic acid detection [30]. The sensitivity enhancement is due to an enhanced shift in SPR reflectivity as a combined result of greatly increased surface mass, high dielectric constant of the gold particles, and electromagnetic coupling between the gold nanoparticles and the gold film. To measure detection sensitivity as a function of particle size, particles were spotted onto a surface as a dilution series, and the corresponding SPR signal was measured [98]. Using 12 nm gold particles, surface densities of 20 particles/ m2 were detectable with a signal to noise ratio of 10, which could be improved 40–fold to 0.5 particles/ m2 by using larger 45 nm gold particles. This detection limit is roughly equivalent to Cy3 detection (Table 8.1). In a model DNA array, a gold thin film (48 nm thick) and DNA modified gold probes (12 nm diameter) were utilized to detect a 24 base oligonuceotide target in a sandwich hybridization assay with a reported detection limit of 10 pM (≤ 8 oligonucleotides/ m2) [30]. Although currently not as sensitive as Cy3 labelling (Table 8.1), the sensitivity of nanoparticle-amplified SPR should improve significantly through the use of larger probes which o er greater detectability, or in combination with the aforementioned high resolution SPR spectrometer.
This work provides a sound basis for future SPR-based microarray labelling applications. The potential for rapid, label-free biomolecule detection is intriguing. The high lateral spatial resolution ( 10 m) is conducive to arrays and miniaturization. In addition, recent advancements in sensitivity
8 Labels and Detection Methods |
169 |
Fig. 8.12. Calculated Surface plasmon resonance (SPR) curves at 830-nm excitation for a (solid line) three layer system composed of an SF–10 glass prism (n= 1.711), a 45.0 nm-thick Au film (n= 0.165 + 5.205i), and an infinite layer of water (n= 1.327) and (dashed line) a four layer system composed of an SF–10 glass prism (n= 1.711), a 45.0 nm-thick Au film (n= 0.165 + 5.205i), a 5.0 nm-biopolymer film (n= 1.45), and an infinite layer of water (n= 1.327). (With permission from [75] and the Annual Review of Physical Chemistry, Volume 51, Copyright 2000, by annual reviews, www.annualreviews.org)
using nanoparticle amplification or higher resolution SPR spectrometers significantly enhance the capabilities of this detection methodology for DNA microarrays. Furthermore, recent reports have demonstrated that real time SPR measurements can be performed on ensembles or even single metal nanoparticles for biomolecule detection applications o ering prospects for even further miniaturization and increased sensitivity [95, 99].
8.6.4 Surface-Enhanced Raman Scattering
Numerous reports have demonstrated that metal surfaces with nanometer scale roughness may be used to amplify Raman scattering signals of adsorbed molecules [100–102]. This technique is commonly referred to as surface enhanced Raman spectroscopy (SERS). Raman scattering enhancement factors of up to 108 have been reported for molecules adsorbed onto roughened metal surfaces [103]. Additionally, Raman scattering signals from single rhodamine 6G dye molecules adsorbed onto silver nanoparticles have been detected demonstrating that Raman enhancement factors on the order of 1014– 1015, and thus detection of single molecules, is achievable [104]. Graham and coworkers first reported a SERS platform for nucleic acid sequence detection that utilized silver nanoparticles tagged with Raman active dye labelled
170 James J. Storho et al.
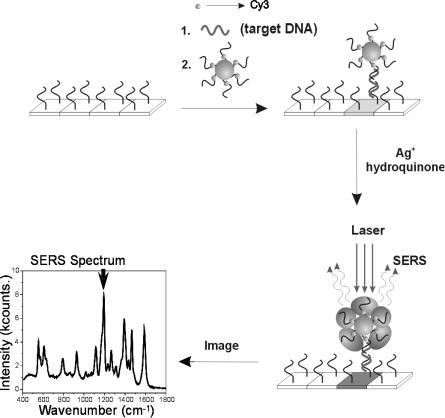
nucleic acids [105]. Using a modification of the silver amplification methodology for microarrays outlined in Fig. 8.9, Mirkin and co-workers have recently developed a SERS-based detection system for microarray analysis. Raman dye labelled oligonucleotide probes attached to 15 nm diameter Au particles are designed to label specific nucleic acid sequences in a sandwich hybridization assay format (Fig. 8.13). At nucleic acid target concentrations less than 1 nM, the gold probes hybridized to the glass surface are spectroscopically silent since isolated spherical gold probes are not adequate SERS promoters. Catalytic reduction of silver onto the gold probe surface enhances the Raman scattering signal of the attached dye labels. For SERS detection on microarrays, spots on the glass slide are illuminated with 633 nm laser excitation, and the Raman scattering signal from each spot is measured. Using a Cy3 labelled oligonucleotide as a Raman tag on the nanoparticle probe, a detection limit of 20 fM was achieved for the hybridization of a 30 base oligonucleotide target on an arrayed glass slide. One advantage of this approach over previously reported scatter-based detection approaches is the reduction of background signal since silver particles and slide defects do not significantly contribute to the Raman scattering signal.
The multiple vibrational signatures for each dye create a spectroscopic finger–print for the DNA sequence present. The vibrational signatures are characterized by narrow emission bandwidths of 15–30 cm−1 which has enabled the development of multiple dyes with di erent spectroscopic signatures for barcoding or multicolor detection applications. For applications such as expression profiling, a specific vibrational mode for each dye may be chosen for multicolor detection. In initial studies performed by Mirkin, DNA modified gold probes were designed to identify six di erent pathogens in a sandwich hybridization format. Each gold probe was encoded with a unique Raman dye for detection. All of the Raman tagged probes specifically hybridized at the appropriate array locations and were correctly identified by their unique Raman spectra. By monitoring a specific vibrational mode of two spectrally unique dyes, two color signal ratioing on a single microarray spot was demonstrated by spiking in known ratios of single base mismatched targets. The Raman scattering signal ratios of the two dyes correlated well with the input target ratio providing a proof–of–concept demonstration of two color detection.
For microarrays, this detection methodology o ers the high sensitivity and high selectivity of the silver amplified DNA modified gold nanoparticles with the added benefits of multicolor detection and signal ratioing capabilities. In addition, a single excitation source may be used for a variety of Raman dyes in this SERS approach, simplifying detection instrumentation and accelerating analysis. It is also important to note that background may be minimized in this detection system since only Raman active components produce signal, eliminating background scattering signal due to surface defects or silver in scatter-based detection systems.
8 Labels and Detection Methods |
171 |
Fig. 8.13. Scheme showing Raman spectroscopic detection using nanoparticle probes with silver amplification. (Reprinted with permission from [31]. Copyright 2002 American Association for the Advancement of Science)
8.6.5 Electrical-Based Detection of Metal Nanoparticles
Conductivity measurements of metal nanoparticle aggregates [106] and silver amplified gold nanoparticles [107] have demonstrated that electrical properties of metal nanoparticles o er a viable route to biomolecule detection. Recently, Mirkin and coworkers reported the development of an oligonucleotide arraybased electrical detection format that utilizes DNA-modified gold nanoparticle probes for nucleic acid detection, Fig. 8.14 [32]. Oligonucleotide probe sequences were deposited in a 20 micron gap between pairs of gold microelectrodes on glass supports, and used to capture nucleic acid targets in a sandwich hybridization with DNA-modified gold probes in the electrode gap. Silver amplification of the gold particles created a conductivity bridge between the electrodes, which results in a measurable change in conductivity.
172 James J. Storho et al.
Initial testing was performed on a model SNP array. Capture sequences containing the four possible base permutations (A, C, G, and T) at the SNP site were deposited in between four electrode pairs. An assay was performed by hybridization of a 10 nM oligonucleotide target solution to the electrode array, followed by gold nanoparticle labelling and silver development. After a salt stringency wash, the resistance at the perfectly matched oligonucleotide probe decreased to 500 Ω, while the 3 mismatched oligonucleotide probes show resistances greater than 200 MΩ. Therefore, the match:mismatch signal ratio in this detection format translates to greater than 500,000:1. An unoptimized lower limit of detection of 500 fM target was achieved via this detection approach.
This electrical detection format combines the benefits of robust and inexpensive electronic detection hardware with the high sensitivity and specificity of gold nanoparticle probes. In addition, the use of salt based stringency o ers a method for performing hybridization assays without the need for temperature control. In principle, the sensitivity of this system can be substantially increased by reducing electrode gap size, which will minimize the number of probe particles required to obtain a measurable signal. These combined attributes are well suited for clinical diagnostics and potentially point–of–care diagnostic applications. In order to achieve this, the system will need to be tested with genomic DNA or RNA samples in more complex sample environments. This detection format is also highly scalable since larger microelectrode arrays can be fabricated using conventional lithographic techniques.
8.7 Conclusions
The various microarray labelling and detection methodologies discussed o er specific advantages in sensitivity, specificity, dynamic range, cost, or number of distinguishable labels when compared to traditional organic fluorophore labelling and detection. Therefore, the ideal labelling and detection strategy is highly dependent on the specific needs of the microarray application. For high sensitivity gene expression applications, Genisphere’s 3DNA dendrimer technology and RLS nanoparticle labels exhibit superior sensitivity to conventional direct Cy3 labelling in a two color labelling format. With both tech-
Fig. 8.14. Scheme showing electrical detection of nucleic acids using silver amplification of gold nanoparticle probes. (Reprinted with permission from [31]. Copyright 2002 American Association for the Advancement of Science)
8 Labels and Detection Methods |
173 |
nologies, it has been demonstrated that up to 10–fold less RNA is required for detection [21,77]. Up-converting phosphor labels demonstrate marginally better sensitivity than Cy3 labelling in gene expression applications to date [22]. Even greater detection sensitivity is attainable through further optimization of these nascent labelling and detection strategies.
Certain nanoparticle and phosphor-based labelling methodologies o er a larger number of distinguishable colors than conventional organic dyes, combined with simplified and lower cost instrumentation (e.g. single source excitation). The potential for enhanced multiplexing capability is especially important for liquid-based array and barcoding applications. Quantum dots (i.e. semiconductor nanoparticles) o er at least 6 distinguishable colors with a single excitation source, using particles of di erent size and composition [42], providing the potential for thousands of unique codes through combination of various colors and intensities, all with higher photostability [50]. One drawback of this labelling methodology is the toxicity of CdSe particles, which requires careful handling and disposal. Phosphor technology also o ers the potential for more colors (six spectrally unique colors reported) with the added benefits of single source infrared excitation and longer decay times, which minimizes background fluorescence [55]. Finally, nanoparticle probe-based SERS labels o er the greatest potential for multiplexing combined with high sensitivity [31].
The electrochemical detection platform [23, 59, 60] o ers one of the most robust and lowest cost detection strategies, yet, sensitivity limitations in current assays necessitates the use of target amplification, thereby increasing assay complexity and cost. For applications in clinical diagnostics such as SNP detection and infectious disease identification, the elimination of target amplification represents a holy grail, since it would increase assay reliability, significantly reduce cost and assay complexity, and save time. Assuming that a drop of blood is a reasonable target source, sensitivities of < 106 target copies are required for detection of single copy targets in total human genomic DNA in microarray type applications without target amplification. Detection limits of 100 aM (3000 target copies) have been achieved using Nanosphere’s DNAmodified gold nanoparticle (15 nm diameter) technology in conjunction with simple optical detection instrumentation for nucleic acid detection. However, for hybridization based detection of SNPs or mutational sequence changes of just a few bp, specificity is even more critical than sensitivity in the absence of complexity reduction [88]. Here too the higher specificity of DNA-modified gold probes conferred by the sharp melting transitions has enabled detection of gene sequences within unamplified human genomic DNA samples using oligonucleotide microarrays [25]. It is envisioned that strategies such as this will result in broad-based genetic disease diagnostics, with equal potential for infectious disease identification. However, in the latter case a single life cell can be detected by conventional microbiological procedures (‘gold standard’), making the necessity of a short culture period likely for some bacterial diagnostic applications where < 103 copies of the organism are present. Finally,
174 James J. Storho et al.
point–of–care diagnostic applications will require not only high sensitivity and specificity, but also simple, rapid, and robust detection assays. Gold nanoparticle probe-based electrical detection systems that lend themselves to assay miniaturization and planar device integration have demonstrated that these goals may be achievable in the not too distant future.
References
1.Venter JC, Adams MD, Myers EW et al., 2001. The sequence of the human genome. Science 291, 1304–
2.Lander ES, Linton LM, Birren B et al., 2001. Initial sequencing and analysis of the human genome. Nature 409, 860–921
3.Chee M, Yang R, Hubbell E et al., 1996. Accessing genetic information with high–density DNA arrays. Science 274, 610–614
4.Lockhart DJ, Winzeler EA, 2000. Genomics, gene expression, and DNA arrays. Nature 405, 827–836
5.Fodor SPA, Read JL, Pirrung MC et al., 1991. Light–Directed, Spatially Addressable Parallel Chemical Synthesis. Science 251, 767–773
6.Duggan DJ, Bittner M, Chen Y et al., 1999. Expression profiling using cDNA microarrays. Nature genetics supplement 21, 10–14
7.Lipshutz RJ, Fodor SPA, Gingeras TR et al., 1999. High density synthetic oligonucleotide arrays. Nature genetics supplement 21, 20–24
8.Spellman PT, Sherlock G, Zhang MQ et al., 1998. Comprehensive identification of cell cycle–regulated genes of the yeast Saccharomyces cerevisiae by microarray hybridization. Mol. Biol. Cell 9, 3273–3297
9.Clarke PA, Poele RT, Wooster R et al., 2001. Gene expression microarray analysis in cancer biology, pharmacology, and drug development: progress and potential. Biochem. Pharmacol. 62, 1311–1336
10.Debouck C, Goodfellow PN, 1999. DNA microarrays in drug discovery and development. Nature Genetics 21, 48–50
11.Golub TR, Slonim DK, Tamayo P et al., 1999. Molecular classification of cancer: Class discovery and class prediction by gene expression monitoring. Science 286, 531–537
12.Chakravarti A, 1999. Population genetics–making sense out of sequence. Nature genetics supplement 21, 56–60
13.Wang DG, Fan JB, Siao CJ et al., 1998. Large–scale identification, mapping, and genotyping of single– nucleotide polymorphisms in the human genome. Science 280, 1077–1082
14.Hacia JG, 1999. Resequencing and mutational analysis using oligonucleotide microarrays. Nature Genetics 21, 42–47
15.Hacia JG, Fan JB, Ryder O et al., 1999. Determination of ancestral alleles for human single–nucleotide polymorphisms using high–density oligonucleotide arrays. Nature Genetics 22, 164–167
16.Cronin MT, Fucini RV, Kim SM et al., 1996. Cystic fibrosis mutation detection by hybridization to light– generated DNA probe arrays. Hum. Mutat. 7, 244–255
17.Longenbach-Huber S, Safgren S, Raich T et al., 2001. Cytochrome P450 (CYP450) genotyping on the CodeLink (TM) bioarray. Clin. Chem. 47, 37
8 Labels and Detection Methods |
175 |
18.Guo Z, Guilfoyle RA, Thiel AJ et al., 1994. Direct Fluorescence Analysis of Genetic Polymorphisms by Hybridization with Oligonucleotide Arrays on Glass Supports. Nucleic Acids Res. 22, 5456–5465
19.Hacia JG, Brody LC, Chee MS, et al. (1996) Detection of heterozygous mutations in BRCA1 using high density oligonucleotide arrays and two–colour fluorescence analysis. Nature Genetics 14:441–447
20.Bowtell DD, Sambrook JF (Eds.) (2002) DNA Microarrays: A Molecular Cloning Manual. Cold Spring Harbor Laboratory Press, New York
21.Stears RL, Getts RC, Gullans SR (2000) A novel, sensitive detection system for high–density microarrays using dendrimer technology. Physiological Genomics 3:93–99
22.van de Rijke F, Zijlmans H, Li S, et al. (2001) Up–converting phosphor reporters for nucleic acid microarrays. Nature Biotechnology 19:273–276
23.Umek RM, Lin SW, Vielmetter J, et al. (2001) Electronic detection of nucleic acids – A versatile platform for molecular diagnostics. Journal of Molecular Diagnostics 3:74–84
24.Gerion D, Parak WJ, Williams SC, et al. (2002) Sorting fluorescent nano– crystals with DNA. Journal of the American Chemical Society 124:7070–7074
25.Storho JJ, Marla SM, Bao P, et al. (2004) Gold nanoparticle–based detection of genomic DNA targets on microarrays using a novel optical detection system. Biosensors and Bioelectronics 19:875–883
26.Yguerabide J, Yguerabide EE (1998) Light–scattering submicroscopic particles as highly fluorescent analogs and their use as tracer labels in clinical and biological applications – II. Experimental characterization. Analytical Biochemistry 262:157–176
27.See white papers at www.geniconsciences.com
28.Alexandre I, Hamels S, Dufour S, et al. (2001) Colorimetric silver detection of DNA microarrays. Analytical Biochemistry 295:1–8
29.Song F, Zhou F, Wang J, et al. (2002) Detection of oligonucleotide hybridization at femtomolar level and sequence–specific gene analysis of the arabidopsis thaliana leaf extract with an ultrasensitive surface plasmon resonance spectrometer. Nucleic Acids Research 30:e72
30.He L, Musick MD, Nicewarner SR, et al. (2000) Colloidal Au–enhanced surface plasmon resonance for ultrasensitive detection of DNA hybridization. Journal of the American Chemical Society 122:9071–9077
31.Cao YWC, Jin RC, Mirkin CA (2002) Nanoparticles with Raman spectroscopic fingerprints for DNA and RNA detection. Science 297:1536–1540
32.Park SJ, Taton TA, Mirkin CA (2002) Array–Based Electrical Detection of DNA with Nanoparticle Probes. Science 295:1503–1506
33.Nie SM, Zare RN (1997) Optical detection of single molecules. Annual Review of Biophysics and Biomolecular Structure 26:567–596
34.Cheung VG, Morley M, Aguilar F, et al. (1999) Making and reading microarrays. Nature genetics supplement 21:15–19
35.Brown CS, Goodwin PC, Sorger PK (2001) Image metrics in the statistical analysis of DNA microarray data. Proceedings of the National Academy of Sciences of the United States of America 98:8944–8949
36.Lindroos K, Sigurdsson S, Johansson K, et al. (2002) Multiplex SNP genotyping in pooled DNA samples by a four–color microarray system. Nucleic Acids Research 30:e70
176James J. Storho et al.
37.Collins ML, Irvine B, Tyner D, et al. (1997) A branched DNA signal amplification assay for quantification of nucleic acid targets below 100 molecules/ml. Nucleic Acids Research 25:2979–2984
38.Shchepinov MS, Udalova IA, Bridgman AJ, et al. (1997) Oligonucleotide dendrimers: synthesis and use as polylabelled DNA probes. Nucleic Acids Research 25:4447–4454
39.Nilsen TW, Grayzel J, Prensky W (1997) Dendritic Nucleic Acid Structures. Journal of Theoretical Biology 187:273–284
40.Wang J, Jiang M, Nilsen TW, et al. (1998) Dendritic Nucleic Acid Probes for DNA Biosensors. Journal of the American Chemical Society 120:8281–8282
41.Alivisatos AP (2001) Less is more in medicine – Sophisticated forms of nanotechnology will find some of their first real–world applications in biomedical research, disease diagnosis and, possibly, therapy. Scientific American 285:66– 73
42.Bruchez M, Moronne M, Gin P, et al. (1998) Semiconductor nanocrystals as fluorescent biological labels. Science 281:2013–2016
43.Chan WCW, Nie SM (1998) Quantum dot bioconjugates for ultrasensitive nonisotopic detection. Science 281:2016–2018
44.Weller H (1993) Colloidal Semiconductor Q–Particles – Chemistry in the Transition Region between Solid–State and Molecules. Angewandte Chemie– International Edition in English 32:41–53
45.Chan WCW, Maxwell DJ, Gao XH, et al. (2002) Luminescent quantum dots for multiplexed biological detection and imaging. Current Opinion in Biotechnology 13:40–46
46.Murray CB, Norris DJ, Bawendi MG (1993) Synthesis and Characterization of Nearly Monodisperse Cde (E = S, Se, Te) Semiconductor Nanocrystallites. Journal of the American Chemical Society 115:8706–8715
47.Alivisatos AP (1996) Semiconductor clusters, nanocrystals, and quantum dots. Science 271:933–937
48.Wu XY, Liu HJ, Liu JQ, et al. (2003) Immunofluorescent labeling of cancer marker Her2 and other cellular targets with semiconductor quantum dots. Nature Biotechnology 21:41–46
49.Pathak S, Choi SK, Arnheim N, et al. (2001) Hydroxylated quantum dots as luminescent probes for in situ hybridization. Journal of the American Chemical Society 123:4103–4104
50.Han MY, Gao XH, Su JZ, et al. (2001) Quantum–dot–tagged microbeads for multiplexed optical coding of biomolecules. Nature Biotechnology 19:631–635
51.Ferguson JA, Steemers FJ, Walt DR (2000) High–density fiber–optic DNA random microsphere array. Analytical Chemistry 72:5618–5624
52.Xu HX, Sha MY, Wong EY, et al. (2003) Multiplexed SNP genotyping using the Qbead (TM) system: a quantum dot–encoded microsphere–based assay. Nucleic Acids Research 31:e43
53.Ostermay.Fw (1971) Preparation and Properties of Infrared–to–Visible Conversion Phosphors. Metallurgical Transactions 2:747
54.Hampl J, Hall M, Mufti NA, et al. (2001) Upconverting phosphor reporters in immunochromatographic assays. Analytical Biochemistry 288:176–187
55.Zijlmans H, Bonnet J, Burton J, et al. (1999) Detection of cell and tissue surface antigens using up– converting phosphors: A new reporter technology. Analytical Biochemistry 267:30–36
8 Labels and Detection Methods |
177 |
56.Verwoerd NP, Hennink EJ, Bonnet J, et al. (1994) Use of Ferroelectric Liquid–Crystal Shutters for Time–Resolved Fluorescence Microscopy. Cytometry 16:113–117
57.Beverloo HB, Vanschadewijk A, Zijlmans H, et al. (1992) Immunochemical Detection of Proteins and Nucleic–Acids on Filters Using Small Luminescent Inorganic Crystals as Markers. Analytical Biochemistry 203:326–334
58.Dejneka MJ, Streltsov A, Pal S, et al. (2003) Rare earth–doped glass micro– barcodes. Proceedings of the National Academy of Sciences of the United States of America 100:389–393
59.Boon EM, Ceres DM, Drummond TG, et al. (2000) Mutation detection by electrocatalysis at DNA–modified electrodes. Nature Biotechnology 18:1096–1100
60.Napier ME, Loomis CR, Sistare MF, et al. (1997) Probing biomolecule recognition with electron transfer: Electrochemical sensors for DNA hybridization. Bioconjugate Chemistry 8:906–913
61.Wang J (2001) Glucose biosensors: 40 years of advances and challenges. Electroanalysis 13:983–988
62.Yu CJ, Wan YJ, Yowanto H, et al. (2001) Electronic detection of single–base mismatches in DNA with ferrocene–modified probes. Journal of the American Chemical Society 123:11155–11161
63.Armistead PM, Thorp HH (2000) Modification of indium tin oxide electrodes with nucleic acids: Detection of attomole quantities of immobilized DNA by electrocatalysis. Analytical Chemistry 72:3764–3770
64.Armistead PM, Thorp HH (2002) Electrochemical detection of gene expression in tumor samples: Overexpression of Rak nuclear tyrosine kinase. Bioconjugate Chemistry 13:172–176
65.Popovich ND (2001) Mediated electrochemical detection of nucleic acids for drug discovery and clinical diagnostics. IVD Technology April
66.Boon EM, Kisko JL, Barton JK (2002) In Redox Cell Biology and Genetics, Pt B, Vol. 353, pp. 506–522
67.Handley DA (1991) In Colloidal Gold; Principles, Methods, and Applications, Vol. 1 (Ed, Hayat, M. A.) Academic Press, San Diego, pp. 1–12
68.Rohringer R (1991) In Colloidal Gold: Principles, Methods, and Applications, Vol. 2 (Ed, Hayat, M. A.) Academic Press, San Diego, pp. 398–411
69.Niemeyer CM (2001) Nanoparticles, Proteins, and Nucleic Acids: Biotechnology Meets Materials Science. Angewandte Chemie–International Edition 40:4128–4158
70.Storho JJ, Mirkin CA (1999) Programmed Materials Synthesis with DNA. Chemical Reviews 99:1849–1862
71.Taton TA, Mirkin CA, Letsinger RL (2000) Scanometric DNA array detection with nanoparticle probes. Science 289:1757–1760
72.Handley DA (1991) In Colloidal Gold; Principles, Methods, and Applications, Vol. 1 (Ed, Hayat, M. A.) Academic Press, San Diego, pp. 13–32
73.Mirkin CA, Letsinger RL, Mucic RC, et al. (1996) A DNA–based method for rationally assembling nanoparticles into macroscopic materials. Nature 382:607– 609
74.Elghanian R, Storho JJ, Mucic RC, et al. (1997) Selective colorimetric detection of polynucleotides based on the distance–dependent optical properties of gold nanoparticles. Science 277:1078–1081
178James J. Storho et al.
75.Brockmann JM, Nelson BP, Corn RM (2000) Surface Plasmon Resonance Imaging Measurements of Ultrathin Organic Films. Annual Reviews of Physical Chemistry 51:41–63
76.Taton TA, Lu G, Mirkin CA (2001) Two–color labeling of oligonucleotide arrays via size–selective scattering of nanoparticle probes. Journal of the American Chemical Society 123:5164–5165
77.Bao P, Frutos AG, Greef C, et al. (2002) High–Sensitivity Detection of DNA Hybridization on Microarrays Using Resonance Light Scattering. Analytical Chemistry 74:1792–1797
78.Boyer D, Tamarat P, Maali A, et al. (2002) Photothermal imaging of nanometer–sized metal particles among scatterers. Science 297:1160–1163
79.Wang J, Song FY, Zhou FM (2002) Silver–enhanced imaging of DNA hybridization at DNA microarrays with scanning electrochemical microscopy. Langmuir 18:6653–6658
80.Faraday M (1857) Experimental relations of gold (and other metals) to light. Philos Trans R Soc London 147:145
81.Jin RC, Wu GS, Li Z, et al. (2003) What controls the melting properties of DNA–linked gold nanoparticle assemblies? Journal of the American Chemical Society 125:1643–1654
82.Link S, Wang ZL, El–Sayed MA (1999) Alloy formation of gold–silver nanoparticles and the dependence of the plasmon absorption on their composition. Journal of Physical Chemistry B 103:3529–3533
83.Yguerabide J, Yguerabide EE (1998) Light–scattering submicroscopic particles as highly fluorescent analogs and their use as tracer labels in clinical and biological applications – I. Theory. Analytical Biochemistry 262:137–156
84.Scopsi L (1991) In Colloidal Gold: Principles, Methods, and Applications, Vol. 1 (Ed, Hayat, M. A.) Academic Press, San Diego, pp. 251–295
85.Jin RC, Cao YW, Mirkin CA, et al. (2001) Photoinduced conversion of silver nanospheres to nanoprisms. Science 294:1901–1903
86.Yguerabide J, Yguerabide EE (2001) Resonance Light Scattering Particles as Ultrasensitive Labels for Detection of Analytes in a Wide Range of Applications. Journal of Cellular Biochemistry Supplement 37:71–81
87.Taton TA, Mucic RC, Mirkin CA, et al. (2000) The DNA–mediated formation of supramolecular mono– and multilayered nanoparticle structures. Journal of the American Chemical Society 122:6305–6306
88.Lander ES (1999) Array of hope. Nature genetics supplement 21:3–4
89.Oldenburg SJ, Genick CC, Clark KA, et al. (2002) Base pair mismatch recognition using plasmon resonant particle labels. Analytical Biochemistry 309:109– 116
90.Schultz S, Smith DR, Mock JJ, et al. (2000) Single–target molecule detection with nonbleaching multicolor optical immunolabels. Proceedings of the National Academy of Sciences of the United States of America 97:996–1001
91.Alexandre I, Houbion Y, Collet J, et al. (2002) Compact disc with both numeric and genomic information as DNA microarray platform. Biotechniques 33:435
92.Liedberg B, Nylander C, Lundstrom I (1995) Biosensing with surface plasmon resonance – how it all started. Biosensors and Bioelectronics 10:i–ix
93.Homola J, Yee SS, Gauglitz G (1999) Surface plasmon resonance sensors: review. Sensors and Actuators B 54:3–15
8 Labels and Detection Methods |
179 |
94.Peterlinz KA, Georgiadis RM (1997) Observation of hybridization and dehybridization of thiol– tethered DNA using two–color surface plasmon resonance spectroscopy. Journal of the American Chemical Society 119:3401–3402
95.Haes AJ, Van Duyne RP (2002) A nanoscale optical biosensor: Sensitivity and selectivity of an approach based on the localized surface plasmon resonance spectroscopy of triangular silver nanoparticles. Journal of the American Chemical Society 124:10596–10604
96.Jordan CE, Frutos AG, Thiel AJ, et al. (1997) Surface plasmon resonance imaging measurements of DNA hybridization adsorption and strepta– vidin/DNA multilayer formation at chemically modified gold surfaces. Analytical Chemistry 69:4939–4947
97.Thiel AJ, Frutos AG, Jordan CE, et al. (1997) In situ surface plasmon resonance imaging detection of DNA hybridization to oligonucleotide arrays on gold surfaces. Analytical Chemistry 69:4948–4956
98.Goodrich GP, Nicewarner SR, He L, et al. (2001) Nanoparticle–amplified surface plasmon resonance for detection of DNA hybridization. Proceedings of SPIE 2:80–85
99.Raschke G, Kowarik S, Franzl T, et al. (2003) Biomolecular Recognition Based on Single Gold Nanoparticle Light Scattering. Nano Letters 3:935–938
100.Freeman RG, Grabar KC, Allison KJ, et al. (1995) Self–Assembled Metal Colloid Monolayers – an Approach to Sers Substrates. Science 267:1629–1632
101.Mulvaney SP, Keating CD (2000) Raman spectroscopy. Analytical Chemistry 72:145R–157R
102.Isola NR, Stokes DL, Vo-Dinh T (1998) Surface–Enhanced Raman Gene Probe for HIV Detection. Analytical Chemistry 70:1352–1356
103.Haynes CL, Van Duyne RP (2003) Plasmon–Sampled Surface–Enhanced Raman Excitation Spectroscopy. Journal of Physical Chemistry B 107:7426–7433
104.Nie SM, Emery SR (1997) Probing single molecules and single nanoparticles by surface– enhanced Raman scattering. Science 275:1102–1106
105.Graham D, Mallinder BJ, Whitcombe D, et al. (2002) Simple multiplex genotyping by surface–enhanced resonance Raman scattering. Analytical Chemistry 74:1069
106.Brust M, Bethell D, Schi rin DJ, et al. (1995) Novel Gold–Dithiol Nano– Networks with Nonmetallic Electronic– Properties. Advanced Materials 7:795–
107.Velev OD, Kaler EW (1999) In situ assembly of colloidal particles into miniaturized biosensors. Langmuir 15:3693–3698