

Computational Methods for Protein Structure Prediction & Modeling V1 - Xu Xu and Liang
.pdf380 |
Jianpeng Ma |
Fig. 11.17 Comparison of the three lowest-energy topology candidates for an all-helical protein 2ezh whose native topology was ranked the 2nd lowest.
one extrahelical region was predicted for 1l0i, which obviously influence the ranks of the native topologies of these two proteins.
In the case of 2cro, due to the length similarity of all five helices of this protein that gave rise to the largest number of accessible topology candidates in the initial screening, the native topology was ranked as the 12th lowest in average energy. However, despite the large error, the methods were very effective in narrowing down the searching space of possible topologies (the native topology was ranked as the 12th among all 1544 accessible candidates).
Finally, the median energy value of the ensemble, instead of the arithmetic mean, was computed to rank the topology candidates. This was to cross-validate the errors in our ranking procedure resulting from the non-Boltzmann random sampling in generating the perturbed structure ensemble. Mathematically, the median indicates a true average in the absence of a priori knowledge of data distribution. The results, shown in the 10th column of Table 11.1, are very consistent with those ranked according to arithmetic mean (9th column), indicating the fidelity of the ranking procedure.
11.4.4Sheet-Containing Proteins
Geometry approach. We had a total of 19 alpha-beta-mixed proteins and 6 all-beta proteins. The 19 alpha-beta-mixed proteins contain three different types of architecture and seven types of topology [3 proteins do not have classified architecture or topology in CATH (Orengo et al., 1997)]. The 6 all-beta proteins contain three types of architecture and three types of topology (1 protein does not have classified architecture or topology). The seventh column of Table 11.2 shows the results of geometry analysis. In seven cases, the native topology was ranked as the lowest energy (1st) and in eight other cases for alpha-beta-mixed proteins was ranked within the top 10. In the all-beta cases, the native topology of one was ranked as the 1st and four others within the top 10.
11. Intermediate-Resolution Density Maps |
381 |
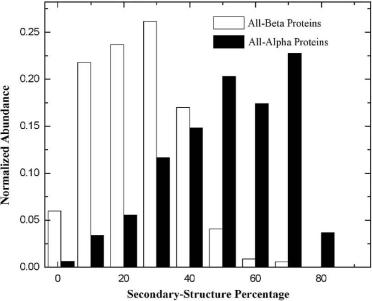
Fig. 11.18 Comparison of secondary-structural content in all-helical proteins versus all-beta proteins. It is clear that all-beta proteins have much lower secondary-structural content than allhelical proteins.
There are several reasons why the search for sheet-containing topology is more difficult. All-beta proteins have an overall lower percentage of secondary structures and higher percentage of loop regions compared with all-helical proteins (Fig. 11.18). Therefore, they have increased the complexity of the topology space, i.e., fewer topology candidates can be filtered out in the initial screening. Moreover, -helices have more rigid structures with strong local interactions, while -strands can bend and twist, and also involve long-range stabilizing interactions.
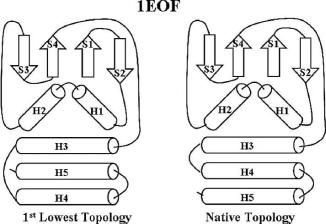
Energetics approach: Table 11.2 shows the results of energetics approach on the 25 sheet-containing proteins. All of the accessible topologies were initially screened by geometry analysis. Both the arithmetic mean and median of the energy were used as ranking criteria to avoid sampling bias. The final ranks of the 25 proteins are shown in columns 11 and 12, respectively, of Table 11.2. The results from the two ranking methods are quite similar. Totally, the native topologies of 18 out of 25 proteins have their average energy ranked the lowest. For the remaining 7 proteins, 2 have their native topologies ranked as the 2nd-lowest average energy and 2 others as 3rd. In all of these 4 cases, the difference between the lowest-energy topology (1st) and the native topology (2nd) was an exchange of two secondary structures with similar length and symmetric spatial location or the shift of the direction of certain strands in the skeleton. As an example, Fig. 11.19 compares the lowest-energy topology (1st) and the native topology (2nd) of protein 1eof.
382 |
Jianpeng Ma |
Fig. 11.19 Comparison of the lowest-energy topology with the native topology for a sheetcontaining protein 1eof whose native topology was ranked the 2nd lowest.
11.4.5Application to Incomplete Skeletons
In all previous test cases, the secondary structures in skeleton were assumed to be correct and they are used to judge the correctness of predicted assignment on sequence. In reality, however, it is very likely that skeletons from experimental maps have one or more secondary structures, especially short ones, missing. This issue of incomplete skeleton was tested on protein 1bvc that has eight -helices. The skeletons of 1bvc purposely have one of the short helices H3 or H4 or both missing, which led to more accessible topology candidates being retained for the skeleton after initial screening. The geometry approach, however, consistently identified the native topology as the most favorable topology (1st) in all three cases. The employment of the energetics approach ranked the native topology 2nd, 3rd, and 1st when the missing component(s) was H3, H4, and both, respectively. This simple example suggested that our methods can tolerate small errors in skeleton.
It should be emphasized that, in general, the performance of the method does depend on the accuracy of secondary structures both in skeleton and in assignment. Usually, when the skeletons are correct (the normal assumption), the predicted assignment is judged based on that; when the skeletons have some small ones missing, the dependence on predicted assignment in sequence becomes stronger. In cases where both are drastically mistaken, the likelihood for the method to fail will be inevitably larger.
11.4.6Application to Real Experimental Data
˚
The 2 protein of reovirion structure [solved to 7.6 A by cryo-EM (Zhang et al., 2003)] has 16 -sheets. One of them located at the tip of the structure was chosen to test our energetics procedure because of its continuity in sequence and comparable
11. Intermediate-Resolution Density Maps |
383 |
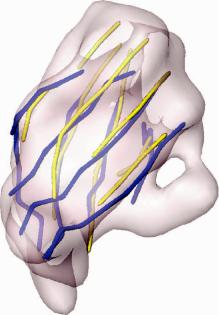
Fig. 11.20 Superposition of the secondary-structural skeleton modeled by sheetminer and sheet-
˚
tracer (yellow) based on an experimental 7.6-A cryo-EM electron density maps (the transparent envelope) with that from the crystal structure (blue, PDB code: 1 ej6) of the 2 protein of reovirus.
size to all other test cases. First, the skeleton of this -sheet was generated by sheetminer (Kong and Ma, 2003) and sheettracer (Kong et al., 2004). All eight strands were successfully traced, as shown in Fig. 11.20 superimposed with the independently solved crystal structure (Reinisch et al., 2000). The secondary structure assignment was given by the algorithm DSC (King and Sternberg, 1996).
In the initial screening, a large number of accessible topologies were retained and geometry filtering ranked the native topology as 116th. By combining the sheet motif filter with the geometry filter, the native topology was ranked as 4th. When eight topology candidates were processed by energetic analysis, the native topology moved to 1st. In this case, despite the large deviations of the main chains of the traced -strands from the crystal structure, our method was still able to correctly identify the native topology.
11.4.7Concluding Discussion
Our computational method is fully applicable to determining topology for skeletons of unknown structures. The procedure is to first use the initial screening to remove any inaccessible topologies, then to use the geometry-based filter to rank all of the accessible topology candidates, and finally, with an appropriate cutoff, to select a fraction of accessible topologies for energetics analysis. This procedure does in
384 |
Jianpeng Ma |
many cases narrow down the native topology to be the most energetically favorable one on the final list. Moreover, in real applications, any additional knowledge about the structure can be used to filter the native topology. For example, if one knows the identity of one or a few secondary structures in the density maps, it should be enormously helpful for filtering out the nonnative topology candidates.
The method is not perfect at this stage. It suffers from the errors contained in both structural measurement and secondary structural prediction. There are cases where the method would fail to narrow down the native topology candidates as top choices, particularly in cases where severe mismatch of secondary structures occurs between the skeleton modeled from density maps and the assignment predicted from sequence. Nevertheless, our method allows one to determine native protein topology from fairly limited structural data. The basic concept involved in this study may also be useful in structure prediction by allowing effective discrimination of nonnative topology (fold) candidates from the native topology in the vast topology space.
Finally, the successful use of the ensemble average energy of randomly perturbed structures for evaluating topology candidates may also have an important implication for threading research (Elofsson et al., 1996; Jones et al., 1995; Jones and Thornton, 1996; Kihara et al., 2001; Lu et al., 2002; Miller et al., 1996; Skolnick et al., 2001). One could in principle get a better answer in evaluating decoys if effective structural variations and averaging around the given template are taken into account.
11.5 Future Perspectives
In the coming years, as the field of structure biology continues to deal with larger and more complex systems, it is inevitable that the resolutions for some of them are lower, experimental information available for structural modeling is more meager, and thus computational modeling aided by partial experimental data is increasingly more important. Other examples already in the literature include recent development of computational methods that utilize small-angle X-ray scattering (SAXS) for assisting low-resolution structural determination, in which the one-dimensional X-ray scattering profile is used as a constraint for deriving three-dimensional structures of small globular proteins (Wu et al., 2005) and large complexes (Costenaro et al., 2005b; Davies et al., 2005b; Svergun et al., 2001; Svergun and Koch, 2002). Incomplete experimental data were also used to derive biological structures in NMR-related fields.
In all of these cases, a common feature is that the effective resolutions of the structures were significantly improved with the assistance of powerful computational methods. It is expected that, in the near future, more and more new modeling algorithms will be developed to effectively make use of those either incomplete or low-resolution experimental data, from which no structural models can be built by any conventional methods.
11. Intermediate-Resolution Density Maps |
385 |
Acknowledgment
The author acknowledges support from the National Institutes of Health (R01-GM067801).
References
Arnold, E., and Rossmann, M. G. 1988. The use of molecular-replacement phases for the refinement of the human rhinovirus 14 structure. Acta Crystallogr. A 44(Pt. 3):270–282.
Bahar, I., and Jernigan, R. L. 1997. Inter-residue potentials in globular proteins and the dominance of highly specific hydrophilic interactions at close separation. J. Mol. Biol. 266:195–214.
Ban, N., Freeborn, B., Nissen, P., Penczek, P., Grassucci, R. A., Sweet, R., Frank, J.,
˚
Moore, P. B., and Steitz, T. A. 1998. A 9 A resolution X-ray crystallographic map of the large ribosomal subunit. Cell 93:1105–1115.
Ban, N., Nissen, P., Hansen, J., Capel, M., Moore, P. B., and Steitz, T. A. 1999.
˚
Placement of protein and RNA structures into a 5 A-resolution map of the 50S ribosomal subunit. Nature 400:841–847.
Ban, N., Nissen, P., Hansen, J., Moore, P. B., and Steitz, T. A. 2000. The complete
˚
atomic structure of the large ribosomal subunit at 2.4 A resolution. Science 289:905–920.
Bottcher, B., Wynne, S. A., and Crowther, R. A. 1997. Determination of the fold of the core protein of hepatitis B virus by electron cryomicroscopy. Nature 386:88–91.
Conway, J. F., Cheng, N., Zlotnick, A., Wingfield, P. T., Stahl, S. J., and Steven, A. C. 1997. Visualization of a 4-helix bundle in the hepatitis B virus capsid by cryo-electron microscopy. Nature 386:91–94.
Costenaro, L., Grossmann, J. G., Ebel, C., and Maxwell, A. 2005. Small-angle X-ray scattering reveals the solution structure of the full-length DNA gyrase a subunit. Structure 13:287–296.
Davies, J. M., Tsuruta, H., May, A. P., and Weis, W. I. 2005. Conformational changes of p97 during nucleotide hydrolysis determined by small-angle X-ray scattering. Structure 13:183–195.
DeRosier, D. J., and Harrison, S. C. 1997. Macromolecular assemblages. Sizing things up. Curr. Opin. Struct. Biol. 7:237–238.
Eklund, H., Samma, J. P., Wallen, L., Branden, C. I., Akeson, A., and Jones, T. A. 1981. Structure of a triclinic ternary complex of horse liver alcohol dehydro-
˚
genase at 2.9 A resolution. J. Mol. Biol. 146:561–587.
Elofsson, A., Fischer, D., Rice, D. W., Le Grand, S. M., and Eisenberg, D. 1996. A study of combined structure/sequence profiles. Fold. Des. 1:451–461.
386 |
Jianpeng Ma |
Gaudet, R., Savage, J. R., McLaughlin, J. N., Willardson, B. M., and Sigler, P. B. 1999. A molecular mechanism for the phosphorylation-dependent regulation of heterotrimeric G proteins by phosducin. Mol. Cell 3:649–660.
Hoover, D. M., and Ludwig, M. L. 1997. A flavodoxin that is required for enzyme
˚
activation: The structure of oxidized flavodoxin from Escherichia coli at 1.8 A resolution. Protein Sci. 6:2525–2537.
Jiang, W., Baker, M. L., Ludtke, S. J., and Chiu, W. 2001. Bridging the information gap: Computational tools for intermediate resolution structure interpretation. J. Mol. Biol. 308:1033–1044.
Jones, D. T., Miller, R. T., and Thornton, J. M. 1995. Successful protein fold recognition by optimal sequence threading validated by rigorous blind testing. Proteins 23:387–397.
Jones, D. T., and Thornton, J. M. 1996. Potential energy functions for threading.
Curr. Opin. Struct. Biol. 6:210–216.
Khan, A. R., Baker, B. M., Ghosh, P., Biddison, W. E., and Wiley, D. C. 2000. The structure and stability of an HLA-A*0201/octameric tax peptide complex with an empty conserved peptide-N-terminal binding site. J. Immunol. 164:6398– 6405.
Kihara, D., Lu, H., Kolinski, A., and Skolnick, J. 2001. TOUCHSTONE: An ab initio protein structure prediction method that uses threading-based tertiary restraints.
Proc. Natl. Acad. Sci. USA 98:10125–10130.
King, R. D., and Sternberg, M. J. E. 1996. Identification and application of the concepts important for accurate and reliable protein secondary structure prediction. Protein Sci. 5:2298–2310.
Kong, Y., and Ma, J. 2003. A structural-informatics approach for mining -sheets: Locating sheets in intermediate-resolution density maps. J. Mol. Biol. 332:399– 413.
Kong, Y., Zhang, X., Baker, T. S., and Ma, J. 2004. A structural-informatics approach for tracing -sheets: Building pseudo-C traces for -strands in intermediateresolution density maps. J. Mol. Biol. 339:117–130.
Kuhn, R. J., Zhang, W., Rossmann, M. G., Pletnev, S. V., Corver, J., Lenches, E., Jones, C. T., Mukhopadhyay, S., Chipman, P. R., Strauss, E. G., Baker, T. S., and Strauss, J. H. 2002. Structure of dengue virus: Implications for flavivirus organization, maturation, and fusion. Cell 108:717–725.
Li, H., DeRosier, D., Nicholson, W., Nogales, E., and Downing, K. 2002. Microtubule
˚
structure at 8 A resolution. Structure 10:1317.
Lu, L., Lu, H., and Skolnick, J. 2002. MULTIPROSPECTOR: An algorithm for the prediction of protein–protein interactions by multimeric threading. Proteins 49:350–364.
Ludtke, S. J., Baldwin, P. R., and Chiu, W. 1999. EMAN: Semiautomated software for high-resolution single-particle reconstructions. J. Struct. Biol. 128:82–97.
Mancini, E. J., Clarke, M., Gowen, B. E., Rutten, T., and Fuller, S. D. 2000. Cryoelectron microscopy reveals the functional organization of an enveloped virus, Semliki Forest virus. Mol. Cell 5:255–266.
11. Intermediate-Resolution Density Maps |
387 |
Mayer, S. M., Gormal, C. A., Smith, B. E., and Lawson, D. M. 2002. Crystallographic analysis of the MoFe protein of nitrogenase from a nifV mutant of Klebsiella pneumoniae identifies citrate as a ligand to the molybdenum of iron molybdenum cofactor (FeMoco). J. Biol. Chem. 277:35263–35266.
Miller, R. T., Jones, D. T., and Thornton, J. M. 1996. Protein fold recognition by sequence threading: Tools and assessment techniques. Faseb J. 10:171–178.
Mimori, Y., Yamashita, I., Murata, K., Fujiyoshi, Y., Yonekura, K., Toyoshima, C., and Namba, K. 1995. The structure of the R-type straight flagellar filament of
˚
Salmonella at 9 A resolution by electron cryomicroscopy. J. Mol. Biol. 249:69– 87.
Orengo, C. A., Michie, A. D., Jones, S., Jones, D. T., Swindells, M. B., and Thornton, J. M. 1997. CATH—A hierarchic classification of protein domain structures. Structure 5:1093–1109.
Rees, D. C., Lewis, M., and Lipscomb, W. N. 1983. Refined crystal structure of
˚
carboxypeptidase A at 1.54 A resolution. J. Mol. Biol. 168:367–387. Reinisch, K. M., Nibert, M. L., and Harrison, S. C. 2000. Structure of the reovirus
˚
core at 3.6 A resolution. Nature 404:960–967.
Rossmann, M. G. 2000. Fitting atomic models into electron-microscopy maps. Acta Crystallogr. D Biol. Crystallogr. 56(Pt.10):1341–1349.
Samatey, F. A., Imada, K., Nagashima, S., Vonderviszt, F., Kumasaka, T., Yamamoto, M., and Namba, K. 2001. Structure of the bacterial flagellar protofilament and implications for a switch for supercoiling. Nature 410:331–337.
Skolnick, J., Kolinski, A., Kihara, D., Betancourt, M., Rotkiewicz, P., and Boniecki, M. 2001. Ab initio protein structure prediction via a combination of threading, lattice folding, clustering, and structure refinement. Proteins Suppl. 5:149–156.
Steinbacher, S., Seckler, R., Miller, S., Steipe, B., Huber, R., and Reinemer, P. 1994. Crystal structure of P22 tailspike protein: Interdigitated subunits in a thermostable trimer. Science 265:383–386.
Svergun, D. I., and Koch, M. H. 2002. Advances in structure analysis using smallangle scattering in solution. Curr. Opin. Struct. Biol. 12:654–660.
Svergun, D. I., Petoukhov, M. V., and Koch, M. H. 2001. Determination of domain structure of proteins from X-ray solution scattering. Biophys. J. 80:2946–2953.
Verbeek, J. J., Vlassis, N., and Krose, B. 2002. A k-segments algorithm for finding principal curves. Pattern Recognition Lett. 23:1009–1017.
Wang, G., and Dunbrack, R. L., Jr. 2003. PISCES: A protein sequence culling server.
Bioinformatics 19:1589–1591.
Wang, Q., Buckle, A. M., and Fersht, A. R. 2000. Stabilization of GroEL minichaperones by core and surface mutations. J. Mol. Biol. 298:917–926.
Wilson, D. K., Bohren, K. M., Gabbay, K. H., and Quiocho, F. A. 1992. An unlikely
˚
sugar substrate site in the 1.65 A structure of the human aldose reductase holoenzyme implicated in diabetic complications. Science 257:81–84.
Wittinghofer, F., Krengel, U., John, J., Kabsch, W., and Pai, E. F. 1991. Threedimensional structure of p21 in the active conformation and analysis of an oncogenic mutant. Environ. Health Perspect. 93:11–15.
388 |
Jianpeng Ma |
Wu, Y., Chen, M., Lu, M., Wang, Q., and Ma, J. 2005a. Determining protein topology from skeletons of secondary structures. J. Mol. Biol. 350:571–586.
Wu, Y., Tian, X., Lu, M., Chen, M., Wang, Q., and Ma, J. 2005b. Folding of small helical proteins assisted by small-angle x-ray scattering profiles. Structure 13:1587– 1597.
Zanotti, G., Panzalorto, M., Marcato, A., Malpeli, G., Folli, C., and Berni, R. 1998.
˚
Structure of pig plasma retinal-binding protein at 1.65 A resolution. Acta Crystallogr. D 54:1049–1052.
Zhang, X., Shaw, A., Bates, P. A., Newman, R. H., Gowen, B., Orlova, E., Gorman, M. A., Kondo, H., Dokurno, P., Lally, J., Leonard, G., Meyer, H., van Heel, M., and Freemont, P. S. 2000. Structure of the AAA ATPase p97. Mol. Cell 6:1473–1484.
Zhang, X., Walker, S. B., Chipman, P. R., Nibert, M. L., and Baker, T. S. 2003. Reovirus polymerase lambda 3 localized by cryo-electron microscopy of virions
˚
at a resolution of 7.6 A. Nat. Struct. Biol. 10:1011–1018.
Zhou, Z. H., Baker, M. L., Jiang, W., Dougherty, M., Jakana, J., Dong, G., Lu, G., and Chiu, W. 2001a. Electron cryomicroscopy and bioinformatics suggest protein fold models for rice dwarf virus. Nat. Struct. Biol. 8:868–873.
Zhou, Z. H., Dougherty, M., Jakana, J., He, J., Rixon, F. J., and Chiu, W. 2000. Seeing
˚
the herpesvirus capsid at 8.5 A. Science 288:877–880.
Zhou, Z. H., Liao, W., Cheng, R. H., Lawson, J. E., McCarthy, D. B., Reed, L. J., and Stoops, J. K. 2001b. Direct evidence for the size and conformational variability of the pyruvate dehydrogenase complex revealed by three-dimensional electron microscopy. The “breathing” core and its functional relationship to protein dynamics. J. Biol. Chem. 276:21704–21713.
Index
-helical 293, 295–296
-sheet 28, 131, 135, 137–138, 141, 209, 222, 225, 259, 282, 285–286, 289, 291, 293–297, 299–303
3D-jury 16
3D-profile 7
Ab initio protein structure prediction 9, 11 ab initio folding 9
accessibility 7, 19, 50, 74, 90, 239, 266, 286,
288, 291, 325, 334 |
|
|
|||
Accessible topology |
377, 379–380, 382 |
||||
additivity |
110, 291 |
|
|
||
-lactalbumin 3, 321 |
|
|
|||
alanine dipeptide |
48, 55–57 |
|
|||
alignment sensitivity |
319 |
|
|||
alignment tuning |
326, 338 |
|
|||
alpha complex 187, 190, 193 |
|
||||
alpha helix |
326 |
|
|
|
|
alpha shape |
88–89, 103, 110, 112, 186–190, |
||||
193, 195–196 |
|
|
|
|
|
AMBER 2, 45, 50, 53–58, 332 |
|
||||
amyloid 280–297, 305 |
|
|
|||
amyloid conformational states 284 |
|
||||
amyloid structure |
282–285, 289–290, 294, |
||||
305 |
|
|
|
|
|
Anfinsen’s theory of protein folding |
1 |
||||
anti-cooperative, anti-cooperativity |
122 |
||||
artificial evolution |
|
5, 327 |
|
||
association rules |
262, 268 |
|
|||
atomic force microscopy |
285 |
|
|||
AUTHORS |
126, 139 |
|
|
||
automated classification |
149, 166–167, 171, |
||||
174, 176 |
|
|
|
|
|
backbone 5, 10, 12–13, 15, 25, 56, 114, 137, 149, 155, 197, 201, 209, 221, 230
Bayesian Markov chain Monte Carlo 181, 197 beta pleated sheet 28, 131, 135, 137–138, 141,
209, 222, 225, 259, 282, 285–286, 289, 291, 293–297, 299–303
beta strand 234 Blue Gene Project 9
Boltzmann assumption 74, 76, 108
Boltzmann distribution 74–76, 93, 108 boundary surface 113–114, 183–184
C or C |
256 |
|
|
|
|
|
CAFASP |
15 |
|
|
|
|
|
Cambridge Structural Database 51 |
||||||
CAPRI |
15, 103 |
|
|
|
||
CASP 12, 14–16, 25, 238–239, 268–269, 337, |
||||||
347 |
|
|
|
|
|
|
CastP 191, 193, 198 |
|
|||||
CATH 22, 126, 139, 156, 167, 176, 201, 269, |
||||||
380 |
|
|
|
|
|
|
CATH database |
23, 267 |
|
||||
CE 155 |
|
|
|
|
|
|
CEDAR |
58 |
|
|
|
|
|
CHARMM 2, 45, 47, 50, 52–58, 329, 332, 342 |
||||||
circular dichroism |
225, 286 |
|||||
Class I force fields |
48 |
|
||||
Class II force fields 47–48 |
||||||
Cluster 110, 129, 135–137, 240, 335, 368 |
||||||
CMAP 48, 56, 266 |
|
|
||||
coiled-coil 221, 236–237 |
||||||
COILS 236–237, 283, 303 |
||||||
colony energy |
332–333, 338, 340–344 |
|||||
comparative modeling |
2–3, 5, 13, 22, 28–29, |
|||||
320, |
322–323 |
|
|
|
||
Composer |
4–5, 327 |
|
|
|||
composite model |
326 |
|
||||
concave spherical surface |
184, 188 |
|||||
condensed phase |
47, 49, 51–55, 58 |
|||||
conformation sampling |
102, 322, 329, 335–336, |
|||||
342, |
344 |
|
|
|
|
|
conformational energy |
48, 52, 55–56, 343 |
|||||
conformational free energy |
337 |
|||||
conformational searching |
10, 25, 320 |
|||||
Connolly’s surface |
183–184 |
|||||
consensus alignment |
157, 175 |
|||||
consensus evaluation |
139, 375 |
|||||
consensus prediction |
16, 218–219, 235–236, |
|||||
344 |
|
|
|
|
|
|
conserved regions |
4, 296, 321, 327–328 |
|||||
contact density |
128–129, 131, 135–137, 265 |
|||||
contact map 149, 255 |
|
|||||
contact map error (CME) |
257 |
|||||
389