

Genomics and Proteomics Engineering in Medicine and Biology - Metin Akay
.pdf144 IN SILICO RADIATION ONCOLOGY
layer surrounding the central necrotic region), and 0.2 104 cells/mm3 in the dead-cell layer of the tumor. Within each geometric cell the initial distribution of the clonogenic cells through the cell cycle phases depends on the layer of the tumor in which the geometric cell belongs. More precisely, in the proliferating cell layer 70% of the clonogenic cells are assumed to be in the cycling phases and 30% in the G0 phase. In the G0 cell layer 30% of the clonogenic cells are in the cycling phases and 70% in the G0 phase. Finally, in the dead-cell layer 10% of the clonogenic cells are in the cycling phases and 90% in the G0 phase.
5.3.6.1.Constant Radiosensitivity Throughout Cell Cycle: High Cell Loss Factor In a first experiment the response of a hypothetical, radiosensitive GBM tumor to a standard fractionation scheme (2 Gy once a day, 5 days per week,
60 Gy total) has been simulated. The LQ model parameters of this hypothetical tumor have been assumed as follows: a ¼ 0.6 Gy21, b ¼ 0.06 Gy22 [83]. They
have also been assumed to remain constant throughout cell cycle. Other parameters
of importance for this experiment were cell cycle duration TC ¼ 30 h; cell cycle phase durations TG1 ¼ 11 h, TS ¼ 13 h, TG2 ¼ 4 h, TM ¼ 2 h, and TG0 ¼ 25 h [87]; and cell loss factor taken equal to 0.9 [3]. Such a high cell loss factor has
been selected in order to facilitate the demonstration of the ability of the model to simulate the shrinkage effect. We assume that the total cell loss factor is the sum of the cell loss factor due to necrosis (0.8) and the cell loss factor due to apoptosis (0.1).
The computer code has been developed in Microsoft Visual Cþþ 6 and Microsoft Visual Basic 6. As far as the computational demands are concerned, an execution of the radiation therapy simulation of 6 weeks (96 96 96 geometric cells, each one of dimension 1 1 1 mm) on an AMD Athlon XP 1800 machine (786 MB RAM) takes about 10 min.
The testing predictions depicted in Figures 5.8 and 5.9 demonstrate the ability of the model to adequately simulate cell death and tumor shrinkage. In order to emphasize this potential of the model, in this explorative case the values of certain parameters (e.g., cell loss) have been deliberately exaggerated.
5.3.6.2.Influence of p53 Status The molecular basis of cell radiosensitivity has been extensively studied during the last decades. Representative efforts drawn from the extensive corresponding literature have been given in [86]. The roles of wild-type (wt) p53 in modulating DNA repair, apoptosis, and the G1 cell cycle arrest have each been implicated in the regulation of cellular response to ionizing radiation. A remarkable number of studies associate p53 mutations with increased radioresistance and poor clinical outcome for patients with GBM.
In this parametric study the results of Haas-Kogan et al. [64, 88] have been used. The authors in [64] investigated the influence of p53 status on radiation-induced apoptosis and G1 cell cycle arrest of GBM cells. They found that radiationinduced apoptosis of GBM cells occurred in a manner independent of wt p53, in contrast to G1 cell cycle arrest, which was p53 dependent. An increased radioresistance was observed in irradiated G1 cells lacking functional wt p53, manifested

5.3. PARADIGM OF FOUR-DIMENSIONAL SIMULATION |
145 |
FIGURE 5.8. Irradiation according to the standard fractionation scheme (2 Gy once a day, 5 days per week, 60 Gy in total). Three-dimensional sections of the tumor using the cutting plane shown in figure 7. Surface rendering produced with AVS/Express 4.2. The cutting plane shown in figure 7 has been considered. (a) Before the beginning of irradiation, (b) 2 fictitious day after the beginning of irradiation, and (c) 3 fictitious days after the beginning of irradiation. Color code ! red: proliferating cell layer, green: dormant cell layer (G0), blue: dead cell layer. The values of certain parameters (e.g., cell loss) have been deliberately exaggerated in order to facilitate the demonstration of the ability of the model to simulate the shrinkage effect.
by a relatively lower a and a/b. Furthermore, in [88] they studied the influence of p53 function on the effect of fractionated radiotherapy of GBM tumors and concluded that fractionated radiotherapy provides a selective advantage to GBM cells expressing mutant p53 (mt p53).
Based on these results, we performed a parametric study of radiation response to an accelerated fractionation scheme (2 Gy twice a day, 5 days per week, 60 Gy in
FIGURE 5.9. (a) A centrally located slice of the tumor before the beginning of irradiation, (b) simulated response of the tumor to radiation therapy 2 fictitious days after the beginning of the radiotherapy course, and (c) simulated response of the tumor to radiation therapy 3 fictitious days after the beginning of the radiotherapy course. The cutting plane shown in figure 7 has been considered. Grey scale code ! dark gray: proliferating cell layer, light gray: dormant cell layer (G0), white: dead cell layer. The values of certain parameters (e.g., cell loss) have been deliberately exaggerated in order to emphasize the ability of the model to simulate tumor shrinking as a response to radiation therapy.
146 IN SILICO RADIATION ONCOLOGY
total), assuming that the GBM tumor of Figures 5.6 and 5.7 was with (I) wt p53 and
(II)mt p53. Specifically, we assumed:
I. GBM tumor with intact wt p53 function [64]:
aP ¼ 0:61 Gy 1 |
aS ¼ 0:407 Gy 1 |
aG0 |
¼ 0:203 Gy 1 |
bP ¼ 0:02 Gy 2 |
bS ¼ 0:02 Gy 2 |
bG0 ¼ 0:02 Gy 2 |
|
II. GBM tumor with mt p53 [64]:
aP ¼ 0:17 Gy 1 |
aS ¼ 0:113 Gy 1 |
aG0 |
¼ 0:057 Gy 1 |
bP ¼ 0:02 Gy 2 |
bS ¼ 0:02 Gy 2 |
bG0 ¼ 0:02 Gy 2 |
|
The meanings of the symbols used are the following:
aP, bP |
LQ model parameters for all proliferative cell cycle phases |
|
except for DNA synthesis phase (S phase) |
aS, bS |
LQ model parameters for S phase |
aG0, bG0 |
LQ model parameters for resting G0 phase |
The mean values of aS and aG0 have been assumed as perturbations of the aP mean values, consistent with the findings of experimental radiobiology. Specifically, we assume aS ¼ 2aP=3 and aG0 ¼ aP=3. These values for aP and aG0 give an OER (oxygen enhancement ratio) equal to 3, consistent with the literature [4]. As far as the b behavior is concerned, we use bP ¼ bS ¼ bG0, based on [64].
The cell cycle duration TC is taken to be 24 h. This is the average of the cell cycle durations we have found in the literature for GBM cell lines [54, 88, 89]. In [90] the approximate percentage of the cell cycle time spent in each phase by a typical malignant cell is given as
TG1 ¼ |
40 |
TC |
TS ¼ |
39 |
TC |
TG2 ¼ |
19 |
TC |
TM ¼ |
2 |
TC |
|
|
|
|
||||||||
100 |
100 |
100 |
100 |
Based on the above distribution, for the considered cell cycle time of 24 h we get the following phase durations: TG1 ¼ 9 h, TS ¼ 8 h, TG2 ¼ 4 h, and TM ¼ 1 h. The duration of the G0 phase is taken to be TG0 ¼ 25 h [87].
We assume a clonogenic cell density of 2 105 cells/mm3 in the proliferating cell layer, 105 cells/mm3 in the G0 cell layer, and 0.2 105 cells/mm3 in the dead-cell layer of the tumor [4, p. 84; 91]. The cell loss factor (CLF) has been taken equal to 0.3 [92]. In [93] the authors note that cell loss is mainly due to necrosis (CLFN) and apoptosis (CLFA) and that gliomas have a low CLF in general. We assume that the total CLF (0.3) is the sum of the CLFN (0.27) and CLFA (0.03). We
5.3. PARADIGM OF FOUR-DIMENSIONAL SIMULATION |
147 |
hypothesize low levels of apoptotic cells for GBM, as we have found that this is in general the case for gliomas [64, 93–95].
The simulation is assumed to begin (t ¼ 0) on Monday 00:00 a.m. and, unless the tumor reaches earlier the boundaries of our cubic region of interest, to end on Sunday 24:00, 3 weeks later (t ¼ 504 h). The delivery of irradiation takes place at 08:00 and 16:00 every day and the total duration of the accelerated fractionation scheme is 3 weeks. The interfraction interval (8 h) is considered sufficient for sublethal damage repair to be completed.
A typical simulation run of 6 weeks for a 96 96 96 geometric mesh lasts about 15 min on an AMD Athlon XP 1800 machine (786 MB RAM). In order to ensure the numeric stability of the code, various executions have been performed in which different scanning directions and different initial seeds for the randomnumber generators have been used. The macroscopic features of the result of the simulation are not influenced by these variations.
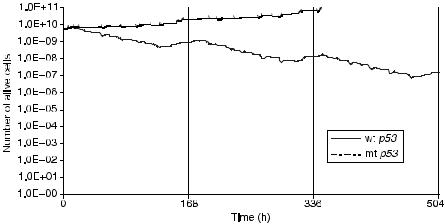
Figure 5.10 depicts the number of alive cells (proliferating and G0) as a function of time for the cases of a GBM with wt p53 and mt p53. The delivery of the last dose fraction takes place at t ¼ 448 h. At subsequent times, if the clonogenic cells in the tumor region have not been killed, they will begin to repopulate the tumor. The trend for reduction of the number of alive tumor cells during the radiotherapy scheme is clearly pronounced in the case of the tumor with a wt p53, which is considered to be more radiosensitive compared with the tumor with mt p53. In fact the tumor with mt p53 is so radioresistant that radiation therapy fails to hinder clonogenic cells from rapidly proliferating during therapy. It should be noted that regions of potential microscopic disease have not been considered, and the accuracy of the simulation model cannot reach to the point of
FIGURE 5.10. The number of alive cells (proliferating and resting) as a function of time for the tumors with wt and with mt p53.
148 IN SILICO RADIATION ONCOLOGY
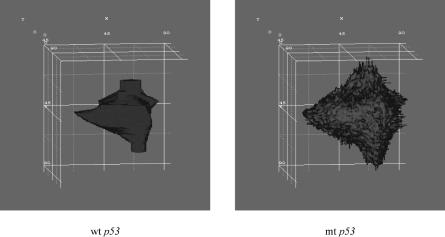
FIGURE 5.11. Three-dimensional visualization of the tumors with wt p53 and mt p53 two weeks after the beginning of the standard radiotherapy scheme (2 Gy once a day, 5 days a week, 60 Gy in total). Volume rendering produced with AVS/Express 4.2. Color code ! red: proliferating cell layer, green: dormant cell layer (G0), blue: dead cell layer.
determining the fate of every single clonogenic cell. As a consequence, the “predictions” of the simulation model should always be interpreted with caution. In Figure 5.11 the tumors are three-dimensionally visualized two weeks after the start of the radiotherapy treatment. As expected, three-dimensional visualization offers improved insight into the macroscopic geometry and structure of the tumor.
It should also be stressed that apart from the a and b parameters of the LQ model, adjusted according to the results of [64, 88], so as to incorporate the influence of p53 gene status, all other factors influencing the radiosensitivity of a tumor as a whole (e.g., hypoxic fraction, proportion of clonogenic cells, cell loss rate) have been kept unchanged during these comparative studies.
5.4. DISCUSSION
The in vivo simulation model presented in this chapter deals with a novel approach to the modeling of tumor growth and response to radiation therapy and is characterized by the unique combination of the following features:
(i)Possibility for the simulation of both untreated in vivo tumor growth and in vivo tumor response to radiotherapy
(ii)Consideration and use of the actual imaging, histopathologic, and genetic data for each particular clinical case
(iii)Incorporation of numerous biological mechanisms by means of an advanced algorithmic description
5.4. DISCUSSION |
149 |
(iv)Introduction of the notion of the “geometric cell” and its constituent compartments, called “equivalence classes,” corresponding to discrete phases within or outside the cell cycle
(v)Extensive use of random-number generators to simulate the stochastic nature of the various biological phenomena involved (Monte Carlo approach)
(vi)Discrete and modular character, which confers a high level of adaptability possibility for three-dimensional reconstruction and visualization of the results
A number of exploratory simulation tests have been performed for a clinical case of a GBM tumor. The influence of genetic determinants (such as the p53 gene status) on tumor response to radiotherapy has been incorporated into the model by means of appropriately adjusting the LQ model parameters according to the GBM tumor literature.
The results of the simulation model have been semiquantitatively assessed. Comparison of the simulation results with the accumulated clinical experience demonstrates that the model has the potential of representing the clinical reality within acceptable reliability limits. Obviously, experimental and clinical feedback is always to be exploited in order to improve the model. To this end the software system is currently undergoing an extensive testing and adaptation procedure, basically by comparing the model “predictions” with clinical data before, during, and after radiotherapy courses. Eventual discrepancies will lead to a better estimation of specific model parameters such as the LQ a and b. Generic parameter estimation techniques such as the neural networks technique, taboo searching, and so on, will be used to this end. In parallel, advances in a vast range of the involved phenomena are constantly being translated into the algorithmic language in order to keep pace with the ever-accumulating knowledge in the corresponding scientific fields. The simulation model, being gradually refined, can also be used as a tool to study the relative importance of the mechanisms underlying tumor behaviour. Possible interrelationships between the parameters involved in tumor growth or tumor response to radiotherapy are currently being explored. Optimization of dose fractionation during radiation therapy by performing in silico experiments and individualization of treatment protocols constitute the long-term goals of this effort.
The simulation model presented so far may serve as a paradigm of an in silico approach to oncology. Although it is open to refinement and better adaptation through extensive clinical testing, it provides a comprehensive outline of the basic mechanisms taken into account and algorithmically expressed. Furthermore, as chemotherapy is frequently administered before, in parallel, or after radiation therapy, an analogous model simulating the special case of the GBM to the prodrug Temodal has already been simulated by our group. Simulation of the response of normal tissues to both radiation therapy and chemotherapy is also under development. It should nevertheless be pointed out that as there is a wide range of mechanisms of action of chemotherapy depending on the agent administered, substantial differences among the corresponding models are to be expected.
150IN SILICO RADIATION ONCOLOGY
5.5.FUTURE TRENDS
Extensive combination of tumor behavior simulation models at the cellular and higher levels of biological complexity with advances in genomics and proteomics is expected to substantially strengthen the potential of the emerging discipline of in silico oncology and in particular of in silico radiation oncology. Integrated and highly automated decision support and treatment-planning systems combining microarray technology, image processing, and biosimulation software (including, e.g., radiotherapeutic and chemotherapeutic models) are becoming a necessary infrastructure for an analytical and rational approach to cancer diagnosis, prognosis, and eventual effective treatment. Therefore, special emphasis should be put on this heavily interdisciplinary combination process. Another point of outmost importance is the continuous update of the emerging integrated systems that should be based on the latest experimentally and clinically extracted knowledge as well as on the newest advances of computer science and technology.
ACKNOWLEDGMENTS
Dr. P. Asvestas, National Technical University of Athens, is duly acknowledged for his advice on specific image processing issues. The project is cofunded by the European Social Fund (75%) and National Resources (25%) under the scheme Operational Programme for Educational and Vocational Training (EPEAEK-PYTHAGORAS II).
REFERENCES
1.H. Lodish, D. Baltimore, A. Berk, S. Zipursky, P. Matsudaira, and J. Darnell, Molecular Cell Biology, Scientific American Books, New York, 1995, pp. 1247–1294.
2.J. Watson, N. Hopkins, J. Roberts, J. Steitz, and A. Weiner, Molecular Biology of the Gene, 4th ed., Benjamin/Cummings Publishing Company, Menlo Park, CA, 1987, pp. 1006–1096.
3.G. Steel (Ed.), Basic Clinical Radiobiology, Arnold, London, 1997, pp. 15, 47–48, 52–57, 123–131, 153, 161.
4.C. Perez and L. Brady, Principles and Practice of Radiation Oncology, LippincottRaven, Philadelphia, 1998, pp. 784–785.
5.J. F. Fowler, “Review of radiobiological models for improving cancer treatment,” in
K.Baier and D. Baltas (Eds.), Modelling in Clinical Radiobiology, Freiburg Oncology Series, Monograph No. 2, Albert-Ludwigs University, Freiburg, Germany, 1997, pp. 1–14.
6.M. Santini, G. Rainaldi and P. Indovina, “Multicellular tumor spheroids in radiation biology,” Int. J. Radiat. Biol, 75(7): 787–799, 1999.
7.R. Jostes, M. Williams, M. Barcellos-Hoff, T. Hoshino, and D. Deen, “Growth delay in 9L rat brain tumor spheroids after irradiation with single and split doses of X rays,” Radiat. Res., 102(2): 182–189, 1985.
8.J. Casciari, S. Sotirchos, and R. Sutherland, “Variations in tumor cell growth rates and metabolism with oxygen concentration, glucose concentration, and extracellular pH,”
J.Cell. Physiol., 151: 386–394, 1992.
REFERENCES 151
9.M. Santini and G. Rainaldi, “Three-dimensional spheroid model in tumor biology,” Pathobiology, 67: 148–157, 1999.
10.C. Nirmala, J. S. Rao, A. C. Ruifrock, L. A. Langford, and M. Obeyesekere, “Growth characteristics of glioblastoma spheroids,” Int. J. Oncol., 19: 1109–1115, 2001.
11.J. P. Freyer and R. M. Sutherland, “Regulation of growth and development of necrosis in EMT6/Ro multicellular spheroids by the glucose and oxygen supply,” Cancer Res., 46: 3504–3512, 1986.
12.J. A. Adam and S. A. Maggelakis, “Diffusion regulated growth characteristics of a spherical prevascular carcinoma,” Bull. Math. Biol., 52: 549–582, 1990.
13.J. J. Casciari, S. V. Sotirchos, and R. M. Sutherland, “Glucose diffusivity in multicellular tumor spheroids,” Cancer Res., 48: 3905–3909, 1988.
14.W. Duechting, “Krebs, ein instabiler Regelkreis.Versuch einer Systemanalyse,” Kybernetik, 5(2): 70–77, 1968.
15.R. A. Gatenby, “Models of tumor-host interaction as competing populations: Implications for tumor biology and treatment,” J. Theor. Biol., 176: 447–455, 1995.
16.R. Uddin and I. M. Saeed, “Structure and growth of tumors: The effect of Cartesian, cylindrical, and spherical geometries,” Ann. Acad. Sci., 858: 127–136, 1998.
17.H. P. Greenspan, “On the growth and stability of cell cultures and solid tumors,” J. Theor. Biol., 56: 229–242, 1976.
18.H. Bremermann, “Reliability of proliferation controls. The Hayflick limit and its breakdown in cancer,” J. Theor. Biol., 97: 641–662, 1982.
19.R. Demicheli, R. Foroni, A. Ingrosso, G. Pratesi, C. Sorano, and M. Tortoreto, “An exponential-Gompertzian description of LoVo cell tumor growth from in vivo and in vitro data,” Cancer Res., 49: 6543–6546, 1989.
20.J. J. Terz, W. Lawrence, Jr., and B. Cox, “Analysis of the cycling and noncycling cell population of human solid tumors,” Cancer, 40: 1462–1470, 1977.
21.G. Hejblum, D. Costagliola, A.-J. Valleron, and J.-Y. Mary, “Cell cycle models and mother-daughter correlation,” J. Theor. Biol., 131: 255–262, 1988.
22.K. A. Heichman and J. M. Roberts, “Rules to replicate by,” Cell, 79: 557–562, 1994.
23.D. Wiarda and C. C. Travis, “Determinability of model parameters in a two-stage deterministic cancer model,” Math. Biosci., 146: 1–13, 1997.
24.R. A. Gatenby and E. T. Gawlinski, “A reaction-diffusion model of cancer invasion,” Cancer Res., 56: 5745–5753, 1996.
25.K. Iwata, K. Kawasaki, and N. Shigesada, “A dynamical model for the growth and size distribution of multiple metastatic tumors,” J. Theor. Biol., 201: 177–186, 2000.
26.A. D. Murray, “Creative blocks: Cell-cycle checkpoints and feedback controls,” Nature, 359: 599–604, 1992.
27.I. I. H. Chen and R. L. Prewitt, “A mathematical representation for vessel network,” J. Theor. Biol., 97: 211–219, 1982.
28.D. Balding and D. L. S. Mc Elwain, “A mathematical model of tumor-induced capillary growth,” J. Theor. Biol., 114: 53–73, 1985.
29.S. Michelson and J. T. Leith, “Possible feedback and angiogenesis in tumor growth control,” Bull. Math. Biol., 59: 233–254, 1997.
30.W. Duechting and T. Vogelsaenger, “Three-dimensional pattern generation applied to spheroidal tumor growth in a nutrient medium,” Int. J. Biomed. Comput., 12(5): 377–392, 1981.
152 IN SILICO RADIATION ONCOLOGY
31.W. Duechting, “Tumor growth simulation,” Comput. Graphics, 14: 505–508, 1990.
32.G. Stamatakos, N. Uzunoglu, K. Delibasis, M. Makropoulou, N. Mouravliansky, and
A.Marsh, “A simplified simulation model and virtual reality visualization of tumor growth in vitro,” Future Generation Computer Systems, 14: 79–89, 1998.
33.G. S. Stamatakos, N. K. Uzunoglu, K. Delibasis, M. Makropoulou, N. Mouravliansky, and A. Marsh, “Coupling parallel computing and the WWW to visualize a simplified simulation of tumor growth in vitro,” in H. R. Arabnia (Ed.), Proceedings of the International Conference on Parallel and Distributed Processing Techniques and Applications, PDTA’98, CSREA Press, Las Vegas, Nevada, 1998, pp. 526–533.
34.G. Stamatakos, N. Uzunoglu, K. Delibasis, N. Mouravliansky, M. Makropoulou, and
A.Marsh, “Using VRML in a client-server architecture to visualize a simplified simulation model of tumor growth in vitro,” in Proceedings of the Twentieth Annual International Conference-IEEE/EMBS, Hong Kong, 1998, pp. 2834–2837.
35.G. Stamatakos, E. Zacharaki, N. Mouravliansky, K. Delibasis, K. Nikita, N. Uzunoglu, and A. Marsh, “Using Web technologies and meta-computing to visualize a simplified simulation model of tumor growth in vitro,” in P. Sloot, M. Bubak, A. Hoekstra, and
B.Hertzberger (Eds.), High-Performance Computing and Networking, Lecture Notes in Computer Science, Vol. 1593, Springer, Berlin, 1999, pp. 973–982.
36.G. Stamatakos, E. Zacharaki, M. Makropoulou, N. Mouravliansky, K. Nikita, and
N.Uzunoglu, “Tumour growth in vitro and tumor response to irradiation schemes: A simulation model and virtual reality visualization,” Radiother. Oncol., 56(1, Suppl.): 179–180, 2000.
37.G. S. Stamatakos, N. K. Uzunoglu, K. Delibasis, N. Mouravliansky, A. Marsh, and
M.Makropoulou, “Tumor growth simulation and visualization: A review and a Web based paradigm,” Stud. Health Technol. Informatics, 79: 255–274, 2000.
38.T. S. Deisboek, M. E. Berens, A. R. Kansal, S. Torquato, A. O. Stemmer-Rachmamimov, and E. A. Chiocca, “Pattern of self-organization in tumor systems: Complex growth dynamics in a novel brain tumor spheroid model,” Cell Prolif., 34: 115–134, 2001.
39.R. Wasserman and R. Acharya, “A patient-specific in vivo tumor model,” Math. Biosci.,
136:111–140, 1996.
40.A. R. Kansal, S. Torquato, G. R. Harsh, E. A. Chiocca, and T. S. Deisboeck, “Simulated brain tumor growth dynamics using a three-dimensional cellular automaton,” J. Theor. Biol., 203: 367–382, 2000.
41.A. R. Kansal, S. Torquato, G. R. Harsh IV, E. A. Chiocca, and T. S. Deisboeck, “Cellular automaton of idealized brain tumor growth dynamics,” BioSystems, 55: 119– 127, 2000.
42. G. Stamatakos, D. Dionysiou, N. Mouravliansky, K. Nikita, G. Pissakas, P. Georgolopoulou, and N. Uuznoglu, “Algorithmic description of the biological activity of a solid tumour in vivo,” in Proceedings of the EUROSIM 2001 Congress, Delft, The Netherlands, June 26–29, 2001 (CD-ROM Edition).
43.L. Cohen, Biophysical Models in Radiation Oncology, CRC Press, Boca Raton, FL, 1983.
44.W. Sinclair and R. Morton, “X-ray and ultraviolet sensitivity of synchronized Chinese hamster cells at various stages of the cell cycle,” Biophys. J., 5: 1–25, 1965.
45.C. J. Gillespie, J. D. Chapman, A. P. Reuvers, and D. L. Dugle, “The inactivation of Chinese hamster cells by X rays: Synchronized and exponential cell populations,” Radiat. Res., 64: 353–364, 1975.
REFERENCES 153
46.H. D. Thames, Jr., H. R. Withers, L. J. Peters, and G. H. Fletcher, “Changes in early and late radiation responses with altered dose fractionation: Implications for dose–survival relationships,” Int. J. Radiat. Oncol. Biol. Phys., 8: 219–226, 1982.
47.R. G. Dale, “The application of the linear-quadratic dose-effect equation to fractionated and protracted radiotherapy,” Br. J. Radiol., 58: 515–528, 1985.
48.H. D. Thames, “An ‘incomplete-repair’ model for survival after fractionated and continuous irradiations,” Int. J. Radiat. Biol., 47: 319–339, 1985.
49.H. D. Thames, M. E. Rozell, S. L. Tucker, K. K. Ang, D. R. Fisher, and E. L. Travis, “Direct analysis of quantal radiation response data,” Int. J. Radiat. Oncol. Biol. Phys.,
49:999–1009, 1986.
50.J. Denekamp, “Cell kinetics and radiation biology,” Int. J. Radiat. Biol., 49: 357–380, 1986.
51.R. Dale, “The application of the linear-quadratic model to fractionated radiotherapy when there is incomplete normal tissue recovery between fractions, and possible implications for treatments involving multiple fractions per day,” Br. J. Radiol., 59: 919–927, 1986.
52.E. L. Travis and S. L. Tucker, “Isoeffect models and fractionated radiation therapy,” Int. J. Radiat. Oncol. Biol. Phys., 13: 283–287, 1987.
53.J. F. Fowler, “The linear-quadratic formula and progress in fractionated radiotherapy,” Br. J. Radiol., 62: 679–694, 1989.
54.L. E. Dillehay, “A model of cell killing by low-dose-rate radiation including repair of sublethal damage, G2 block, and cell division,” Radiat. Res., 124: 201–207, 1990.
55.S. L. Tucker, H. D. Thames, and J. M. G. Taylor “How well is the probability of tumor cure after fractionated irradiation described by Poisson statistics?” Radiat. Res., 124: 273–282, 1990.
56.D. J. Brenner, “Track structure, lesion development and cell survival,” Radiat. Res., 124: S29–S37, 1990.
57.H. D. Thames, S. M. Bentzen, I. Turesson, M. Overgaard, and W. Van de Bogaert, “Time-dose factors in radiotherapy: A review of the human data,” Radiother. Oncol.,
19:219–235, 1990.
58.J. Chen, J. Van de Geijn, and T. Goffman, “Extra lethal damage due to residual incompletely repaired sublethal damage in hyperfractionated and continuous radiation treatments,” Med. Phys., 18: 488–496, 1991.
59.H. D. Thames, T. E. Schultheiss, J. H. Hendry, S. L. Tucker, B. M. Dubray, and W. A. Brock, “Can modest escalations of dose be detected as increased tumor control?” Int. J. Radiat. Oncol. Biol. Phys., 22: 241–246, 1992.
60.M. Zaider and G. N. Minerbo, “A mathematical model for cell cycle progression under continuous low-dose-rate irradiation,” Radiat. Res., 133: 20–26, 1993.
61.H. R. Withers, “Biologic basis of radiation therapy,” in C. A. Perez and L. W. Brady (Eds.), Principles and Practice of Radiation Oncology, 2nd ed., J. P. Lippincott, New York, 1992, pp. 64–96.
62.B. Jones and R. Dale, “Mathematical models of tumor and normal tissue response,” Acta Oncol., 38: 883–893, 1999.
63.T. E. Wheldon, A. S. Michalowski, and J. Kirk, “The effect of irradiation on function in self-renewing normal tissues with differing proliferative organisation,” Br. J. Radiol., 55: 759–766, 1982.