

Genomics and Proteomics Engineering in Medicine and Biology - Metin Akay
.pdf124 ROBUST METHODS FOR MICROARRAY ANALYSIS
FIGURE 4.12. (a) General collocation of genes identified by different algorithms (shown with different colors). This collocations suggests that the different methods are in reasonable agreement. (b) Genes selected by each method are widely separated and show no coherence, suggesting that there is a lack of consensus among the methods.
dimensionality reduction that involves projections of the original data onto the principal components. These components are ordered according to the amount of data captured by each component. The first component is the most informative, the second is the next most informative, and so on. Further information on PCA can be found in [45, 46]. An example of PCA applied to microarray data can be found in [8].
In our PCA-based visualization of multiple gene lists, each gene is considered to be a point in patient space, where each dimension corresponds to a different patient. Since, in this case, there were 12,000 genes and 126 patients, the spatial representation had 12,000 points (samples) in a 126-dimensional space. Of the 12,000 genes we only considered about 600 that occurred in the different gene lists, reducing our problem to 600 genes in 126 dimensions. Furthermore, because we were mainly interested in how the genes compared as discriminators, and not how their actual expression levels compared, we projected the genes onto the 126-dimensional unit sphere in patient space, as suggested in Figure 4.13a. Geometrically, this corresponds to comparing the directions of the genes in the various gene lists as opposed to their magnitudes.
In order to understand this visualization, is it useful to imagine a sphere with a plane passing through the origin. The sphere corresponds to the unit sphere (the sphere with radius 1 centered at the origin) in the patient space and the plane corresponds to the plane determined by the first two principal components. The first principal component points in the radial direction of the sphere and the second principal component is tangential to the sphere at the sphere’s intersection with the first principal component. The vector representing a particular gene and it will intersect the unit sphere, and it will be near the equator of the sphere (unit circle) if it lies in the plane of the first two principal components. To the extent that the gene lies above or below the plane of the first two principal components, the projection of the intersection back down onto the plane will lie further inside the equator. The distribution of these projections onto the principal-component plane suggests how a given method of gene selection identifies important genes.
4.4. SUPERVISED METHODS |
125 |
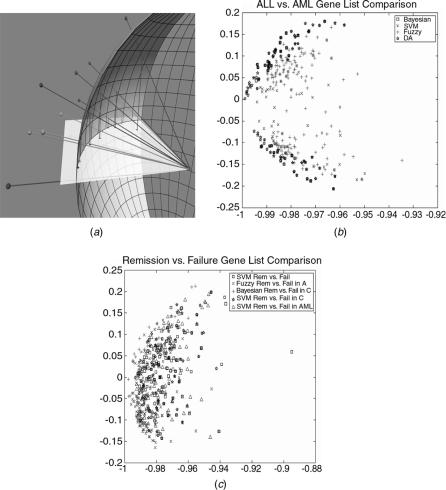
FIGURE 4.13. (a) A few genes from three different methods are shown intersecting the unit sphere, along with the projections of those intersections down onto the plane of the first two principal components. Note that genes near that plane will have projections that fall close to the arc of the sphere, while those above or below the plane will have intersections that fall well within the equator of the sphere. (b) The ALL-vs-AML gene list comparison. The gene lists that characterize ALL vs. AML are shown, with a different color for each of the methods used to obtain them. In distinguishing ALL from AML we found that most of the genes in the list were colocalized in our representative visualization. (c) Gene lists that characterize remission vs. failure are shown, with a different color for each of the methods used to obtain them. It can be seen in this figure that distinguishing remission from failure is a difficult task.

126 ROBUST METHODS FOR MICROARRAY ANALYSIS
For instance, discriminant analysis and the ANOVA methods are much more similar to each other than to the Bayesian network approach. If we use PCA (see [46] for an introduction to PCA), we see further that many methods will be heavily influenced by differences in the first few principal components of the gene expression data. On the other hand, methods such as SVM RFE [41] are able to examine the simultaneous efficacy of groups of genes, some of which, individually, may not be discriminatory in the first or second principal component. One way to understand these differences is by considering where selected genes project onto the plane of the first two principal components: see Figure 4.13a, which schematically represents a few genes from three methods, identified by different colors.
It is evident from Figure 4.13b that the gene lists selected for the ALL/AML problem are related. Unfortunately, it is equally obvious that the gene lists selected for the remission/failure problem are unrelated, as shown using the same analysis in Figure 4.13c.
When distinguishing ALL from AML, we found that most of the lists were colocalized in our representative visualization (see Figs. 4.12a and 4.13b). When distinguishing remission from failure, on the other hand, we could not arrive at a satisfactory conclusion (see, Figs. 4.12b and 4.13c), which is also consistent with the results from ANOVA plus bootstrapping (data not shown).
4.4.2. Unifying Gene Lists
Although it is useful to compare gene lists, the task of sifting through five or six such lists can be very time consuming for the biologist. For this reason, we also developed a quick-and-easy way to combine multiple lists into a single master list.
In order to collate and compare the different gene lists we used a weighted voting scheme. In this scheme, we consider genes to be candidates and gene lists to be votes. In other words, each method suggests, in order of preference, which genes should be elected. Our method for combining the gene lists ranks the candidate genes according to the geometric mean of the voting order in each list, where
TABLE 4.2 A Simple Combination of Many Gene Lists
Rank |
Geo Mean |
SVM |
Stepwise |
ROC |
ANOVA |
TNoM |
|
|
|
|
|
|
|
1 |
1 |
1 |
1 |
1 |
1 |
1 |
2 |
6.17 |
4 |
2 |
6 |
6 |
|
3 |
6.49 |
3 |
|
2 |
2 |
|
4 |
8.57 |
2 |
|
8 |
3 |
|
5 |
10.14 |
5 |
|
3 |
10 |
23 |
6 |
10.24 |
6 |
|
5 |
11 |
11 |
7 |
10.9 |
10 |
|
4 |
4 |
|
8 |
13.34 |
8 |
|
11 |
5 |
|
9 |
13.66 |
11 |
3 |
15 |
|
|
10 |
13.91 |
12 |
4 |
14 |
25 |
|
|
|
|
|
|
|
|
Note: The overall rank was obtained by using the geometric mean of the ranks provided in columns 3–7. An empty cell in the array indicates a value of 31.
ACKNOWLEDGMENTS 127
each method is allowed only 30 votes (the length of our shortest list) and all other genes are given a vote of 31. An example is shown in Table 4.2.
4.5. CONCLUSION
At this point in the analysis it may seem that the biology has dissolved into a sea of numbers and statistical methods. However, these methods are our only guideposts when we begin reading the known information about the indicated genes. Without them we could easily waste very valuable time and people in the study of genes which are only weakly, if at all, related to the central questions of the research. Guided by these methods, we can approach the literature with greater confidence and are much more likely to see the important biology reemerge in the gene annotations and the cited literature.
However, even after these statistical filters, this literature is vast and is not organized to make our searching particularly easy. We have come to recognize that this step (where very knowledgeable scientists must read extensively) is the critical, rate-limiting step for our research. As a result, we (and many others) have begun work with the natural language processing (NLP) community to build tools that find, summarize, and reorder important parts of the available online literature to make that reading process simpler and more focused toward our research needs. Although we do not discuss such work here, a demonstration of a preliminary automatic Gene List Exploration Environment (GLEE) can be found at http://aiaia.nmsu.edu/. See also [34]
Regardless, gene expression studies are providing new insights into molecular mechanism and hold the promise of deeper biological understanding. However, the speed at which groups of genes generated by microarray analysis can be put together in pathways is one of the limiting steps in the translation of these discoveries to applications. Mistakes and dead ends due to faulty microarray analysis tools are a particularly frustrating way to slow this analysis.
The methods presented here are potentially useful in uncovering groups of genes that serve to fingerprint biologically important subtypes; further aiding biological discoveries; and refining diagnosis and improving assessment of prognosis. To provide greater confidence in our tools, we have also benchmarked our methods extensively for reliability. In fact, we believe that both of these factors (usefulness and reliability) are equally important, particularly for the analysis of microarray data.
ACKNOWLEDGMENTS
The authors of this chapter gratefully acknowledge the immense contributions of our collaborators, without which this work could not have been accomplished. Here we reported on the methods and techniques developed at Sandia National Laboratories. However, much of the work discussed sprang from our collaborators; we thank them for their generous time and patience in teaching us enough biology to be helpful and for including us in their laboratories. While developing these methods we have worked directly with and have had fruitful discussions with dozens of researchers from these laboratories and have benefited
128 ROBUST METHODS FOR MICROARRAY ANALYSIS
by many generous introductions to other researchers. We owe each of these people our thanks for their critiques of our work and encouragements to continue. Our collaborations with the University of New Mexico have been very fruitful. The informatics work reported here stems directly from close interactions with Vickie Peck, who opened the world of genomics to us. Certainly, without the continuing encouragements and contributions of Maggie Werner-Washburne we would not have created useful tools or have been able to explain them to life scientists. One of the most important of these was Stuart Kim from Stanford University, who was able to see through the primitive nature of our early efforts and recognize what they could become. Our collaboration with Stuart stretched and improved all of our tools and led to an important, joint publication that continues to have impact. The microarray work with Cheryl Willman’s laboratory at the University of New Mexico Cancer Center drove the development of many of the statistical techniques presented here. Cheryl included us in her weekly laboratory meetings, which must surely have been made more tedious by our presence and the continuing need to teach us the rudiments of leukemia biology. Each of these groups is large and we have learned something from every one of you, for which we say thank you. We would especially like to acknowledge the help and collaborations of Moni Kiraly, Jim Lund, Kyle Duke, Min Jiang, Joshua M. Stuart, and Andreas Eizinger from the Kim Laboratory and, of course, Edwina Fuge, Jose Weber, Juanita Martinez, Anthony Aragon, and Angela Rodriguez from the Werner-Washburne Laboratory. From the Willman Laboratory, we must certainly acknowledge Susan Atlas, Paul Helman, Robert Veroff, Erik Andries, Kerem Ar, Yuexian Xu, Huining Kang, Xuefei Wang, Fred Schultz, Maurice Murphy, and particularly Mo´nica Mosquera-Caro and Jeffrey Potter, who have been immensely helpful to our research. We would particularly like to thank Jon C. Helton for suggesting the use of Savage scoring as a means to normalize microarray data. If we have unfortunately omitted someone to whom we owe our thanks and gratitude, please accept our apologies and recognize that we do value your help. As always, any misrepresentation or error with respect to our collaborators’ work is purely our own fault. Finally, we would like to thank the W. M. Keck foundation for funding the W. M. Keck Genomics Center at the University of New Mexico, which was particularly important in our work. This work was supported by grants from the National Science Foundation, (NSF) (MCB-0092374) to M.W.W., an NSF Minority Post-doctoral fellowship to M.J.M, and U.S. Department of Agriculture (99-38422-8034) to A. D. A. Development of the algorithms described here was funded in part by the W. M. Keck foundation and a Laboratory Directed Research and Development program from Sandia National Laboratories. In addition, a portion of this work was funded by the U.S. Department of Energy’s Genomics: GTL program (www.doegenomestolife.org) under project “Carbon Sequestration in Synechococcus Sp.: From Molecular Machines to Hierarchical Modeling” (www.genomes-to-life.org). Sandia is a multiprogram laboratory operated by Sandia Corporation, a Lockheed Martin Company, for the U.S. Department of Energy under Contract DE-AC04-94AL85000.
REFERENCES
1.G. S. Davidson et al., “Knowledge mining with VxInsight: Discovery through interaction,” J. Intell. Inform. Sys., 11(3): 259–285, 1998.
2.M. Schena et al., “Quantitative monitoring of gene expression patterns with a complementary DNA microarray,” Science, 270(5235): 467–470, 1995.
3.J. L. DeRisi, V. R. Iyer, and P. O. Brown, “Exploring the metabolic and genetic conrol of gene expression on a genomic scale,” Science, 278(25): 14863–14868, 1997.
REFERENCES 129
4.P. O. Brown and D. Botstein, “Exploring the new world of the genome with DNA microarrays,” Nature Genet., 21: 33–37, 1999.
5.M. Eisen et al., “Cluster analysis and display of genome-wide expression patterns,” Proc. Natl. Acad. Sci., 95(25): 14863–14868, 1998.
6.P. Spellman et al., “Comprehensive identification of cell cycle-regulated genes of the yeast Saccharomyces cerevisiae by microarray hybridization,” Mol. Biol. Cell, 9(12): 3273–3297, 1998.
7.T. Golub et al., “Molecular classification of cancer: Class discovery and class prediction by gene expression monitoring,” Science, 286(5439): 531–537, 1999.
8.O. Alter, P. O. Brown, and D. Botstein, “Singular value decompositon for genome-wide expression data processing and modeling,” Proc. Natl. Acad. Sci., 97(18): 10101–10106, 2000.
9.H. C. Causton, J. Quackenbush, and A. Brazma, Microarray Gene Expression Data Analysis: A Beginner’s Guide, Blackwell Publishers, Malden, MA, 2003.
10.S. Draghici, Data Analysis Tools for DNA Microarrays, Chapman & Hall, Boca Raton, FL, 2003.
11.M.-L. T. Lee, Analysis of Microarray Gene Expression Data., Kluwer Academic, Boston, MA, 2004.
12.M. Schena, Microarray Analysis, Wiley, New York, 2002.
13.G. E. P. Box, J. S. Hunter, and W. G. Hunter, Statistics for Experimenters, Design, Innovation, and Discovery, Wiley, Hoboken, NJ, 2005.
14.J. F. Zolman, Biostatistics, Oxford University Press, New York, 1993.
15.J. R. Thompson, Simulation: A Modeler’s approach, Wiley, New York, 2000.
16.J. W. Tukey and F. Mosteller, Data analysis and regression, in F. Mosteller (Ed.),
Addison-Wesley Series in Behavioral Science: Quantitative Methods, Addison-Wesley, Reading, MA, 1977.
17.I. R. Savage, “Contributions to the theory of rank order statistics—the two-sample case,” Ann. Math. Stat., 27: 590–615, 1956.
18.M. Bilban et al., “Normalizing DNA microarray data,” Curr. Issues Mol. Biol., 4(2): 57–64, 2002.
19.J. Quackenbush, “Microarray data normalization and transformation,” Nature Genet, 32: 496–501, 2002.
20.G. Davidson, B. Wylie, and K. Boyack. “Cluster stability and the use of noise in interpretation of clustering”, in 7th IEEE Symposium on Information Visualization (InfoVis 2001), San Diego, CA, 2001.
21.P. Tamayo et al., “Interpreting patterns of gene expression with self-organizing maps: Methods and application to hematopoietic differentiation,” Proc. Natl. Acad. Sci., IEEE Computer Society, Washington, D.C., 96(6): 2907–2912, 1999.
22.A. J. Enright and C. A. Ouzounis, “BioLayout—an automatic graph layout algorithm for similarity visualization,” Bioinformatics, 17(9): 853–854, 2001.
23.R. Shamir and R. Sharan. “CLICK: A clustering algorithm with applications to gene expression analysis,” in Proc. Int. Conf. Intell. Syst. Mol. Biol. (ISMB), 8:307–316, AAAI Press, Menlo Park, CA, 2000.
24.Y. Xu, V. Olman, and D. Xu, “Clustering gene expression data using a graph-theoretic approach: an application of minimum spanning trees,” Bioinformatics, 18(2): 536–545, 2002.
130 ROBUST METHODS FOR MICROARRAY ANALYSIS
25.A. K. Jain, M. N. Murty, and P. J. Flynn, “Data clustering: A review,” ACM Comput. Surv., 31(3): 264–323, 1999.
26.R. R. Wilcox, Fundamentals of Modern Statistical Methods: Substantially Improving Power and Accuracy, Springer-Verlag, New York, 2001, p. 110.
27.R. R. Wilcox, “Introduction to robust estimation and hypothesis testing”, in G. J. L. a.I. Olkin (Ed.), Statistical Modeling and Decision Science, Academic, San Diego, CA, 1977, p. 188.
28.Online Mendelian Inheritance in Man (OMIM), McKusick-Nathans Institue for Genetic Medicine, John Hopkins University (Baltimore, MD), National Center for Biotechnology Information, and National Library of Medicine (Bethesda, MD), 2000.
29.S. Kim et al., “A gene expression map for Caenorhabditis elegans,” Science, 293(5537): 2087–2092, 2001.
30.T. Fruchtermann and E. Rheingold, Graph Drawing by Force-Directed Placement, University of Illinois, Urbana-Champagne, IL, 1990.
31.S. Kirkpatrick, C. D. Gelatt, and M. P. Vecchi, “Optimization by simulated annealing,” Science, 220(4598): 671–680, 1983.
32.M. Werner-Washburne et al., “Comparative analysis of multiple genome-scale data sets,” Genome Res., 12(10): 1564–1573, 2002.
33.J. M. Stuart et al., “A gene co-expression network for global discovery of conserved genetic modules,” Science, 302: 249–255, 2003.
34.G. S. Davidson et al., High Throughput Instruments, Methods, and Informatics for Systems Biology, Sandia National Laboratories, Albuquerque, NM, 2003.
35.Y. Koren, L. Carmel, and D. Harel, “Drawing huge graphs by algebraic multigrid optimization,” Multiscale Modeling and Simulation, 1(4): 645–673, 2003.
36.C. Walshaw, “A multilevel algorithm for force-directed graph drawing”, in Proceedings of the Eighth International Symposium on Graph Drawing (GD), Springer-Verlag, London, UK, 2000.
37.B. Hendrickson and R. Leland, “A Multi-Level Algorithm for Partitioning graphs”, in Supercomputing, ACM Press, New York, 1995.
38.S. Roweis and L. Saul, “Nonlinear dimensionality reduction by locally linear embedding,” Science, 290(5500): 2323–2326, 2000.
39.J. B. Tenenbaum, V. D. Silva, and C. Langford, “A global geometric framework for nonlinear dimensionality reduction,” Science, 290(5500): 2319–2323, 2000.
40.A. Ben-Hur, A. Elisseeff, and I. Guyon. “A stability based method for discovering structure in clustered data,” in R. Attman, A. K. Dunker, L. Hunter, T. E. Klein (Eds.), Pacific Symposium on Biocomputing, World Scientific Hackensack, NJ, 2002.
41.I. Guyon et al., “Gene selection for cancer classification using support vector machines,” Machine Learning, 46: 389–422, 2002.
42.J. Jaeger, R. Sengupta, and W. L. Ruzzo. “Improved gene selection for classification of microarrays,” in R. Attman, A. K. Dunker, L. Hunter, T. E. Klein (Eds.), Pacific Symposium on Biocomputing, World Scientific Hackensack, NJ, 2003.
43.B. Efron, “Bootstrap methods: Another look at the jackknife,” Ann. Stat., 7(37): 1–26, 1979.
44.P. Helman, R. Veroff, S. R. Atlas, C. Willman, “A Bayesian network classification methodology for gene expression data,” J. Comput. Biol., 11(4): 581–615, 2004.
45.I. T. Jolliffe, Principal Component Analysis, Springer-Verlag, New York, 2002.
46.M. Kirby, Geometric Data Analysis, Wiley, New York, 2001.

&CHAPTER 5
In Silico Radiation Oncology: A Platform for Understanding Cancer Behavior and Optimizing Radiation Therapy Treatment
G. STAMATAKOS, D. DIONYSIOU, and N. UZUNOGLU
5.1. PHILOSOPHIAE TUMORALIS PRINCIPIA ALGORITHMICA: ALGORITHMIC PRINCIPLES OF SIMULATING CANCER
ON COMPUTER
Completion of the sequencing of the human genome and cataloging and analysis of every protein in the human body (proteomics) that are currently underway have shaped a completely new and promising environment in the vast area of biomedical sciences and technology. Detailed analytical understanding of a plethora of molecular mechanisms has already been successfully exploited for diagnostic and therapeutic purposes (e.g., computer drug design, gene therapy). Nevertheless, in many critical cases such as in the case of cancer, understanding disease at the molecular level, although imperative, is not generally a sufficient condition for a successful treatment. Cancer [1, pp. 1247–1294; 2, pp. 1006–1096; 3–5] is the second most frequent cause of death in the developed countries. The astonishing complexity and degree of interdependence among the elementary biological mechanisms involved in tumor growth and response to therapeutic modalities as well as the partly stochastic character of cancer behavior dictate an extension of the analytical understanding of the disease to higher levels of biological complexity. Subcellular, cellular, tissue, organ, system, organism, and population levels should also be addressed with rigor analogous to the one characterizing the molecular approach. This is by no means an easy task. The challenge to mathematically describe cancer either analytically or algorithmically might well be paralleled to the challenge of mathematically describing planetary motion as was posed millenia ago.
Genomics and Proteomics Engineering in Medicine and Biology. Edited by Metin Akay Copyright # 2007 the Institute of Electrical and Electronics Engineers, Inc.
131
132 IN SILICO RADIATION ONCOLOGY
Nevertheless, cancer is a natural phenomenon too and as such it must be amenable to some sort of mathematical description. Even though analytical mathematics can be used to construct models of simple, mainly experimental tumor geometries such as tumor spheroids or nonsolid tumors, it does not seem particularly adequate for the description of realistic tumors in vivo with complex geometries, complex metabolic activity, and complex spatial proliferation distribution. On the contrary, discrete-state algorithmic descriptions of the system under consideration has been shown to be a quite efficient approach. Therefore, some sort of philosophiae tumoralis principia algorithmica (algorithmic principles of oncological philosophy) is to be expected to emerge in the near future. Evidently, experimental and clinical validation of such hypothetical principles in conjunction with the determination of their predictability limits would play a central role is such an approach.
Especially concerning radiation therapy, current treatment-planning algorithms are based on the concept of physical optimization of the dose distribution and rely on rather crude biological models of tumor and normal tissue response. Such algorithms practically ignore the highly complicated dynamic behavior of malignant cells and tissues. The introduction of advanced biosimulation methods based on cell proliferation mechanisms and also on information drawn from the cellular and molecular properties of each individual malignancy and each individual patient is expected to substantially improve the radiation therapy efficiency. This would be accomplished by using alternative fractionations, spatial dose distributions, and even combination with other therapeutic modalities such as chemotherapy, hyperthermia, and so on. Therefore, efficient modeling, simulation, and visualization of the biological phenomena taking place before, during, and after irradiation are of paramount importance. Discrete-time algorithmic descriptions (simulations) of the various phenomena offer the possibility of taking into account a large number of involved mechanisms and interactions. The same philosophy has already been extensively applied to purely technological problems, and the emerged numerical methods [e.g., the finite-difference time-domain (FDTD) technique] have proved to be very efficient and reliable. A further prominent characteristic of the biological phenomena under consideration is stochasticity. The fate of a single irradiated cell cannot be accurately predicted, for example. Only survival probabilities can be assigned to the cell based on the accumulated experimental and clinical observations made on large cell populations. Furthermore, the exact spatiotemporal distribution of the various cell cycle phases within the tumor volume is generally unknown, although some plausible macroscopic hypotheses can be made. Therefore, stochastic techniques such as the generic Monte Carlo method seem to be particularly appropriate for the prediction of tumor growth and response to radiation therapy.
The practical usefulness of such methods is both to improve understanding of the cancer behavior and to optimize the spatiotemporal treatment plan by performing in silico (on the computer) experiments before the actual delivery of radiation to the patient. In other words the clinician would be able to perform computer simulations of the likely tumor and adjacent normal tissue response to different irradiation scenarios based on the patient’s individual imaging, histologic, and
5.2. BRIEF LITERATURE REVIEW |
133 |
genetic data. The simulation predictions would support him or her in selecting the most appropriate fighting strategy. To this end a substantial number of experimental and mathematical models have been developed. On the contrary, a rather small number of actual three-dimensional computer simulation models have appeared in the literature. Exploitation of the potential of current visualization techniques is even more limited.
This chapter begins with a brief literature review concerning experimental, mathematical, and computer simulation models of tumor growth, angiogenesis, and tumor and normal tissue response to radiation therapy. Reference to papers describing visualization algorithms used in oncologic simulations is also made. In a novel Monte Carlo simulation model developed by the In Silico Oncology Group of the National Technical University of Athens and including algorithms of in vivo tumor growth and response to irradiation, a specific application of the model to glioblastoma multiforme case and three-dimensional visualization of the predicted outcome is outlined. The chapter concludes with a critical evaluation of the presented paradigm, suggestions for further research, and a brief exposition of the future trends in in silico oncology.
5.2. BRIEF LITERATURE REVIEW
In the past four decades intensive efforts have been made in order to model tumor growth and tumor and normal tissue response to various therapeutic schemes such as radiation therapy. As the corresponding literature is particularly extended, only indicative examples of the modeling efforts are given in the following paragraphs.
Experimental models of tumor growth include twoand three-dimensional cell cultures (in vitro experimentation) and induction of tumors in laboratory animals (in vivo experimentation) [6–11]. Mathematical models of tumor growth attempt to analytically describe various aspects of the highly complex process, such as diffusion of oxygen and glucose [12, 13], control stability [14], competition between tumor and host [15], interdependence between structure and growth [16] and growth and stability [17, 18], temporal profile of tumor cell proliferation [19–21], tumor cell replication rules [22, 23], invasion [24], metastasis [25], cell cycle checkpoints [26], and angiogenesis [27–29]. The following approaches constitute representative examples of the modeling efforts. Adam and Maggelakis [12] analytically modeled the overall growth of a tumor spheroid using information about inhibitor production rates, oxygen consumption rates, volume loss and cell proliferation rates, and measures of the degree of nonuniformity of the various diffusion processes that take place. Casciari et al. [13] developed empirical correlations from experimental data to express mammary sarcoma of mouse (EMT6/Ro) tumor cell growth rates, oxygen consumption rates, and glucose consumption rates as functions of oxygen concentration, glucose concentration, and extracellular pH. Duechting [14] proposed a block diagram describing growth of normal cells as well as growth of benign and malignant tumors. He studied frequency and transition responses, locus diagrams, and stability conditions. Gatenby [15] developed a population ecology