

Genomics and Proteomics Engineering in Medicine and Biology - Metin Akay
.pdf194 ERROR CONTROL CODES AND THE GENOME
all-zero vector:
s ¼ rHT ¼ (v þ e)HT ¼ vHT ¼ 0 |
(7:26) |
If Cn,k represents the codebook (i.e., contains all codewords v) for a linear (n,k) block code, then based on Eq. (7.26) we can state the following:
Cn,kHT ¼ Z |
(7:27) |
where Z is the all-zero matrix. Therefore, given a set of codewords produced using a linear block code, it is feasible to determine the dual code H and ultimately the corresponding generator G for the codebook. This is the rationale used in constructing a generator for the systematic block code model for translation initiation in prokaryotes.
For systematic (n, k) codes, the model assumed by May et al. [49], G and H are of the form
G ¼ ½Ik; P& |
(7:28) |
H ¼ ½PT; In k& |
(7:29) |
where P is a k (n k) matrix and I represents the k k [or (n k) (n k)] identity matrix [23, 25]. Assuming a systematic code reduces the number of unknowns in the H matrix by (n k)2, the systematic form also simplifies conversion from H back to G.
For a given codebook set Cn,k corresponds to a linear, systematic block code. We can find the optimal solution for H by interrogating all possible solutions for P (except P ¼ Z). The optimal solution produces an H that optimizes a cost function of the form
Fitness(H |
j |
P) |
¼ |
R |
S |
jzeros in Sj |
þ |
R |
P |
jnonzeros in Pj |
(7:30) |
||
|
|
|
j |
S |
j |
|
P |
|
|||||
|
|
|
|
|
|
|
|
|
|
j j |
|
||
where S represents the syndrome matrix (each row in S corresponds to the syndrome of a codeword in Cn,k) and RS þ RP ¼ 1:0.
The methodology was tested using the (7,4) Hamming code’s codebook, CHamming(7,4) [25]. The algorithm successfully recovered the generator matrix for the (7,4) Hamming code. The verification test produces a code with a fitness
value of 1; this is expected since CHamming(7,4) is a complete, error-free representation of the code.
Given the positive results of the original block code model [49], the codebook,
COriginal(5,2) , for the systematic parity check code is used as an initial estimate of the set of valid codewords for the translation initiation system. Generators
were also constructed using two additional codebook sets: COrigDmin(5,2) and C16S(5,2) . Here, COrigDmin(5,2) is a reduced subset of COriginal(5,2) , constructed by selecting a minimum number of codewords from COriginal(5,2) such that each two-base
7.3. REVERSE ENGINEERING THE GENETIC ERROR CONTROL SYSTEM |
195 |
information sequence is represented and the minimum-distance value for the code-
book set is maximized. The codewords in the C16S(5,2) codebook are the five-base subsets formed from contiguous bases of the 16S rRNA, known to interact with
the mRNA leader region during initiation.
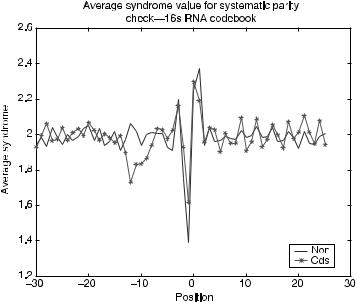
Equation (7.26) is used to evaluate the performance of the optimal generator produced. For each optimal generator matrix G, the corresponding parity-check matrix H is used to calculate the syndrome values for mRNA subsequences that are valid leaders or invalid leaders (intergenic regions). Figure 7.13 shows the results for
C16S(5,2) , where the horizontal axis is position relative to the first base of the initiation codon and the vertical axis is the average syndrome value (the syndrome is either 0
for actual zero values or 1 for all nonzero syndrome values).
The sets GOriginal(5,2) and G did not produce syndrome patterns with regions of distinction resembling the minimum-distance plots produced in
May et al.’s original block code model [49]. But, the generator derived from strict subsets of the 16S rRNA (Fig. 7.13) more closely resembles the minimum-distance results of the May et al. model. The (212 : 26) region exhibits the greatest difference between the valid and invalid sequence groups. As expected, in this region the valid leader sequences have the relatively lower average syndrome value. The G16S(5,2) model also produces strong synchronization patterns for the valid sequence group. The synchronization patterns appear to exhibit a frequency of 3, suggesting that the pattern can be useful for reading frame identification.
FIGURE 7.13. Average syndrome value for generator G16S(5,2).
196 ERROR CONTROL CODES AND THE GENOME
The linear block code approach provides a framework for constructing inverse quantitative models for genetic regulatory processes. Optimization and algebraic approaches to solving Eq. (7.27) are being actively explored.
7.3.3.2. Inverse ECC Model II: Functional Inversion In addition to sequence-based models and analysis methods, translation initiation models can be constructed by analyzing possible binding patterns between mRNA leader sequences and the exposed portion of the 16S rRNA. Although binding is related to higher level interactions influenced by mRNA structure, rRNA structure, and ribosomal and protein interactions, it is hypothesized that translation initiation can be viewed from a binary perspective. Studies of prokaryotic translation initiation sites reveal that ribosomal binding sites appear to evolve to functional requirements rather than to genetic sequences that produce the strongest binding site [17]. Several factors influence translation of mRNA sequences, including initiation codon, presence and location of the Shine–Dalgarno sequence, spacing between the initiation codon, and the Shine–Dalgarno domain, the second codon following the initiator codon, and possibly other nucleotides in the 220 to þ13 region of the mRNA leader region [38]. These factors influence how the small subunit of the ribosome interacts with and binds to the mRNA leader region such that conditions are favorable for successful translation initiation. The binding pattern formed between the 16S rRNA and the mRNA leader region directly affects translation initiation.
Functional Definition of mRNA Leader and Ribosomal Interaction A leader sequence with perfect complementary base pairing to the 16S rRNA may not be the most viable sequence from an evolutionary viewpoint. However, it is plausible to assume that increased affinity to the 16S rRNA increases initiation potential. Not only must a leader sequence contain nucleotides that bind to the 16S, the binding must occur within a reasonable proximity to the initiation codon [38]. Since translation initiation is influenced by positional binding, the biological process of translation initiation can be mapped to a functional, binary domain. Sequence information and the last 13 bases of the 16S rRNA,
30 A U U C C U C C A C U A G . . . 50 |
(7:31) |
are used to map mRNA leader regions to their positional binding representations. After mapping the mRNA sequence into binary binding vectors, each vector is categorized based on their (M1, M2, M3) binding pattern values. Given a 13-base binary binding pattern, the value M1 is the greatest number of consecutive base pairings (1’s), M2 is the second greatest, and M3 is the third greatest. The expectation is that binding patterns with large M1 values, within an acceptable distance from the initiation codon, will favor translation initiation. Sequences with smaller M1 values would be expected to have significant M2 and M3 values to increase the
probability of ribosome binding.

7.3. REVERSE ENGINEERING THE GENETIC ERROR CONTROL SYSTEM |
197 |
Each positional binary binding pattern is classified based on their (M1, M2, M3) value. Different binary binding patterns can belong to the same (M1, M2, M3) class. Each (M1, M2, M3) class was assigned a number between 1 (M1 ¼ 13, M2 ¼ 0, M3 ¼ 0) and 91 (M1 ¼ 0, M2 ¼ 0, M3 ¼ 0). For example, given the following two binary binding vectors:
BinaryBindingVecA |
¼ 1 1 1 0 0 0 1 0 0 0 0 0 0 |
(7:32) |
BinaryBindingVecB |
¼ 0 1 0 0 0 0 0 0 0 1 1 1 0 |
(7:33) |
Both vectors would be classified as (M1 ¼ 3, M2 ¼ 1, M3 ¼ 0), or with the classification number 80. The probability of each classification number occurring (based on all possible 13-base binding vectors) is calculated and classification thresholds were tabulated.
To test the assumption that valid initiation regions fall within a given (M1, M2, M3) pattern threshold that differs from the average for the nonleader and random sequence groups, binding analysis is performed on 531 E. coli leader sequences, 1000 E. coli intergenic, nonleader sequences, and 1000 randomly generated sequences. The nonleader and random sequences all had AUG initiation sites in the center of the candidate sequence. Each sequence contained 60 nucleotide bases.
The mRNA leader sequences were mapped to their corresponding binary binding vectors and classified based on their (M1, M2, M3) values as previously described. The positional (M1, M2, M3) vectors were evaluated for each sequence group. Figure 7.14 shows the percent of sequences with (M1 ¼ 4, M2 ¼ 0, M3 ¼ 0) or
FIGURE 7.14. Percent of sequences with binding pattern of 4,0,0 and above.

198 ERROR CONTROL CODES AND THE GENOME
stronger binding pattern. The horizontal axis represents position and the vertical axis represents the percent of sequences in each sequence group with a binding pattern of (M1 ¼ 4, M2 ¼ 0, M3 ¼ 0) or greater. From Figure 7.14 we note the following:
.The region between 218 and 29 has the greatest distinction between the translated sequence group and the nontranslated and random sequence groups. This is consistent with regions of distinction found in previous work [50].
.Inside the coding region for translated sequences (position 0 and greater), there is a clear synchronization pattern which repeats every three bases. This pattern is not as consistent in the nontranslated or random sequence groups.
Using the same sequence information, the best binding pattern was selected for each sequence in each group. The strongest binding pattern (per sequence) was recorded for positions 218 to 212. Table 7.3 shows the distribution of strongest binding patterns in each of the (M1, M2, M3) binding classification groups. As the results in Table 7.3 indicate, a binding pattern threshold of 71 [i.e., (M1 ¼ 4, M2 ¼ 0, M3 ¼ 0) or stronger] captures a large amount of translated sequences while excluding a significant number of nontranslated and random sequences.
Thus far, the functional binding statistics have characterized the binding behavior over specific position ranges. The key to defining the binary binding model (and ultimately the convolutional coding model) for translation initiation lies in the ability to capture positional binding information. Ribosomal recognition of a translation initiation site depends on more than one position in the leader sequence. Positional binding information of translated and nontranslated sequences was compared using the joint probability ratio:
p |
P(bind, position j translated) |
(7:34) |
||
|
¼ P(bind, position |
j |
nontranslated) |
|
|
|
|
||
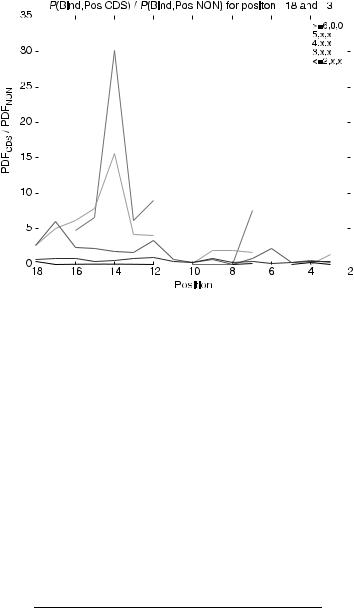
The probability p was calculated for positions 218 to 23 and the results (by binding pattern classification groups) are shown in Figure 7.15, where the horizontal axis is position relative to the first base of the initiation codon and the vertical axis is
TABLE 7.3 Distribution of Strongest Binding Patterns for Translated, Nontranslated, and Random Sequence Groups
(M1, M2, M3) |
Translated (%) |
Nontranslated (%) |
Random (%) |
13,0,0 to 6,0,0 |
14.12 |
1.50 |
1.50 |
5,x,x |
22.41 |
3.80 |
3.67 |
4,x,x |
30.51 |
14.00 |
14.50 |
3,x,x |
27.68 |
39.20 |
40.67 |
2,x,x to 0,0,0 |
5.27 |
41.50 |
39.67 |
|
|
|
|
7.3. REVERSE ENGINEERING THE GENETIC ERROR CONTROL SYSTEM |
199 |
||||||||||||||||||||||||||||
|
|
|
|
|
|
|
|
|
|
|
|
|
|
|
|
|
|
|
|
|
|
|
|
|
|
|
|
|
|
|
|
|
|
|
|
|
|
|
|
|
|
|
|
|
|
|
|
|
|
|
|
|
|
|
|
|
|
|
|
|
|
|
|
|
|
|
|
|
|
|
|
|
|
|
|
|
|
|
|
|
|
|
|
|
|
|
|
|
|
|
|
|
|
|
|
|
|
|
|
|
|
|
|
|
|
|
|
|
|
|
|
|
|
|
|
|
|
|
|
|
|
|
|
|
|
|
|
|
|
|
|
|
|
|
|
|
|
|
|
|
|
|
|
|
|
|
|
|
|
|
|
|
|
|
|
|
|
|
|
|
|
|
|
|
|
|
|
|
|
|
|
|
|
|
|
|
|
|
|
|
|
|
|
|
|
|
|
|
|
|
|
|
|
|
|
|
|
|
|
|
|
|
|
|
|
|
|
|
|
|
|
|
|
|
|
|
|
|
|
|
|
|
|
|
|
|
|
|
|
|
|
|
|
|
|
|
|
|
|
|
|
|
|
|
|
|
|
|
|
|
|
|
|
|
|
|
|
|
|
|
|
|
|
|
|
|
|
|
|
|
|
|
|
|
|
|
|
|
|
|
|
|
|
|
|
|
|
|
|
|
|
|
|
|
|
|
|
|
|
|
|
|
|
|
|
|
|
|
|
|
|
|
|
|
|
|
|
|
|
|
|
|
|
|
|
|
|
|
|
|
|
|
|
|
|
|
|
|
|
|
|
|
|
|
|
|
|
|
|
|
|
|
|
|
|
|
|
|
|
|
|
|
|
|
|
|
|
|
|
|
|
|
|
|
|
|
|
|
|
|
|
|
|
|
|
|
|
|
|
FIGURE 7.15. Positional binding ratio of translated sequence group to nontranslated sequence group.
the ratio defined in Eq. (7.34). Discontinuities are a result of dividing by zero. Ratios greater than 1 indicate positions where translated sequence binding dominates nontranslated. Ratios less than 1 indicate the opposite occurrence. Table 7.4 summarizes the key positions for each binding classification group in Figure 7.15 that achieved ratios greater than 1. Positional ratio values are used to determine weighting coefficients for horizontal motif-based convolutional codes for binary binding vectors (also used to develop horizontal motif-based base 5 convolution codes in related work [26]).
From Binding Vectors to Codewords and Inverse ECC Systems Each binding vector pattern can be considered a codeword for that position. The question becomes what coding system produced the binding vector codewords and whether
TABLE 7.4 Location of Largest Translated to
Nontranslated Positional Binding Ratio Value
(M1, M2, M3) |
Position |
13,0,0 to 6,0,0 |
214 |
5,x,x |
214 |
4,x,x |
217 |
3,x,x |
Ratio ,1 |
2,x,x to 0,0,0 |
Ratio ,1 |
|
|
200 ERROR CONTROL CODES AND THE GENOME
the coding system follows a horizontal encoder/decoder or a vertical coding scheme. The 13-bit binding patterns present in translated sequences are viewed as codewords generated by a candidate convolutional encoder. We developed a genetic algorithm (GA) and used it to construct convolutional code models that best describe the binary codewords (i.e., the functional aspects of the translation initiation process).
Similar to previous convolution code construction methods, we use GAs to search for the optimal code (thereby inverting the ECC system) based on a fitness criterion [51]. An optimal code is defined as a code that recognizes the binary binding patterns which describe the interaction between the ribosome and the mRNA. The effectiveness of each candidate code model is evaluated using the n k decoding gmasks constructed from the candidate code (see [27, 29, 52] for a description of binary table-based coding and gmask construction). The GAs search space included all possible (n, k, m) binary convolutional codes. The population, fitness evaluation method, and genetic operators are defined based on the following objective: Locate an (n ¼ 3, k ¼ 1, m ¼ 4) binary convolutional code that has the greatest probability of producing the binary binding vector for each E. coli leader sequence in the training set. The fitness of each individual in the population (a set of potential solutions) is based on the syndrome values produced when the code’s gmasks are applied to the mRNA binary binding vector sequence. A syndrome value of zero indicates that no errors within the code’s error detection capability occurred. Random selection and target sampling rates are used to select highly fit individuals for reproduction. New populations are created using parameterized uniform crossover. Mutation is used to preserve population diversity and elitism ensures that the most fit solution is not discarded. The GA searches for the optimal horizontal equal weight (equal error protection) and motif-based, unequal error protection (UEP) codes for each sequence. To construct vertical-code models, the GA searches for the optimal convolutional code in each position of the leader regions’ binding vectors for the entire data set.
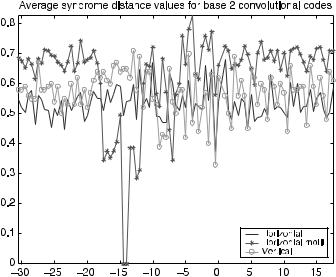
Messenger RNA leader sequences from E. coli K-12 strain MG1655 (downloaded from the National Institutes of Health site ncbi.nlm.nih.gov and parsed by Rosnick [53]) are used as training sequences for constructing the best candidate code model. The syndrome distance vector for each code model is calculated and indicates how well the associated decoder recognizes the subsequence at hand. If the GA found the perfect code, the convolutional coding system that produced the exact sequence, then the syndrome distance vector would be the all-zero vector and the fitness value would be 1.
Figure 7.16 shows the average syndrome distance value for the optimal codes discovered using the E. coli model set. The horizontal axis is position relative to the first base in the initiation codon and the vertical axis is the average syndrome distance value. The resulting ECC binary models performed comparable to one another. The motif-based method captured the functional behavior of the ribosome binding site better than the other two models. Unlike the base 5 models [26] where all-zero parity sequences (i.e., binary binding vectors) do not occur, the binary code models are affected by all-zero binding patterns. The effects of the
7.3. REVERSE ENGINEERING THE GENETIC ERROR CONTROL SYSTEM |
201 |
FIGURE 7.16. Average syndrome distance from all-zero syndrome for binary table-based convolutional code models for translation initiation.
all-zero parity can be minimized by using motif-based fitness measures over regions in the mRNA with greater binding affinity to the exposed portions of the 16S rRNA. Use of fitness penalties for all-zero parity sequences may improve the models. The resulting gmasks were affected, as in the base 5 case, by the table-based gmask construction method. Investigating other decoding methods and increasing the memory length of the code should improve the resulting models.
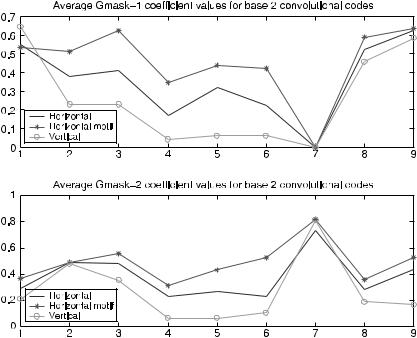
The gmask coefficients were analyzed to determine which binding regions and to what degree binding relationships between the mRNA leader sequence training set and the exposed portion of the 16S rRNA are captured by the code models. Figure 7.17 shows the average gmask values for the code models. The horizontal axis indicates bit position in the gmask vector. The vertical axis is the average value of the gmask coefficients over all codes in the model set.
For each 12-bit binary binding subpattern, the 9-bit gmask shifts twice. Each shift corresponds to binding with a different region of the last 13 bases of the 16S rRNA:
Shift1 |
¼ ( . . . |
A |
U |
U |
C |
C |
U |
C |
C |
A . . . |
) |
Shift2 |
¼ ( . . . |
C |
C |
U |
C |
C |
A |
C |
U |
A . . . |
) |
For the 9-bit gmask, coefficient values of 1 indicate a position on shift sequence 1 or 2 with which the mRNA leader must form a hydrogen bond. In Figure 7.17, position 7 on both gmasks and, to a slightly lesser degree, position 4 are the results of the gmask construction method used in table-based codes. Figure 7.17 indicates that the gmasks for vertical codes contain a relatively large number of zeros in many
202 ERROR CONTROL CODES AND THE GENOME
FIGURE 7.17. Average gmask values for binary table-based convolutional code models for translation initiation.
positions. Large number of zeros in the gmask of the vertical-code model probably inflated the syndrome distance performance results of the vertical-code model. Although the equal-weight horizontal code’s gmasks contained fewer zeros than the vertical code, its gmasks still contained more zeros than the motif-based horizontal code’s gmasks. For gmask 1, positions 1 to 3 had relatively high average coefficient values for the motif-based codes. This corresponds to the first three codons in shift 1 or 2: (A U U) or (C C U), codons complementary to regions of the Shine–Dalgarno sequence. The last two positions of gmask 2 (motif-based model) also indicated high binding, corresponding to binding with the last two bases in shift 1 or 2: (C A) or (U A). The high binding areas for gmask 2 of the motif-based horizontal-code model are positions 2 and 3 and positions 6 and 7. These positions correspond to (U U) and (U C) or (C U) and (A C).
Functional code models for protein translation initiation aid in understanding the system and can help define the binding behavior that is necessary for translation initiation. The accuracy of the model can be increased by incorporation of more specific binding information such as the number of hydrogen bonds formed per binding event. Inverse functional models can lead to improvements in the sequence-based coding models and aid in the development of algorithms for designing and improving the efficiency of transgenic leader sequences.
7.4. APPLICATIONS OF BIOLOGICAL CODING THEORY |
203 |
7.4. APPLICATIONS OF BIOLOGICAL CODING THEORY
As more researchers explore the ECC properties of genetic sequences and apply these methods to computational biology and molecular computing problems, the informationand coding-theoretic properties of genetic systems can be further understood and potentially exploited for bioengineering applications.
7.4.1. Coding Theory and Molecular Biology
Coding-theoretic methods have been used to analyze genetic sequences for various classification purposes. Arques and Michel statistically analyzed the results of 12,288 autocorrelation functions of protein-coding sequences [54]. Based on the results of the autocorrelation analysis, they identified three sets of circular codes X0, X1, X2 that can be used to distinguish the three possible reading frames in a protein-coding sequence [54]. A set of codons X is a circular code, or a code without commas, if the code is able to be read in only one frame without a designated initiation signal. Crick et al. originally introduced the concept of codes without commas in the alphabet A, C, G, T. It was later successfully addressed and extracted over the alphabet R, Y, N [54]. Arques and Michel define a circular code over the A, C, G, T alphabet. They were able to use the three sets of circular codes to retrieve the correct reading frame for a given protein sequence in a 13-base window. They have used their coding-based model to analyze Kozak’s scanning mechanism for eukaryotic translation initiation and other models of translation [54].
Stambuk also explored circular coding properties of nucleic acid sequences [55, 56]. His approach was based on the combinatorial necklace model, which asks: “How many different necklaces of length m can be made from a bead of q given colors” [55, 57]. Using q ¼ ½A, C, G, T& and q ¼ ½R ¼ purine, Y ¼ pyrimidine, N ¼ R or Y &, Stambuk applied the necklace model to genetic sequence analysis [55]. Although Stambuk did not use ECC in his analysis, his work demonstrated the use of coding theory arithmetic in the analysis of the genetic code.
Researchers have applied source coding to genetic sequences [16, 58]. In the engineering communication system, source encoding, or data compression, occurs prior to channel coding (ECC). Source encoding removes the redundancy in the information stream to reduce the amount of symbols transmitted over the channel. The compression algorithm assigns the most frequent patterns shorter descriptions and the most infrequent patterns are assigned longer descriptions [43]. Loewenstern et al. apply source-coding methods to genomic sequences for the purpose of motif identification [16, 59, 60]. Powell et al. implemented compression schemes for finding biologically interesting sites in genomic sequences [58]. Delgrange et al. used data compression methods to locate approximate tandem repeat regions within DNA sequences [61].
7.4.2. Coding Theory and DNA Computing
The field of DNA computing was launched when Adleman solved an instance of the Hamiltonian path problem using DNA strands to encode the problem and biological