


32 UsingArcViewDatabaseAccess
Exercise 3: Find locations for an advertising campaign
In the previous exercise, you chose the candidate counties for your advertising campaign. However, you only want to advertise in urban areas, and at first you only want to advertise in three states. Based on the results of the campaign in these states you can modify the campaign as it grows.
First you need to find out where the urban centers in the United States are by finding the cities with a population of at least 100,000. Then you can find out which counties are within 50 miles of those cities. The states you start the campaign in will be the three states with the highest number of single, detached houses.
In this exercise, you’ll learn how to:
•Change a database theme’s attributes and the tables they come from.
•Find features in a map by their attributes.
•Find features in a map by their spatial relationship with other features.
•Export features from a database theme to a shapefile.
•Create a summary database table.
•Sort the records in a database table.
•Join attributes in a database table to features in a shapefile.
If ArcView isn’t already running, start it. Open the project from Exercise 1 by choosing Open Project from the File menu. Log in to the database connections stored in your project by typing your user name and password into the Login dialog.
To locate the urban centers in the United States, find out which cities have a population of at least 100,000. If you identify a city in the Cities theme using the Identify tool  , you won’t see a population attribute. The cities demographic data is stored in a different table in your database. You need to join the city and demographic tables together, then add the Pop1990 column to the theme’s attributes. The common field between these tables is State_City. The steps below refer to the cities demographic table as Cidemog.
To change a database theme’s attributes
1.Make the Cities theme active.
2.Click the open theme table button  . Move and/or resize the database table and the view so they do not overlap and are both visible.
3.Click on the View to make it the active document.
Chapter2 QuickstarttutorialforSDE |
33 |
4.Click on the Theme Properties button  . The Theme Properties dialog appears. Make sure the Definition property is selected.
5.Click the Query Builder button  in the Theme Properties dialog.
6.Choose the Cidemog table from the Available Tables list, then add it to the Selected Tables list by clicking the ‘>’ button. Click Next.
7.Double-click the Cities table’s name to see a list of its columns.
8.Double-click the name of the State_City column. It appears in the where clause below.
9.Click the Equal To button to add the = operator to the where clause.
10.Double-click the Cities table’s name to hide its list of columns, then double-click the Cidemog table’s name to see a list of its columns.
11.Double-click the name of the State_City column. It appears in the where clause below. Click Next.
12.From the Table drop-down list, choose the Cidemog table.
13.Click Unselect All, then click in the Select column next to the Pop1990 column. Click Finish.
14.Click OK in the Theme Properties dialog.
The Cities theme redraws and the Cities database table is refreshed. The population attribute that was added to the theme’s definition is also added to the database table.
In the steps above, you defined a new join statement because you added a table to the theme’s query. If you remove a table, you also need to remove the corresponding join statement from the where clause.
The type of join used by the Counties and Cities themes is called an inner join, where the rows returned have the same value in both tables for the common field. There are other ways to join tables together. Suppose the Codemog table had data for the State of New Hampshire only. An outer join would retrieve a row for every US county, but only the New Hampshire counties would have values in fields from the Codemog table.
To define outer joins for Oracle databases, the syntax is “World.Counties.Fips = World.Codemog.Fips(+)”. To define an outer join statement when creating a database theme, skip the Join panel by clicking Next, then build it in the where clause panel.
Now find out which cities have a population over 100,000. Using the SQL Query Builder, specify attribute criteria to select those cities. The attribute selection criteria are appended to the theme’s query to create a new selection query. ArcView finds the records satisfying the Selection query, then highlights their shapes by drawing them in yellow on the map.
34 UsingArcViewDatabaseAccess
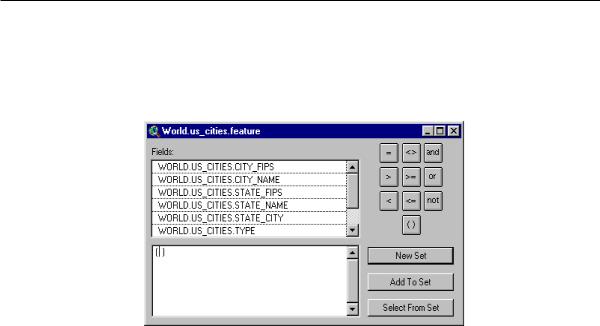
To find features in a map by their attributes
1.Make sure the U.S. Counties window active.
2.Click the Query Builder button  in the button bar for Views. The SQL Query Builder dialog appears.
3.Double-click the Cidemog.Pop1990 column. It appears in the where clause below.
4.Click the Greater Than button to enter the > operator into the where clause.
5.Type in “100000”.
6.Click New Set. ArcView’s status bar shows that 200 cities have been selected.
7.Close the Query Builder dialog.
Spatial queries can be used to select features in a database theme as well. Using the Selection tool  , select features by clicking or by dragging a rectangle over them, or draw graphic shapes on the map and then select the features intersecting those shapes by clicking the Select by Graphics button
  . The spatial selection criteria are appended to the theme’s query to create the selection query.
Since the Cities database theme is linked to the Cities database table, the cities with a population greater than 100,000 are selected in both the theme and the table.
You can find features in one theme that are spatially related to the selected features in another theme. This is called theme-on-theme selection. To find the US counties near urban centers you’ll select the counties within 50 miles of the selected cities.
To find features in a map by their spatial relationship with other features
1.Make the Counties theme active.
2.From the Theme menu, choose Select By Theme. The Select By Theme dialog appears.

Chapter2 QuickstarttutorialforSDE |
35 |
3.From the second drop-down list, choose the Cities theme.
4.From the first drop-down list, choose Are Within Distance Of.
5.In the Selection distance box, type 50.
6.Click New Set.
ArcView’s status bar shows that 377 counties have been selected. This is the final list of counties to advertise in.
When you save a project, ArcView doesn’t record which features in a database theme are selected because if the database is dynamic, today’s queries can produce different results tomorrow. To preserve the selected counties, you need to export them to a shapefile.
To export features from a database theme to a new shapefile
1.From the Theme menu, Choose Convert to Shapefile.
2.In the dialog that appears, specify the name (e.g., mycounties) and location of the new shapefile that will be created. Click OK.
Optimizing your queries
Tables in a relational database can contain millions of records. Even simple queries against large tables can take time. Try to optimize queries to get the best performance possible.
Index the columns used in join statements and attribute criteria to improve performance (you can do this with Avenue scripts). Choose the SQL operators for attribute criteria carefully. Some operators are faster; some don’t use indexes even if they exist. In a join statement, placing tables on the left or right of the equal sign can impact performance. These are a few considerations. Carefully read the database’s documentation to learn more about optimizing attribute queries.
SDE lets you use spatial criteria for queries as well. With Avenue scripts, you can create spatial criteria to select the features a database theme represents. To optimize queries with both attribute and spatial criteria, evaluate first the criteria that eliminates the most records. If the map contains few features selected by attribute criteria that are spread across a large area, evaluate the attribute criteria first. If your map covers a small area, evaluate the spatial criteria first.
Change the order for evaluating criteria by choosing Attributes first or Spatial first in the Theme Properties dialog. Optimized queries (the default) are almost always Spatial first; they evaluate attribute criteria first only when they have spatial criteria with a negative test, for example, “select features not inside the buffer”.
36UsingArcViewDatabaseAccess
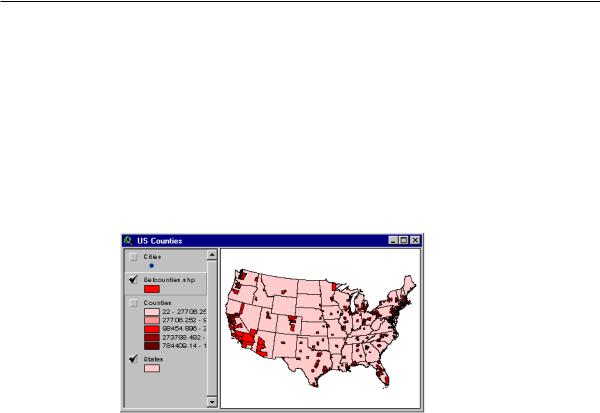
3.Click Yes to add this new shapefile to the view as a theme.
4.Turn off the Counties theme in the view.
5.Draw the new theme by clicking the check box next to its name in the Table of Contents. Make sure the Cities theme is at the top of the Table of Contents so it draws on top of the other themes.
6.Clear the selected cities by making the Cities theme active, then clicking the Clear Selected Features button  .
.
If you identify a county in the shapefile theme using the Identify tool, you’ll see that only the attributes that were part of the database theme are now part of the shapefile.
There are several other reasons you might export a database theme’s features to a shapefile. You might create a shapefile to use your SDE data with other ArcView extension software such as ArcView Network Analyst, ArcView Spatial Analyst, or ArcView 3D Analyst™ . You might also export data to use it locally when you don’t have access to an SDE server (e.g., when you are using a portable computer) or to release an SDE client license for someone else in your organization to use.
The final step, in this exercise, is to find out in which three states you’ll begin the advertising campaign. Find the states with the highest number of single, detached houses by creating a database table that summarizes the Units_1det values for each state.
To create a summary database table
1.Make the Project window active by choosing Sdetutorial.apr (the name you saved this project file under) from the Window menu.
2.From the Project menu, choose Database Table Preferences.
3.Change the Fetch count to 40.
4.Change Cache size 200.
Chapter2 QuickstarttutorialforSDE |
37 |
5.Click OK.
6.From the Project menu, choose Add Database Table. The Add Database Table dialog appears.
7.Choose SDE from the Database Access drop-down list.
8.Double-click World.Counties in the Tables list. The Counties table appears in the From box.
9.Double-click World.Codemog in the Tables list. The Codemog table appears in the From box.
10.Place the cursor in the Select box, then type “ World.Counties.State_Name, SUM(World.Codemog.Units_1det) as Total_1det”.
11.Place the cursor in the Where box, then type “ World.Counties.Fips = World.Codemog.Fips Group By World.Counties.State_Name”.
12.From the Unique Column drop down list, choose <none>.
13.Set the Table Name to States Summary.
14.Click Query.
15.Close the Add Database Table dialog.
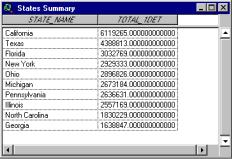
A new forward only scrolling database table appears containing the total number of single, detached houses by state for the first 40 rows.
The first 40 rows are retrieved because you set the fetch count, which is the number of rows retrieved from the database at once, to 40. If you scroll forward past the first 40 records, you will see that the table size grows to 51 records. This is because a second fetch was required to view the rows below the first 40. The cache size was set to 200, because this is the minimum cache size and it is large enough to hold the entire table in memory.
By default, the Fetch count is 100 rows and the Cache size is 1000 rows. With the default settings, any table with less than 1000 rows is held entirely in memory. If the table is forward only scrolling and has more than 1000 records, you may not be able to scroll back to the beginning of the table. For example, if you scroll forward to record 1100 and then scroll backwards, you will only be able to get back to record 100 since only 1000 records can be cached. You can get back to the beginning of the table by choosing refresh from the table menu.
The Fetch count must be greater than or equal to 20 and less than or equal to 200. The cache size can be set to either 0 or greater than or equal to 200. If the cache size is set to 0, all records will be cached in memory.
Although not as obvious, the Cache size and Fetch count also affect keyset database tables.

38 UsingArcViewDatabaseAccess
You must consider the amount of memory on your machine and the number of tables you plan to create when setting the cache size. The larger you can set the cache size, the better the scrolling performance since more of the table is held in memory at once.
The query used to create the States Summary table uses a group by clause with the State_Name column. This means that each row in our States Summary table can be uniquely identified by state name. We can use the State_Name column as a Unique Column and convert the table to a keyset table.
To convert to a keyset database table
1.Make the States Summary table active.
2.From the Table menu choose Properties. The Database Table Property dialog appears.
3.From the Unique Column Table drop-down list, choose World.Counties.
4.From the Unique Column drop-down list, choose STATE_NAME.
5.Click OK.
The select tool and the select buttons in the table GUI are now enabled and ToolBar displays the total number of records returned from the query (51).
To make the table easier to analyze, you can sort the rows in the table based on the Total_1det column. To do this, add the OrderBy clause to the Table’s query. Sorting this way ensures that the rows will always appear in sort order, even if the table is refreshed. If you use the sort descending button  , the sort order is temporary and will be lost when the table is refreshed.
Working with database tables
Some table functions work a little differently on database tables than they do on normal tables.
•The Find function is usually case sensitive on database tables. It will be case sensitive if searches involving data values are case sensitive in your database.
•If you get statistics about a column in the table, they’re calculated for all the records selected by the table’s query, not just the current selection.
•A chart cannot be created for a database table directly. You must first export it to a normal table.
•When you refresh a database table, the selection is lost.
Chapter2 QuickstarttutorialforSDE |
39 |
To sort the records in a database table
1.From the Table menu, choose Properties.
2.Click in the SQL Statement box, placing the cursor at the end of the SQL statement.
3.Type in a space, then type, “Order By Total_1det desc”.
4.Click OK.
The values in your database table change to reflect the new SQL Select statement.
You’ll start advertising in California, Texas, and Florida. There are two ways to find the counties in those states. You can redefine the counties shapefile to contain only counties whose state names are California, Texas, or Florida. Alternatively, you can join this database table to the shapefile’s attribute table, then redefine the theme to contain only the counties with a Total_1det value greater than 3,000,000.
To join attributes in a database table to features in a shapefile
1.Make the U.S. Counties window active.
2.Make the Mycounties theme active.
3.Click the Open Theme Table button  . The theme’s attribute table, called Attributes of Mycounties, appears.
4.Make the States Summary table active, then make its State_Name field active.
5.Make the Attributes of Mycounties table active, then make its State_Name field active.
6.Click the Join button  .
.

40 UsingArcViewDatabaseAccess
Now the local shapefile contains values from the database table in addition to its own values. Those values aren’t saved with the shapefile; they’re stored in a temporary file separate from the database table. ArcView will retrieve values from the database and re-create the join every time you open this project. For information on redefining a shapefile theme, see the Using ArcView GIS book.
The examples you’ve completed illustrate how to use database themes, database tables, and shapefiles together to solve spatial problems. Database themes allow you to work with an extremely large number of features efficiently, while shapefiles are appropriate for working with a small number of shapes that you’ve found using database themes. Database tables let you calculate and summarize values and get statistics about your data; database themes don’t. Each component provides a unique set of capabilities, and therefore you often need to use all components together to generate a solution.
There are several kinds of problems you can’t solve using ArcView’s interface, but you can using Avenue scripts. To learn how, you first need to understand which objects you need to use and how they work. The following chapters explain the Database Access objects and will get you started writing Avenue scripts for your SDE data. However, if you’ve never used Avenue before, you should review the Using Avenue book before moving on to Chapter 4.
41
C H A P T E R 3
Quick start tutorial for ODBC
The exercises in this chapter begin with the basics of adding a database table, joining database tables, and changing the query for your database table using ODBC.
To follow the exercises, you need access to the ODBC database containing city data for the United States, and demographic tables for U.S. cities. You should review the section “Before you start the ‘Quick start tutorial exercises’” in Chapter 1 before you begin.
Each exercise builds on the previous one. You can work through them at your own pace. When you stop, save your work so you can pick up where you left off.
In this chapter, you’ll perform exercises with the Database Access extension to identify potential markets for new home developments:
•Exercise 1: Identifying potential market cities in the United States
•Exercise 2: Narrowing your search for new market cities