


22 UsingArcViewDatabaseAccess
Exercise 2: Find counties with many single family homes
Now that you have a map you can start to analyze the data in it. In your advertising campaign you want to focus on counties with a large number of single family homes. The Units_1det column in the Codemog table contains the number of single, detached houses for each county, which is the nearest attribute for the number of single family homes. You want to determine the minimum Units_1det value for the counties that will be part of the advertising campaign.
You’ll find out about the values in the Units_1det column by looking at them, getting statistics, then classifying the Counties theme. After determining the minimum Units_1det value for the campaign, you will redefine the Counties theme to represent only the counties that fall above that value, the candidates for the advertising campaign.
In this exercise, you’ll learn how to:
•See a database theme’s attributes in a database table.
•Get statistics for a column of values in a database table.
•Create a new database table.
•Classify a theme’s features by their attributes.
•Change a database table’s definition query.
•Change the shapes and attributes a database theme represents.
If ArcView isn’t already running, start it. Open the project you created in Exercise 1 by choosing Open Project from the File menu. Log in to the database connections stored in the project by typing your user name and password into the Login dialog.
A database theme’s connection tells ArcView where to find its values on the network. When you log in, the relational database verifies your user name and the permissions you have in the database. Different users may not be able to access the same set of tables. Similarly, you may be able to read from tables in a database but unable to edit the data in those tables.
Before deciding on the minimum Units_1det value for the campaign, you need to get some information about the Units_1det values. It would help to look at a sample of the values to get a general idea of their magnitude and range. You can create a database table to see a database theme’s attributes.
Chapter2 QuickstarttutorialforSDE |
23 |
To see a database theme’s attributes in a database table
1.Make your map, the U.S. Counties window, active by choosing U.S. Counties from the Window menu. If U.S. Counties isn’t listed, choose U.S. Counties in the Project window’s Views list, then click Open.
2.Make the Counties theme active.
3.Click the Open Theme Table button  .
.
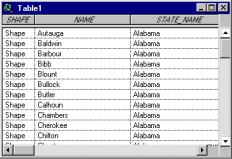
A database table appears containing the attribute values retrieved by your database theme’s query.
There are two types of database tables, forward only scrolling database tables and keyset database tables. A forward only scrolling database table allows you to scroll forward all the way through the table but limits how far backwards you can scroll. The number of records that you can access scrolling backwards is defined by the cache size. You can set the cache size using database table preferences, which is explained later in the chapter. A keyset database table supports selections and allows you to scroll forwards and backwards through the entire table.
Database tables that are created from database themes will be keyset tables except when the theme has a one-to-many join or if the theme has more records than the maximum keyset size. The maximum keyset size is described in more detail below.
To support selections and scrolling, keyset database tables require a unique string or integer column in one of the tables in the query. For tables defined from SDE database themes, this column is automatically set to SDE’s unique id column. You can tell that the table created in this example is a keyset table because the select tool  is enabled. When a keyset database table is created, a link is established where a database theme selection is applied to the database table and a database table selection is applied to the associated database theme.

24 UsingArcViewDatabaseAccess
Maximum Keyset size
The maximum keyset size is the maximum number of records allowed for a keyset database table. Database tables with more records than the maximum keyset size will be converted to forward only scrolling tables.
Since keyset database tables provide more functionality, they are usually slower to generate and use more memory. It may be inefficient to use keyset database tables for very large datasets. You can use the maximum keyset size to prevent database tables with more than a certain number of records from being created as keyset tables.
The default maximum keyset size is 50,000 records. You can adjust this setting as follows:
1.Make the Project window active.
2.From the Project menu choose Database Table Preferences.
3.In the Database Table Preferences dialog, set the maximum number of rows in a keyset table to the desired value.
4.Click OK.
The spatial column in the database table contains the word Shape for each record you can see. This column does not contain the actual shape value displayed in the map. The purpose for displaying the word Shape is to indicate the record has a shape value.

Chapter2 QuickstarttutorialforSDE |
25 |
Repairing a database theme’s connection
If you type your password incorrectly or if the SDE server isn’t running, ArcView won’t be able to reestablish the database connection. ArcView will still open your project, but you won’t see any shapes in the map. Until you’ve done some project repair, ArcView will display an error message for each database theme visible in the map that doesn’t have an active connection. After opening the project, you can reestablish the database connections yourself using the Theme Properties dialog.
1.Make your map, the U.S. Counties window, active by choosing U.S. Counties from the Window menu. If U.S. Counties isn’t listed, choose U.S. Counties in the Project window’s Views list, then click Open.
2.Make the States theme active.
3.Click the Theme Properties button  . In the Theme Properties dialog, choose the Definition properties.
4.Click Create a New Connection.
5.Click the Connect button  . A connection dialog appears.
6.Type the appropriate information into the Server:Instance, Username, and Password text boxes, then click Connect. Choose the database containing the tables used in this project (if appropriate).
7.Click OK in the Connection dialog.
8.Click OK in the Theme Properties dialog.
9.Make the Cities theme active.
10.Click the Theme Properties button  .
.
11.Click Use Existing Connection, then choose the connection you created above from this list.
12.Click OK.
13.Repeat steps 9–12 for the Counties theme.
A sample script called SDEODBCREST.AVE has been provided to repair a database table’s connection. You can find information about this script by opening the online help, clicking the index tab, and typing ‘Database Access Extension, Sample Scripts’. Then, Double-click Sample Scripts, choose ‘SDEODBC Restoring disconnesded Database tables’ and click Display.

26 UsingArcViewDatabaseAccess
If the values in the relational database have changed since you created the table, you can see those changes by choosing Refresh from the Table menu. ArcView queries the database again and updates the values in your table.
Scroll right until you can see the Units_1det column in the table. To see all of a record’s attributes at the same time, click on it with the Identify tool  . They appear in the Identify window, which you can enlarge. Scroll down in the database table to review some of the values in the Units_1det field. Most values should be under 20,000.
You can get statistics about the values in this field for all the records selected by the table’s query by following the steps below.
To get statistics for a column of values in a database table
1.Make the Units_1det column active by clicking on its name at the top of the table.
2.From the Field menu, choose Statistics.
3.A message box appears containing statistics for the values in the Units_1det column. There are a total of 3,140 counties in the United States. The maximum number of single, detached houses in a county is 1,538,036, while the minimum number is 22; the mean is 19,230.4.
4.Click OK.
5.Close the table.
How many records have a Units_1det value that falls below the mean? You can find out by creating a new database table to calculate that information.
To create a new database table
1.If the Project window isn’t active, make it active by choosing Sdetutorial.apr (the name you saved this project file under) from the Window menu.
2.From the Project menu, choose Add Database Table. The Add Database Table dialog appears. Choose SDE from the Database Access drop down list. Click Use an existing connection, then choose your connection from the drop-down list.
3.Double-click the Counties table in the Tables list (e.g., World.Counties); it appears in the From box.
4.Double-click the Codemog table in the Tables list (e.g., World.Codemog); it appears in the From box.
5.Place the cursor in the Select box, then type, “Count(*) as Num_Counties, Count(*)/3140*100 as Pct_Counties”.

Chapter2 QuickstarttutorialforSDE |
27 |
6.Place the cursor in the Where box, then type, “World.Counties.Fips = World.Codemog.Fips and World.Codemog.Units_1det < 19230.4”. Instead of typing the column names, you can place them by double-clicking the Columns list.
7.From the Unique Column drop down list, choose <none>.
8.In the Table Name box, give a name for this database table (e.g., County Data).
9.Click Query.
10.Close the Add Database Table dialog.
A new database table is created when you click Query in the Add Database Table dialog. This table shows that 2,496 of 3,140 records, or 79 percent, have a Units_1det value that falls below the mean.
Since the Unique Column was set to <none>, a forward only scrolling database table is created instead of a keyset database table. You can tell that the table is forward only scrolling because the select tool is disabled.
The query created above is called a Select statement. It’s a kind of SQL statement that chooses the data you want to see from the database. A Select statement consists of three parts, or clauses: Select, From, and Where. The Select clause chooses the columns you want to see, From identifies the tables containing the columns, and Where specifies how the tables are joined together and which records you want to see. The queries used to create database themes are similar to SQL Select statements.
More about queries
Earlier you retrieved statistics for the values in the Units_1det column by choosing Statistics from the Field menu. This method won’t always work, depending on how you specify a column of values in the Select statement.
However, you can write a new query to create a database table containing the statistics you want. The following statement retrieves the number of values in the Units_1det column, and the maximum, minimum, and mean values:
SELECT Count(World.Codemog.Units_1det),
MAX(World.Codemog.Units_1det), MIN(World.Codemog.Units_1det),
AVG(World.Codemog.Units_1det) FROM World.Counties, World.Codemog
WHERE World.Counties.Fips = World.Codemog.Fips
You can add other statistical operators to this Select statement to retrieve a complete set of statistical values.

28 UsingArcViewDatabaseAccess
The Select clause in the statement specifies calculations used by the database to create the values that appear in the table. The Count(*) operator counts the records selected by the where clause, the records below the mean Units_1det value. The Select clause also specifies aliases for the calculations (Num_counties and Pct_counties), which become the column names in the database table. If aliases weren’t provided, the columns would be named with the calculations.
If you don’t have a lot of database experience and you’re going to do a lot of work with database themes, you should take the time to learn SQL. The on-line Help topic, “Selecting database theme features by their attributes,” will help you get started. You can find this topic by opening the Help, clicking the Index tab, then typing the topic’s name into the field at the top of the dialog.
The syntax of the queries in this book and in the Help topic are correct for Oracle databases only. Each relational database requires its queries to be a little bit different. For example, some databases are case-sensitive for table and column names, while others aren’t. If you don’t know the characteristics and syntax rules of your database, talk to your database administrator and get documentation for the relational database.
Symbolizing your data can be more than changing its color. You can classify the features in a theme according to their attributes. For your advertising campaign you want to find the counties with the largest number of single, detached houses; you can find them by classifying the Counties theme using the Units_1det column. Use a Natural Breaks type of classification, which divides the values into groups according to their natural distribution.
To classify a theme’s features by their attributes
1.Make the U.S. Counties window active by clicking on its title bar.
2.Zoom into a scale where you can see the Counties theme.
3.Double-click on the Counties name in the map’s Table of Contents to display the Legend Editor.
4.Choose Graduated Color from the Legend Type drop-down list.
5.Choose the Units_1det column from the Classification Field drop-down list. The counties are automatically classified into five classes using an Equal Interval classification. The classes are created by dividing the range between the minimum and maximum by five.
6.Click Classify.
7.Choose Natural Breaks from the Type drop-down list.
8.Click OK. The values represented by each class have changed.

Chapter2 QuickstarttutorialforSDE |
29 |
9.You can change the color of each class by double-clicking on its symbol and assigning a new color from the Symbol Window, or you can change all the colors in the legend at once by choosing a ramp from the Color Ramps drop-down list below.
10.Click Apply. The theme redraws with the new legend.
11.Close the Legend Editor.
Looking at the classified Counties theme in your map you can see that most counties fall into the class with the lowest range of single, detached houses. To see a good crosssection of classes, zoom in to the Southwestern states, particularly California and Nevada, with the Zoom In tool  .
.
The upper limit of the lowest class is 27,706.252. The mean value for the Units_1det column falls well inside the lowest class of values. Since the Natural Breaks analysis has identified this legend class as an associated group of values, it would be helpful to know how many counties are in this class. You can calculate that number by modifying your database table’s query. Change the number in the where clause to 27,700.
To change a database table’s definition query
1.Make the County Data table active by clicking on its window.
2.From the Table menu, choose Properties. The Database Table Property dialog appears, containing the SQL Select statement that was sent to the relational database to create the database table.
3.In the SQL Statement box, delete the number 19230.4, then type in the number 27700.
4.Click OK.
The contents of the database table changes to reflect the new SQL query. The table now shows that 2,703, or 86 percent, of the counties fall within the lowest class in the database theme’s legend.
30 UsingArcViewDatabaseAccess
The candidate counties for the advertising campaign are those falling outside the lowest legend class; that is, counties whose Units_1det value is greater than 27,700. Redefine the Counties theme’s query to represent these counties by changing its where clause.
To change the shapes and attributes a database theme represents
1.Close the database table, then make the U.S. Counties window active by clicking on its title bar.
2.Make the Counties theme active, then click the Theme Properties button  . The Theme Properties dialog appears. Make sure the Definition property is selected.
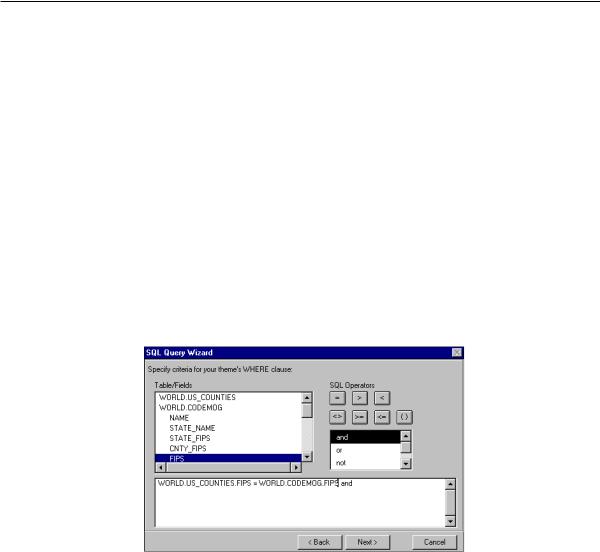
3.Click the Query Builder button  in the Theme Properties dialog. The SQL Query Wizard appears.
4.Click Next. The where clause panel contains the theme’s complete where clause, which includes the join statement.
5.Double-click ‘and’ in the SQL operators list to link the attribute criteria to the join statement in the where clause.
6.Double-click the Codemog table’s name to see a list of its columns.
7.Double-click the name of the Units_1det column. It appears in the where clause below.
8.Click the Greater Than button to add the > operator to the where clause.
9.Type in “27700”. The where clause now contains a join statement and attribute criteria. Click Next.
10.Click Unselect All, then click in the Select column next to the Feature, Name, and State_Name columns. You can provide aliases for these attributes that you’ll see when working with this theme by typing into the Alias column.
Chapter2 QuickstarttutorialforSDE |
31 |
11.From the Table drop-down list, choose the Codemog table.
12.Click Unselect All, then click in the Select column next to the Units_1det field.
13.Click Finish.
14.Click OK in the Theme Properties dialog.
The Counties theme redraws, showing only the counties satisfying the new query. If you identify one of the counties with the Identify tool  , you will see its values for the Name, State_Name, and Units_1det attributes selected above.
In the next exercise, you’ll continue working with this project, so you can begin Exercise 3 now. If you want to exit ArcView now and continue with the next exercise later, remember to save your work.