

Chapter1 WelcometoArcViewDatabaseAccess |
11 |
extension by searching for “Database Access extension, sample extensions” under the index tab of the on-line help.
• Who do I contact if I can’t connect to the database?
Sometimes you won’t be able to connect using ODBC because the database server isn’t running or because of network problems. Make sure you contact the person responsible for maintaining the network and the database to find out what is wrong and solve the problem.
Now you have all the information you need to start using data from the ODBC database in ArcView.
Getting on-line help
To find out what a button, tool, or menu choice does
•Move the cursor over it but do not select it. A short description will appear in the ArcView status bar.
To get more help about a button, tool, or menu choice
1.Click the Help button  .
.
2.Click the button, tool, or menu choice you want to get help about.
To get help about a dialog box
• Press the F1 key on your keyboard when the dialog is displayed.
To browse the contents of ArcView’s help
1.From the Help menu, choose Help Topics.
2.Click the Index tab.
To search ArcView’s help for a particular word
1.From the Help menu, choose Help Topics.
2.Click the Find tab.
Note If you use the Index or Find to locate topics in the on-line help, check the topic to make sure it belongs to the Database Access extension. All help topics for the extension have the name Database Access in the title or the first line of the topic.

12 UsingArcViewDatabaseAccess
Getting technical support from ESRI
Please see the software registration and support card that came with ArcView, or look at the ‘Obtaining technical support’ section of ArcView software’s on-line help.
Visit ESRI on the Web
Find out everything you want to know about ESRI® software, data, and services by visiting ESRI’s Web home page at www.esri.com.

13
C H A P T E R 2
Quick start tutorial for SDE
The exercises in this chapter begin with the basics of creating a map with SDE data and progress to summarizing a database theme’s attributes. They also illustrate how to create database tables and use them in combination with database themes to solve spatial problems.
To follow the exercises, you need access to the SDE database containing state, city, and county spatial data for the United States, and demographic tables for U.S. cities and counties. If you haven’t already spoken to your SDE administrator, do so now before you begin. The section “Before you start the ‘Quick start tutorial exercises’” in Chapter 1 lists the information you need to know.
Each exercise builds on the previous one. You can work through them at your own pace. When you stop, save your work so you can pick up where you left off.
In this chapter, you’ll perform these exercises with the Database Access extension:
•Exercise 1: Make a map of U.S. states, cities, and counties
•Exercise 2: Find counties with many single family homes
•Exercise 3: Find locations for an advertising campaign

14 UsingArcViewDatabaseAccess
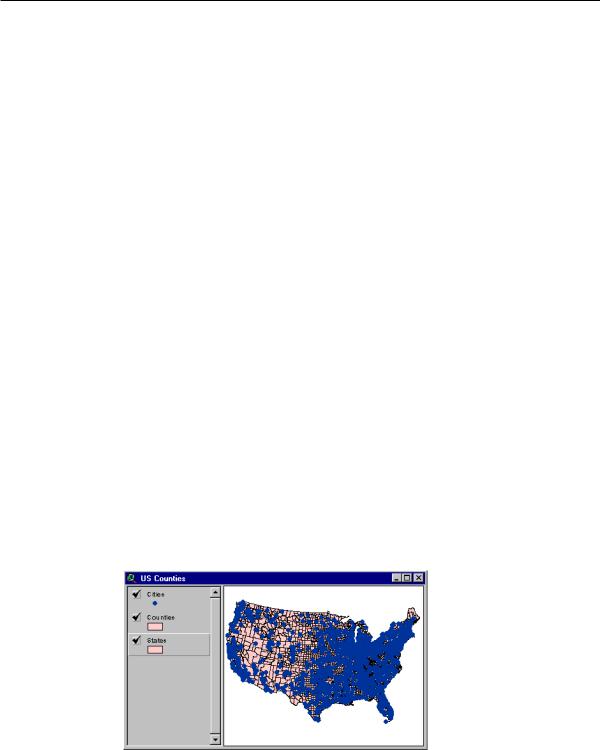
Exercise 1: Make a map of U.S. states, cities, and counties
Suppose you work for a national insurance company that wants to encourage home owners to purchase a new insurance package on their houses. Your job is to find out where to focus an advertising campaign. You want to start the campaign off by advertising in urban areas in a few states. You’re going to find out where to advertise by evaluating U.S. counties according to their demographic data.
The first step in solving this problem is to bring all your data together in an ArcView map. The map will include State, City, and County themes, and the County theme will include demographic data. This map will serve to illustrate trends in the County demographic data using various analysis techniques in later exercises.
In this exercise, you’ll learn how to:
•Load ArcView extension software.
•Create new database themes.
•Identify a feature in a map.
•Change the color of a theme.
•Set the projection of a map.
•Set a theme’s display properties.
•Save your work.
Start ArcView. Before you can start assembling a map, you need to load the Database Access extension. Loading the extension makes the required components available for connecting ArcView to an SDE database and working with SDE data.
To load ArcView extensions
1.Make the Project window active.
2.From the File menu, choose Extensions.
3.Click the check box next to Database Access.
4.Click OK.
You’ll create the map in two stages, adding the state and cities data together, then adding the county data with its demographics. The steps below show how to add simple database themes to your map.
Chapter2 QuickstarttutorialforSDE |
15 |
To make a map and add simple database themes
1.In the Project window, double-click on Views  to create a new map.
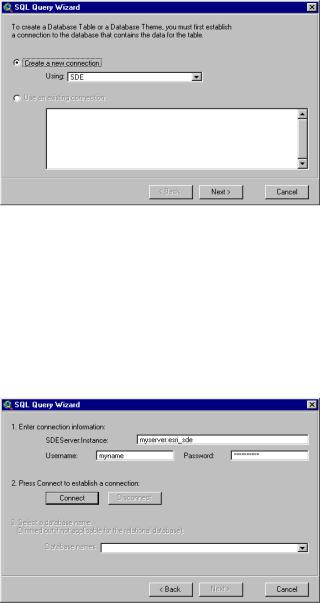
2.From the View menu, choose Add Database Theme. The SQL Query Wizard dialog appears. It will guide you through the steps of adding database themes to your map.
3.Click Create a new connection, then press Next.
4.First, type the appropriate information into the Server:Instance, Username, and Password text boxes. (If you don’t know what to type, read “Before you start the ‘Quick start tutorial exercises’” in Chapter 1.) Be careful when you type; SDE is case sensitive with these text strings. Second, click Connect. When the Connect button is dimmed out, you’ve successfully connected to the SDE server.
Third, if not dimmed out, choose the database containing the U.S. state, city, and county data. Some relational databases group related tables into a database; for them, a list of database names will appear in the drop-down list. You can only access one database of tables at a time with a connection.
Continue by pressing Next.
16UsingArcViewDatabaseAccess
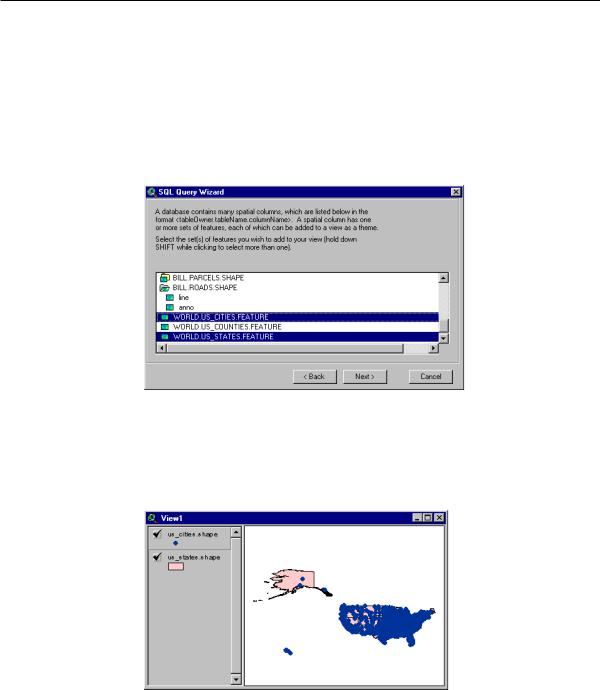
5.Choose the States and Cities spatial columns from the list (hold down SHIFT and click on them). The list won’t show the names “States” and “Cities.” The States spatial column will look something like “World.States.Shape”. In this example, the user “World” owns the table “States”, which has a spatial column called “Shape”.
There is no way for this exercise to know what the tables will be called in your database or who will own them. There are no restrictions for naming spatial columns; they might be called “Feature” or “Geometry”.
Continue by pressing Next.
6.Click Create a theme(s) from the selected set(s) of features, then press Finish. Your map now contains two database themes, which are named for their spatial column.
7.Draw the States and Cities themes by clicking the check box next to the theme names in the map’s Table of Contents. Make sure that the Cities theme is listed at the top of the Table of Contents so that it draws on top of the States theme. You can change the order by dragging themes up or down in the Table of Contents.
8.Change the names of the themes to Cities and States, respectively. First, make the theme active by clicking on its name in the map’s Table of Contents, and then click
Chapter2 QuickstarttutorialforSDE |
17 |
the Theme Properties button  . In the Theme Name text box, type the appropriate name. Click OK.
A table in your database contains U.S. county data; it has a spatial column for county shapes and other columns with basic information. Another table contains demographic data for each county. If you created a database theme from the county table using the steps above, it wouldn’t have any demographic data. To include demographic data in the theme, you need to join the county and demographic tables together using a column that they have in common (FIPS), whose values are the same in both tables.
The following steps show you how to create a database theme with joined tables. They refer to the county table as Counties and the demographic table as Codemog.
To add database themes with joined tables
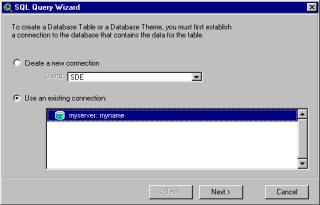
1.From the View menu, choose Add Database Theme. The SQL Query Wizard dialog appears.
2.Click Use an existing connection, then choose the connection used by the States and Cities themes. Press Next.
3.Choose the Counties spatial column from the list, then press Next.
4.Click Create a theme containing a subset of features or with joined table(s), then press Next.
5.Choose the Codemog table from the Available Tables list, and add it to the Selected Tables list by clicking the ‘>’ button. If you can’t find the Codemog table in the list, you’re connected to the wrong database or you don’t have permission to select data from it. Talk to your database administrator before continuing with this exercise. Press Next.
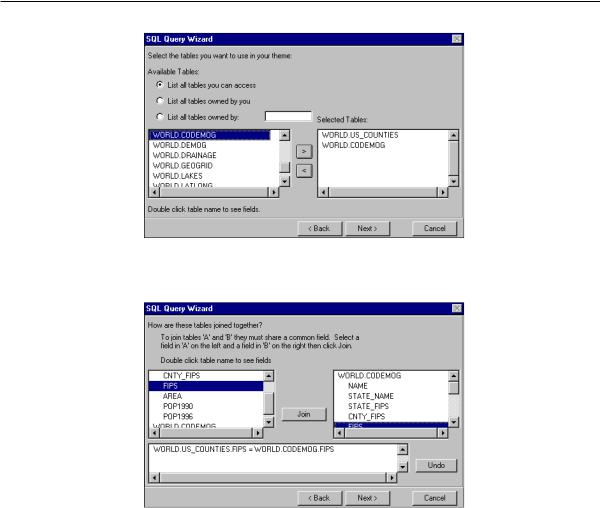
18 UsingArcViewDatabaseAccess
6.Double-click the Counties table in one list and the Codemog table in the other to see a list of the columns in each table. Choose the FIPS column in each list, then click Join. The join statement appears below. Press Next.
7.Add this theme to your map by stepping through the rest of the wizard without making any more selections. Your map now contains another theme, which is named for its spatial column.
8.Draw the Counties theme by clicking the check box next to its name in the map’s Table of Contents. Make sure the Cities theme is listed at the top of the Table of Contents so it draws on top of the States and Counties themes.
9.Change the name of the new theme to Counties. Make the theme active, click the
Theme Properties button  , then type the new name into the Theme Name text box. Click OK.
The only way to see data from a relational database in ArcView is to build a query that selects the data you want. Database themes are themes that display the shapes contained in a spatial column for all the rows that a query retrieves from the database. A database
Chapter2 QuickstarttutorialforSDE |
19 |
theme’s attributes are values in the nonspatial columns retrieved by the query. A database theme can’t include data stored in system files on your computer.
When you added the Counties theme to the map you created a query that joined two tables together. You also created a query when you added the States and Cities themes to the map, but you didn’t add anything extra to it. The SQL Query Wizard builds the query for you based on your choices as you step through the dialog.
The queries for the States and Cities themes retrieve all rows and columns in the States and Cities tables, respectively. The query for the Counties theme selects all columns in both the Counties and Codemog tables, and all rows where the FIPS values in the Counties table equal the FIPS values in the Codemog table. For example, if the Codemog table had demographics for the State of New Hampshire only, the theme would only display New Hampshire counties.
You can see the attributes of any feature in a map using the Identify tool  . Identifying a feature in the States or Cities theme will display attribute values from all columns in the States and Cities tables, respectively. Identifying a feature in the Counties theme will display attribute values from all columns in both the Counties and Codemog tables.
To identify a feature in a map
1.Make the theme whose features you want to identify active by clicking on its name in the map’s Table of Contents.
2.Click the Identify tool  .
.
3.Click on one of the features you want to identify. The feature you click on flashes in the map, and its attributes appear in the Identify Results dialog.
Now that the map contains the required data, start customizing the way it looks. You can change the colors of the themes, the map’s projection, and the themes’ display properties.
The theme’s colors were randomly assigned when the themes were created. To change their colors, use the Legend Editor.
To change the color of a theme
1.Make the States, Cities, and Counties themes active by holding down the SHIFT key while clicking on their names in the map’s Table of Contents.
2.Click the Legend Editor button  .
.
3.Choose a theme’s name from the Theme drop-down list.
4.Double-click the symbol to display the Symbol Window.
5.In the Symbol window, click the Color button  to display the Color Palette.
20UsingArcViewDatabaseAccess
6.In the Color Palette, click the color you want to use for the theme.
7.Click Apply in the Legend Editor.
8.Repeat steps 3–7 for the other themes in the Theme drop-down list.
9.Close the Legend Editor and the Symbol Window.
When all the themes in a map have shapes whose coordinates are in decimal degrees, you can project the map. The projection fits a map’s shapes to a view of the earth’s surface. If you leave the Projection set to None (the default) your map fits the longitude/latitude coordinates to a rectangle instead of the surface of the earth.
Spatial columns might contain shapes which are already projected. You can add themes from these spatial columns to a map, but you won’t be able to change their projection with ArcView. All themes in a map must have the same projection to see them at the same time. The United States themes in your map have shapes with decimal degrees coordinates. For this map, use the Albers Equal-Area (Conterminous U.S.) projection.
To set the projection for a map
1.From the View menu, choose Properties.
2.Click the Projection button.
3.From the Category drop-down list, choose Projections of the United States.
4.From the Type drop-down list, choose Albers Equal-Area (Conterminous U.S.).
5.Click OK in the Projection Properties dialog.
6.Click OK in the View Properties dialog.
The Scale field in the tool bar shows the current scale of your map, which changes automatically if you zoom in or out. To display the map at a particular scale, type the scale into the Scale box, then press Return. For this tutorial, zoom into the continental states with the Zoom In tool  .
.
Chapter2 QuickstarttutorialforSDE |
21 |
Your map should always display a level of detail appropriate to its scale. When your map displays the entire United States, states are the appropriate level of detail. When you zoom in, counties are more appropriate. You control the scale a theme draws at by setting its display property using the Theme Properties dialog. A theme’s display scale is particularly important if it selects a large number of features from the database.
To set a theme’s display property
1.Make the Counties theme active.
2.Click the Theme Properties button  .
.
3.In the Theme Properties dialog, click Display. The display property panel appears.
4.Type “25000000” into the Maximum Scale field. Now you’ll only see states when your map’s scale is larger than 1:25,000,000 (e.g., 1:1,000,000).
5.Click OK.
When your map redraws, the Counties shapes won’t appear. With the display property set, your map is now easier to explore. Try using the Zoom In tool  to draw a box around the State of Florida. Then, you can go back to your view of the continental states by clicking the Zoom to Previous Extent button
  . Change your map’s scale to 1:30,000,000 by typing “30000000” into the Scale box then pressing Return. You’ll get the right amount of detail for your current scale while you’re exploring your map.
In the next exercise, you’ll continue working with this project, so you can continue with Exercise 2 now. If you want to exit ArcView now and continue with the next exercise later, remember to save your work.
To save your work
1.From the Window menu, choose Untitled to make the Project window active.
2.From the File menu, choose Save Project.
3.In the dialog that appears, specify a name (e.g., Sdetutorial) and location for the new project file, then click OK. ArcView will automatically add the .apr extension to the name you gave for the new project file.
When you save your project, ArcView doesn’t store the theme’s values in the project; it stores the query used to get the values from the database. If you close your project now and open it again later, you will be prompted to log in. When you do, ArcView will reestablish its connection to the database and retrieve the shapes and values for the themes in your map.