

Global corporate finance - Kim
.pdf192 FINANCIAL SWAPS
Questions
1Why have currency swaps replaced parallel loans?
2Explain both interest rate swaps and currency swaps. Which instrument has a greater credit risk: an interest rate swap or a currency swap?
3How can a typical mortgage company use an interest rate swap to escape the interest rate risk?
4How can multinational companies utilize a currency swap to reduce borrowing costs?
5If you expect short-term interest rates to rise more than the yield curve should suggest, would you rather pay a fixed long-term rate and receive a floating short-term rate, or receive a fixed long-term rate and pay a floating short-term rate?
6What is the role of the notional principal in understanding swap transactions? Why is this principal amount regarded as only notional?
7Comment on the following statement: “If one party benefits from a swap, the other party must lose.”
8What are call swaptions and put swaptions? Compare a call swaption with an interest rate cap.
9Describe an interest rate collar. How will it be used?
10What are advantages of financial swaps over currency futures and options?
11What are major limitations of financial swaps?
Problems
1A swap agreement covers a 5-year period and involves annual interest payments on a $1 million principal amount. Party A agrees to pay a fixed rate of 12 percent to party B. In return, party B agrees to pay a floating rate of LIBOR + 3 percent to party A. The LIBOR is 10 percent at the time of the first payment. What is the difference (the net payment) between the two interest obligations?
2Assume that the current spot rate for the Polish zloty is 2.5 zlotys per dollar ($0.40 per zloty), the US interest rate is 10 percent, and the Polish interest rate is 8 percent. Party C wishes to exchange 25 million zlotys for dollars. In return for these zlotys, party D would pay $10 million to party C at the initiation of the swap. The term of the swap is 5 years and the two firms will make annual interest payments. The spot rate for the zloty changes to 2.2222 zlotys per dollar or $0.45 per zloty at year 1. What is the net payment for year 1?
3A mortgage company (party E) has just lent $1 million for 5 years at 12 percent with annual payments, and it pays a deposit rate that equals LIBOR + 1 percent. With these rates, the company would lose money if the LIBOR exceeds 11 percent. This vulnerabil-

|
CASE PROBLEM 7 |
193 |
|
|
|
|
|
|
|
|
|
|
|
|
|
ity prompts the mortgage company to enter an interest rate swap with party F. This swap agreement covers a 5-year period and involves annual interest payments on a $1 million principal amount. Party E agrees to pay a fixed rate of 12 percent to Party F. In return, party F agrees to pay a floating rate of LIBOR + 3 percent to party E. Determine an annual net cash flow available for the mortgage company.
4The current spot rate for the Polish zloty is 2.5 zlotys per dollar or $0.40 per zloty. Party G has access to zlotys at a rate of 7 percent, while party H must pay 8 percent to borrow zlotys. On the other hand, party H can borrow dollars at 9 percent, while party G must pay 10 percent for its dollar borrowings. Party G wishes to obtain $10 million in exchange for 25 million zlotys, while party H wants to obtain 25 million zlotys in exchange for $10 million. How can these two parties achieve a lower borrowing rate?
REFERENCES
Abken, P. A., “Beyond Plain Vanilla: A Taxonomy of Swaps,” Economic Review, Federal Reserve Bank of Atlanta, Mar./Apr. 1991, pp. 12–29.
Ball, D. A., W. H. McCulloch, J. M. Geringer, P. L. Frantz, and M. S. Minor, International Business, Boston, MA: McGraw-Hill/Irwin, 2004, ch. 19.
Einzig, R. and B. Lange, “Swaps at Transamerica: Analysis and Applications,” Journal of Applied Corporate Finance, Winter 1990, pp. 59–71.
Feinberg, P., “Swaps, Caps and Collars Protect Companies from Interest Rate Swings,” Cash Flow, Aug. 1988, pp. 54–5.
Marks, R. D. and L. A. Herald, “An Interest-Rate Game Plan,” Financial Executive, Nov./Dec. 1992, pp. 39–42.
Nofsinger, J. and K. Kim, Infectious Greed, Upper Saddle River, NJ: Prentice Hall, 2003.
Orlando, D. K., “Swaptions Offer New Keys to Better Protection,” Corporate Cash Flows, July 1990, pp. 33–6.
Picker, I., “Son of Swaps,” Institutional Investor, Feb. 1991, pp. 83–8.
Ronner, A. and M. Blok, “Hedging Foreign Currency Exposure: Consequences of FAS 133,”
Journal of Applied Finance, Vol. 11, No. 1, 2001, pp. 25–34.
Case Problem 7: Regulations of Derivatives
Markets
Financial derivatives – forwards, futures, options, and swaps – are contracts whose values are linked to or derived from values of underlying assets, such as securities, commodities, and currencies. There are two types of markets for financial derivatives: organized exchanges and over-the-counter (OTC) markets. Organized exchanges such as the Chicago Mercantile Exchange are regulated by governments, while OTC markets such as banks are unregulated. Derivatives are used by corporations, banks, and investors to reduce a variety of risks, such as exposure to currency movements (hedging), or to make leveraged bets on the market direction of these instruments (speculation).
194 FINANCIAL SWAPS
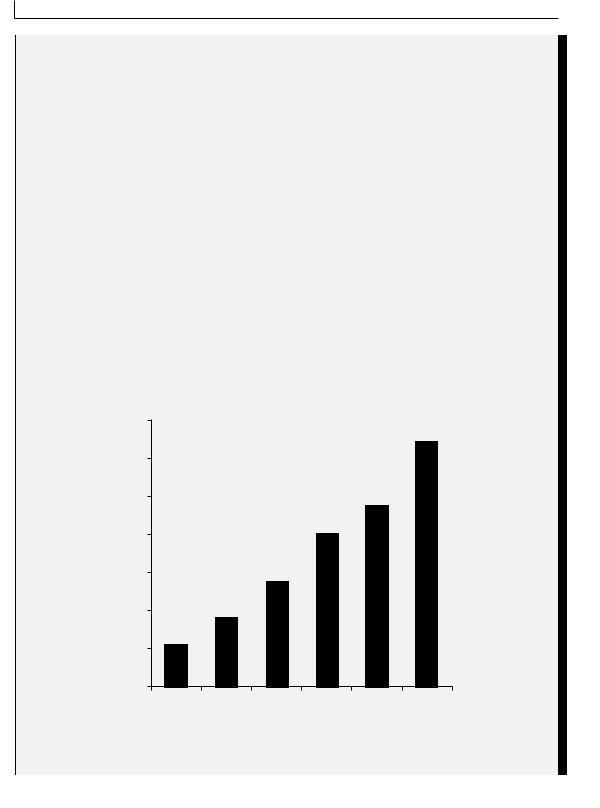
Derivatives markets have shown extraordinary growth over the past few years. For example, the size of the global OTC derivatives markets increased from $21 trillion of contracts in 1992 to $130 trillion of contracts in 2002 (see figure 7.6); the amount of outstanding exchangetraded derivatives exceeded $20 trillion in 2002. In addition, recent years have witnessed numerous accounts of derivative-related losses on the part of established and reputable firms. Large losses associated with the use of derivatives include the US oil subsidiary of Metallgesellschaft ($1 billion), Daiwa Bank of Japan ($1 billion), Kashima Oil of Japan ($1.5 billion), Showa Shell of Japan ($1.5 billion), Sumitomo Corp. of Japan ($1.8 billion), Orange County, California ($1.7 billion), Barings of the UK ($1.3 billion), Long-Term Capital Management of the USA ($3 billion), and Allied Irish Bank of the USA/UK ($691 million). All these derivativerelated losses have occurred since 1994. The recent rapid growth of derivatives markets and large derivative-related losses have triggered concern and even alarm over the dangers posed by the widespread use of derivatives.
On February 27, 1995, speculative trading by a 28-year-old trader contributed to bringing down Barings PLC, the oldest merchant bank in the UK. In the days that followed, investigators found that the bank’s total losses from 1992 to 1995 exceeded $1 billion, a sum larger than its entire $860 million in equity capital. Barings had hired the British trader Nicholas Leeson from Bankers Trust in 1992 to build global fixed-income securities in Singapore. The cause of these losses was a breakdown in Barings’ risk management system that allowed Leeson to accumulate and conceal an unhedged $27 billion position in various exchange-traded futures and options contracts.
$ trillions |
|
|
|
|
|
140 |
|
|
|
|
|
120 |
|
|
|
|
|
100 |
|
|
|
|
|
80 |
|
|
|
|
|
60 |
|
|
|
|
|
40 |
|
|
|
|
|
20 |
|
|
|
|
|
0 |
|
|
|
|
|
1992 |
1994 |
1996 |
1998 |
2000 |
2002 |
|
|
Year |
|
|
|
Figure 7.6 The size of the over-the-counter derivatives market
Source: Authors’ graphic based on data from several issues of The Wall Street Journal.

|
CASE PROBLEM 7 |
195 |
|
|
|
|
|
|
|
|
|
|
|
|
|
What lessons do these losses and growth hold for policy-makers? Do they indicate the need for more strict government supervision of derivatives markets or for new laws and regulations to limit the use of these instruments? Apparently, US regulatory authorities think that derivatives pose inherent dangers. In the first half of 1997, Congress had introduced some half-dozen bills designed to ban or limit derivatives. In January 1997, the Securities and Exchange Commission (SEC) adopted a regulation requiring companies to present estimates of losses they could suffer from financial instruments. The Financial Accounting Standard Board (FASB) adopted its Statement 133, Accounting for Derivative Instruments and Hedging Activities, in 1998. FASB 133 requires companies to report the fair market value of their derivatives on their balance sheets and to include some derivatives gains or losses on their income statements. The legal status of derivatives was further cast into doubt in 1998, when the Commodity Futures Trading Commission (CFTC) suggested that it had the right to regulate trading in these instruments under the Commodity Futures Trading Commission Act of 1974. Especially big targets of these reforms are privately negotiated contracts through OTC markets.
Since 1997, several hundred letters from big companies, accountants, and even Federal Reserve Chairman Alan Greenspan have laid out the potential damage of these derivatives regulations. In February 2000, a White House panel on OTC derivatives urged Congress to exempt the $80 trillion derivatives market from government regulation. Nevertheless, standard-setters around the world – the USA, the UK, Canada, other industrial countries, and the International Accounting Standards Committee – have recently proposed and/or issued their standards to increase disclosure of off-balance-sheet derivatives transactions.
Case Questions
1What are the major classes of risk in derivatives trading?
2What is the potential damage of government derivative rules on derivatives users?
3Had there been any warning signs that should have alerted the management of Barings to problems with its Singapore futures subsidiary?
4What lessons for the management of financial institutions to be learned from the failure of Barings?
5The website of the Securities and Exchange Commission (SEC), www.sec.gov, and the website of the Financial Accounting Standards Board (FASB), www.fasb.org, describe standard practices for financial reporting by companies in the USA. Access the above websites to learn proposed accounting standards and the status regarding reactions to these proposed standards.
Sources: R. Kolb, Futures, Options, and Swaps, 3rd edn, Malden, MA: Blackwell, 2000, pp. 779–83; S. McGee and E. MacDonald, “Pre-emptive Strike by Derivatives Players,” The Wall Street Journal, Feb. 21, 1997, pp. C1, C13; A. Kuprianov, “Derivatives Debacles: Case Studies of Large Losses in Derivatives Markets,” Economic Quarterly, Federal Reserve Bank of Richmond, Fall 1995, pp. 1–39.

CHAPTER 8
Exchange Rate Forecasting
Opening Case 8: Mundell Wins Nobel Prize in Economics
One major finding by Robert A. Mundell, who won the Nobel Prize in economics in 1999, has become conventional wisdom: when money can move freely across borders, policy-makers must choose between exchange rate stability and an independent monetary policy. They cannot have both. Professor Mundell remains a fan of the gold standard and fixed exchange rates at a time when they are out of favor with most economists. “You have fixed rates between New York and California, and it works perfectly,” he has said. This statement implies that if the US dollar works well for 50 US states, a common currency such as the euro should also work well for its member states, the eurozone countries.
The Nobel committee praised Mundell’s research into common-currency zones for laying the intellectual foundation for the 11-country euro. In 1961, when European countries were still faithful to national currencies, he described circumstances in which nations could share a common currency. Mundell’s Nobel Prize in economics has renewed the focus on the fixed exchange rate system. First, economists and policymakers failed to forecast recent currency crises in Asia, Europe, Latin America, and Russia. Second, advocates of flexible exchange rates had argued that under the float- ing-rate system, exchange rates would be stable, trade imbalances would fall, and countries would not need reserves, but none of these predictions proved to be true.
“The benefits of the euro will derive from the transparency of pricing, stability of expectations, lower transaction costs, and a common monetary policy run by the best minds that Europe can muster,” Mundell wrote in 1998. The stability of expectations under a single currency would reduce exchange rate uncertainty, prevent speculative attacks, and eliminate competitive devaluations. The benefits of switching to a single

MEASURING EXCHANGE RATE CHANGES |
197 |
|
|
currency come with costs, however. Probably the biggest cost is that each country relinquishes its right to set monetary policy to respond to domestic economic problems. In addition, exchange rates between countries can no longer adjust in response to regional problems. Still, economists and policy-makers believe that the benefits of the euro far exceed its costs.
Mundell believes that the euro will eventually challenge the dollar for global dominance. He said in 1998: “The creation of the euro will set new precedents. For the first time in history, an important group of independent countries have voluntarily agreed to relinquish their national currencies, pool their monetary sovereignties, and create a supercurrency of continental dimensions. The euro will create an alternative to the dollar in its role as unit of account, reserve currency, and intervention currency.” As a result, he regards the introduction of the euro as the most important event in the history of the international monetary system since the dollar took over from the pound the role of dominant currency during World War I.
Sources: G. Eudey, “Why is Europe Forming a Monetary Union?” Business Review, Federal Reserve Bank of Philadelphia, Dec. 1998, p. 21; R. Mundell, “The Case for the Euro,” The Wall Street Journal, Mar. 25, 1998; and M. M. Phillips, “Mundell Wins Nobel Prize in Economics,” The Wall Street Journal, Oct. 14, 1999, pp. A2, A8.
Because future exchange rates are uncertain, participants in international markets never know with certainty what the spot rate will be in 2 months or in 1 year. Thus, currency forecasts are a necessity. In other words, the quality of a company’s decisions depends on the accuracy of exchange rate projections. If investors forecast future spot rates more accurately than the rest of the market, they have an opportunity to realize large monetary gains.
This chapter covers four related topics: (1) measuring a change in exchange rates; (2) forecasting the needs of a multinational company (MNC); (3) forecasting floating exchange rates; and (4) forecasting fixed exchange rates. Floating exchange rates are rates of foreign exchange determined by the market forces of supply and demand, without government intervention on how much rates can fluctuate. Fixed exchange rates are exchange rates which do not change, or they fluctuate within a predetermined band.
8.1 Measuring Exchange Rate Changes
An exchange rate is the price of one currency expressed in terms of another currency. As economic conditions change, exchange rates may become substantially volatile. A decrease in a currency’s value relative to another currency is known as depreciation, or devaluation. Likewise, an increase in a currency’s value is known as appreciation, or revaluation. MNCs frequently measure a percentage change in the exchange rate between two specific points in time; that is, the current exchange rate and the forecasted exchange rate 1 year ahead.
When the exchange rates from two specific points in time are compared, the beginning exchange rate is denoted as e0 and the ending exchange rate is denoted as e1. The percentage

198 |
EXCHANGE RATE FORECASTING |
|
|
||
|
|
||||
|
change in the value of a foreign currency relative to the home currency is computed as |
||||
|
follows: |
|
|
||
|
percentage change = |
(e1 - e0 ) |
|
(8.1) |
|
|
e0 |
|
|||
|
|
|
|
|
|
|
Alternatively, the percentage change in the value of a domestic currency is computed as follows: |
||||
|
percentage change = |
|
(e0 - e1) |
(8.2) |
|
|
|
e1 |
|||
|
|
|
|
|
|
A positive percentage change represents a currency appreciation, while a negative percentage change represents a currency depreciation.
Example 8.1
Assume that the exchange rate for the Swiss franc changed from $0.64 on January 1 to $0.68 on December 31. In this case, the percentage change in the exchange rate for the franc against the dollar can be expressed in two different ways, but they have the same meaning. From a franc perspective, we can say that the franc’s value against the dollar appreciated from $0.64 to $0.68. From a dollar perspective, we can say that the dollar’s value against the franc depreciated from $0.64 to $0.68.
The percentage change in the spot rate for the franc (a foreign currency) can be computed by using equation 8.1:
percentage change = $0.68 - $0.64 = -0.0625 $0.64
Alternatively, the percentage change in the spot rate for the dollar (a domestic currency) against the foreign currency can be computed by using equation 8.2:
percentage change = $0.64 - $0.68 = -0.0588 $0.68
Thus, a change in the exchange rate from $0.64 to $0.68 is equivalent to a franc appreciation of 6.25 percent or a dollar depreciation of 5.88 percent. It is important to note that the two exchange rate changes are not equal to each other. The amount of franc appreciation is not equal to the amount of dollar depreciation, because the value of one currency is the inverse of the value of the other currency. In other words, the percentage change in the exchange rate differs because the base rate from which it is measured differs.

THE FORECASTING NEEDS OF THE MULTINATIONAL COMPANY |
199 |
|
|
8.2 The Forecasting Needs of the Multinational Company
Virtually all aspects of multinational operations may be influenced by changes in exchange rates. Thus, an MNC needs foreign-exchange forecasts for many of its corporate functions, although future foreign-exchange rates are not easy to forecast (see Global Finance in Action 8.1).
Global Finance in Action 8.1
Tracking the US Dollar
The dollar goes up, the dollar goes down. Recently, it has been down. From January 2, 2002, to March 7, 2003, the dollar fell 20 percent against the euro, 10 percent against the British pound, and 13 percent against the Japanese yen. Historically, such fluctuations are not unusual, though they are seldom easy to explain.
Ask an economist to describe the reasons for the greenback’s recent decline, and the reply will include a furrowed brow. Few subjects are as complicated or confounding to us as the foreign-currency exchange rate market – the deepest, most liquid, and one of the least regulated markets in the world.
Each day, more than $1 trillion in currency trades in the foreign-exchange market. Many participants and factors affect the value of one currency versus another. The market consists of a worldwide cast of businesses, investors, speculators, governments, and central banks, acting and reacting on the basis of a mix of forces such as trade patterns, interest rate differentials, capital flows, and international relations.
As the dollar has recently undergone its worst slide against European currencies since 1987, the overarching reason can be attributed to a reduced demand to place investment funds in the USA, a situation quite different from that of the late 1990s. Between 1995 and 2000, the attractiveness of US capital markets resulted in the dollar rising 20 percent against other major currencies. Recently, with the decline in the US stock market as well as lower interest rates on US government securities, outside investors have turned skittish. Other confidence crushers include the corporate accounting scandal of 2002 and rising tensions with Iraq and North Korea.
A weakened dollar, despite the negative connotation, does carry certain benefits. Although American travelers and businesses are not able to stretch their money as far on foreign soil, the opposite is also true: foreign consumers are able to purchase more US goods with their beefed-up currency. Such behavior, in theory, could help reduce the US trade deficit, which swelled to a record $44.2 billion in December 2002.
If the dollar’s recent decline can be attributed to the slowdown in the US economy, along with corporate governance and geopolitical uncertainties, then recent weakness in the dollar is not a matter for serious concern. As the economy rebounds, we would expect foreign investment to make a comeback, and the dollar with it. So, remember: the dollar goes up, the dollar goes down. These are normal fluctuations in a well-functioning and vigorously competitive market.
Source: William Poole, “Tracking the US Dollar,” A Quarterly Review of Business and Economic Conditions, Apr. 2003, p. 3.

200 EXCHANGE RATE FORECASTING
8.2.1The hedging decision
MNCs have a variety of foreign currency denominated payables and receivables: credit purchases and credit sales whose prices are stated in foreign currencies, borrowed and loaned funds denominated in foreign currencies, and uncovered forward contracts. These payables and receivables are exposed to foreign-exchange risks due to unexpected changes in the future exchange rate. A company’s decision to hedge against these potential losses may be determined by its forecasts of foreign-currency values.
8.2.2Working capital management
Working capital management consists of short-term financing and short-term investment decisions. The value of the currency borrowed or invested will change with respect to the borrower’s or the investor’s local currency over time. The actual cost of a foreign bank credit to the borrower depends on the interest rate charged by the bank and the movement in the borrowed currency’s value over the life of the loan. Likewise, the actual rate of return on a short-term foreign investment consists of the rate of return on the investment in a local currency and the amount of the change in the local currency value.
When MNCs borrow money, they have access to a number of different currencies. As a result, they would wish to borrow money in a currency whose rate of interest is low and whose value will depreciate over the life of the loan. MNCs sometimes have a substantial amount of excess funds available for a short-term investment. Large short-term investments may be made in a number of different currencies. The ideal currency for such an investment should have a high interest rate and should appreciate in value over the investment period.
8.2.3Long-term investment analysis
The evaluation of foreign direct and portfolio investments requires exchange rate forecasts well into the future. An important feature of foreign investment analysis is the fact that project cash inflows available to the investor depend partially on future exchange rates. There are several ways in which exchange rates can influence the estimated cash inflows. The key point here, however, is that accurate forecasts of future exchange rates will improve the estimates of the cash inflows and thus improve a company’s decision-making process.
Some institutions, such as pension funds and insurance companies, invest a substantial portion of their money in foreign stocks and bonds. As with short-term investors, portfolio investors wish to invest in a currency that would have a high rate of return and would appreciate in value over the investment period.
8.2.4The long-term financing decision
When MNCs issue bonds to obtain long-term funds, they can denominate their bonds in foreign currencies. Like short-term financing, companies would prefer to denominate the bonds in a cur-

FORECASTING FLOATING EXCHANGE RATES |
201 |
|
|
rency that would depreciate in value over the life of the bond. To estimate the cost of issuing bonds, companies will have to forecast exchange rates.
8.2.5Other uses
There are additional situations that require companies to use exchange rate forecasts. First, companies need exchange rate forecasts to assess foreign subsidiary earnings. Most MNCs are required to consolidate the earnings of subsidiaries into those of the parent if the parent owns more than a certain percentage of the subsidiary’s voting shares. In other words, when an MNC reports its earnings, it has to consolidate and translate subsidiary earnings into the parent currency. Forecasts of exchange rates, therefore, play an important role in the overall estimate of a company’s consolidated earnings.
Second, if a company wishes to buy or sell a product in a foreign currency, it has to forecast the effective exchange rate at the time of transaction. Third, if a company wants to remit its foreign profits to the parent country at some point in the future, it has to forecast the effective exchange rate at the time of remittance.
8.3 Forecasting Floating Exchange Rates
This section opens by first questioning the validity of generating exchange rate forecasts. This question is based on the assumption that market exchange rates reflect all currently available information, thereby making it futile to attempt forecasting exchange rates.
8.3.1Currency forecasting and market efficiency
Banks and independent consultants offer many currency-forecasting services. Some MNCs have in-house forecasting capabilities. Yet, no one should pay for currency-forecasting services if foreign-exchange markets are perfectly efficient. The efficient market hypothesis holds that: (1) spot rates reflect all current information and adjust quickly to new information; (2) it is impossible for any market analyst to consistently “beat the market”; and (3) all currencies are fairly priced.
Foreign-exchange markets are efficient if the following conditions hold: First, there are many well-informed investors with ample funds for arbitrage opportunities when opportunities present themselves. Second, there are no barriers to the movement of funds from one country to another. Third, transaction costs are negligible. Under these three conditions, exchange rates reflect all available information. Thus, exchange rate changes at a given time must be due to new information alone. Because information that is useful for currency forecasting tends to arrive randomly, exchange rate changes follow a random walk. In other words, no one can consistently beat the market if foreign-exchange markets are efficient. Because all currencies are fairly priced in efficient exchange markets, there are no undervalued currencies and therefore no investors can earn unusually large profits in foreign-exchange markets.
Financial theorists define three forms of market efficiency: (1) weak-form efficiency, (2) semi- strong-form efficiency, and (3) strong-form efficiency. Weak-form efficiency implies that all